The Maria
Openings over Feed Domes
The computational environment
This paper measures the maria of today’s Moon and reads them through the construction described in the earlier papers of the series. Two things must therefore be fixed before any measurement is read: the stage of the construction to which each statement refers, and the data from which each number is taken. The table below fixes both. Its upper rows recall the geometry of the construction (Paper 3); its lower rows name the maps of basalt, gravity, chemistry, craters and elevation on which every study of the paper is carried out.
| Quantity or condition | Definition in this paper |
|---|---|
| Stage of construction | The body seated on the tip of the Earth’s pear and fed from within, through the three stages of Paper 3: the outward rounding, the flattening and the inward rounding; then release |
| The tip of the pear | 6,000 km across at the start of the rounding, 3,000 km at release; the base of the pear 9,000–11,000 km (Paper 3) |
| The hill and the contact | The hill, the base of the bulge, 6,000 km across, centred today at 16.6°N 13.1°E; the contact, the last 3,000 km, centred at 24.1°N 335.2°E (Paper 3, §B.4) |
| Exposure zones | By the rule of proportional share: a near-side cap of 31°, a belt from 31° to 70°, and the contact disc (Paper 3, §B.4) |
| Leading and trailing | The standard convention: the leading half is centred on 90°W, the trailing half on 90°E |
| Comparisons | Like for like: maria removed from both sides of every comparison of the ground, and said so |
| Basalt map | LROC global mare map, 644 polygons grouped in 646 units under 97 names [S1] |
| Gravity | GRAIL GRGM1200L Bouguer, degrees 6–660, crustal density 2,550 kg/m³ [S2] |
| Chemistry | Kaguya Multiband Imager FeO and TiO, about 240 m [S3]; Lunar Prospector thorium, about 60 km [S4] |
| Craters | Robbins (2019), 20 km and more [S5]; Wang & Wu (2021), 1 km and more [S6] |
| Topography | SLDEM2015, about 60 m [S7] |
Several rows need a word of explanation. The construction. In the LEF model the Moon was not thrown off finished: it was built as a body standing on the Earth, seated on the tip of a long extension of the Earth’s own material, the pear, and fed from within through openings in its shell. Paper 3 follows that body through three stages — it rounded outward from a squashed shape into a ball, was flattened by the spin, and rounded inward again as the flattening relaxed and it grew denser — and it was round, its outer shell rigid, when it was released. The whole construction, from the start of the bulge to release at 3.873 Ga, spans about 600 Myr: roughly 400 for the bulge and the pear, about 100 for the flattening and about 100 to release. The maria of this paper were active at different stages of it: most openings of the far side early, until they sealed as the pear grew and less of the Earth’s heat reached them (Moscoviense, fed from Serenitatis, is the exception); the openings of the limbs over a long time; and the near-side maria, through which the Earth’s pressure passed into the Moon, until release.
The hill and the contact. The part of the body that sat on the tip of the pear is recorded on today’s Moon as two nested regions of the near side. The hill is the base of the bulge, the 6,000 km of the body’s underside that rested on the tip when the rounding began. The contact is the last 3,000 km of it, the patch that still touched the Earth at release. Both are given by their centres on today’s Moon; 335.2°E is the same as 24.8°W, so the contact lies north-west of the centre of the near side. The contact disc, the circle of 1,500 km radius about the contact centre, is used throughout the paper as the region that touched the Earth last.
The exposure zones. As the body rounded, each part of its surface kept its share of the whole, as every patch of a slightly squashed ball keeps its share when the ball becomes round; this is the rule of proportional share. It carries the zones of the body on the pear onto the Moon of today as angles measured from the centre of the near side: within 31° lies the ground that was covered until the last stage, between 31° and 70° the ring that peeled from the Earth during the outward rounding, and beyond 70° the upper dome, exposed from the start. Which zone a mare lies in tells how long it stood open to space and how long it stayed covered (Part I).
Leading and trailing. The Moon keeps one face toward the Earth, so one half always faces forward along its orbit (the leading half) and the other faces back (the trailing half). The two halves meet the returning material differently, and this matters for the count of craters (Paper 6).
Comparisons. Every comparison of the ground in this paper is made like for like. The maria have far fewer craters than the land around them, so a comparison that kept them on one side and not on the other would measure the maria rather than the ground; they are therefore removed from both sides, and each comparison says so.
The data. The basalt map of the Lunar Reconnaissance Orbiter Camera (LROC) outlines every dark plain of basalt on the Moon; it is the literature’s map of the maria, and this paper reads it unit by unit. The gravity is from the GRAIL mission. A Bouguer map is the gravity field from which the pull of the visible relief has been removed, assuming a crust of 2,550 kg/m³; what remains shows where the material beneath the surface is denser or lighter than that crust. The field is built of components of increasing detail, called degrees; the lowest, which describe the shape of the whole Moon, are left out, and the highest kept, 660, sets the finest detail that can be seen. Gravity is measured in milligal (mGal), a hundred-thousandth of a metre per second squared. The chemistry is read from orbit: iron and titanium as the oxides FeO and TiO, in per cent by weight (wt%), from the Kaguya Multiband Imager, and thorium, in parts per million (ppm), from the gamma rays counted by Lunar Prospector. The craters are from two global catalogues, one complete from 20 km and one from 1 km, and the elevation from the SLDEM2015 model. The sizes given with each map — 240 m, 60 km, 60 m — are the finest detail it resolves.
Contents
| The computational environment; Abstract; Introduction — the literature and the model; What this paper proposes | |
| PART A | Terms and definitions |
| A.1 | Opening, mare, basin and feed dome |
| A.2 | The source is not the landing place |
| PART B | What the series has fixed |
| B.1 | From Paper 3: the body on the pear |
| B.2 | From Paper 6: the returning material |
| B.3 | The numbers locked |
| PART C | The maria: what a mare is, how many there are, and the mare as the source |
| C.1 | The mare in the literature |
| C.2 | The mare in the model |
| C.3 | The counts, by every definition |
| C.4 | What separates the counts |
| C.5 | Matching the maria to the feed domes |
| C.6 | What the difference in definition explains |
| C.7 | The source test |
| C.8 | The veneer and the crater |
| C.9 | The width and shape of the halo |
| C.10 | The record of craters around the openings |
| PART D | The openings, visible and buried |
| D.1 | The map of the openings |
| D.2 | Basin or crater, by what lies beneath |
| D.3 | Procellarum, a basalt plain |
| D.4 | The buried feed domes |
| D.5 | What lies on them |
| D.6 | The character of an opening by its zone |
| D.7 | Exit openings and mouths |
| PART E | The feed dome |
| E.1 | The feed dome beneath each mare |
| E.2 | The centre sank over the dome |
| E.3 | Why the floor sinks |
| PART F | The floor, the floors and the last scatterer |
| F.1 | One floor |
| F.2 | Margins stretched, interior squeezed |
| F.3 | The margins: layers of craters |
| F.4 | The floors by region |
| F.5 | Craters on the floors |
| F.6 | The order of freezing, and the last scatterer |
| PART G | Size and state: the maria and the craters in time |
| G.1 | Three states on one floor |
| G.2 | The state of the craters by size |
| G.3 | The maria: temperature, viscosity and time |
| G.4 | The arriving material: temperature, size and distance |
| G.5 | The chain in time |
| G.6 | The plains of the contact: heat from below, and the rim |
| G.7 | What this shows |
| PART H | The engine |
| H.1 | Pressure, buoyancy and viscosity |
| H.2 | Volatiles |
| H.3 | Flux, decay and the critical flux |
| H.4 | The heat of the Earth |
| PART I | The geometry of exposure, and the generations |
| I.1 | The moving front of exposure |
| I.2 | From a covered mouth to an exposed exit |
| I.3 | Gradual exposure within one mare |
| I.4 | Three generations |
| I.5 | What the maria did in each stage |
| I.6 | The size of an opening as a memory |
| PART J | Chemistry |
| J.1 | Rings of iron and titanium |
| J.2 | The chronology of iron |
| J.3 | Thorium is held by the contact |
| J.4 | Within the contact: the maria, the plains and the highland |
| J.5 | By longitude |
| J.6 | How the model reads thorium |
| J.7 | The foreign mass of the basins of the maria |
| PART K | Dating |
| K.1 | Five clocks |
| K.2 | The relative order of the maria |
| PART L | Statistics |
| L.1 | Data and masks |
| L.2 | Reproduction |
| L.3 | The measured results, in one table |
| PART M | Predictions and tests |
| M.1 | What the measurements changed |
| M.2 | The studies in one table |
| M.3 | Predictions and tests |
| PART N | Discussion |
| N.1 | The unified picture |
| N.2 | Explanations of the literature |
| N.3 | What exists and what is new |
| PART O | Conclusions |
| O.1 | What the paper has shown |
| Further work — openings for research; Code availability; References; Appendix A — the catalogue of openings |
What a mare is. In the LEF model the Moon was built on the Earth and fed from within through openings in its shell. This paper proposes that the maria are those openings. Each stands over a feed dome: a body pushed up from a subsurface focus, which raised the ground above it. Through most openings the material rose, was thrown out, and came back as the returning material that made the craters; Imbrium and Serenitatis, the maria of the contact, passed material and the Earth’s pressure into the Moon and did not eject (Serenitatis only slight popping). The dark basalt plain is only what remains on the surface of such an opening, its last frozen layer.
Counted as openings, the maria are not where the basalt is. A feed dome is dense and pulls harder than the ground around it, so in the GRAIL gravity field, with the pull of the relief removed (the Bouguer field), it shows as a round high. Of 73 such highs of 100 km and more, 25 lie under an open mare and 44 under bright highland, 36 of them on the far side. Over these buried domes iron and thorium equal those of the land around and the crust is thicker by 8–13 km: later layers covered them. And 33 of the 34 maria identified on the gravity gradients sit on a dome.
The floor. Every floor holds one level, as a frozen lake does, below its rim by a median of 3.4 km. The maria of the contact, the region that touched the Earth until release, lie at the level of the plains beside them; the far maria lie deep below the ground around them, inside a raised collar built of their own returning material. On the open maria the centre stands lower than the margin in 10 of 12, the more so the stronger the dome beneath ().
The source. The ground around six maria carries their iron, falling from 6.9 to 3.1 wt% FeO within 150 km and holding above the far highlands out to 600 km, and the craters in it are poorer than their ground; beside the plains, which spilled their melt over their edges, the excess falls to the far highlands. The floors of the open maria carry a twelfth of the craters of 2–5 km of the land around them, the cleanest being the maria of the contact. The contact disc, 17.5% of the surface, holds 95% of the thorium above 3 ppm, and its centre, fixed in advance, is third of 16,200 possible centres; within it the maria are the poorest ground, having let their thorium sink back with the last of the melt. Read as basins of external impacting bodies, the basins of the maria would leave a foreign mass their melts do not carry.
The Parts. A defines the terms and B recalls what the series has fixed; C counts the maria by each definition and reads the ground around them as their thrown material; D maps the openings, visible and buried; E measures the feed dome and F the floor; G follows the maria and the craters in time; H gives the engine and I the order of exposure; J and K read the chemistry and the clocks; L gathers the measured results and M the predictions and their tests; N and O discuss and conclude.
What the abstract means, in plain words. The literature and this paper look at the same dark plains and name different things. For the literature the mare is the dark plain. For this paper the mare is the structure beneath it: a hole through the Moon’s shell over a dense body, through which material came up from depth and, at most openings, was thrown out, and the dark plain is the last skin that froze over that hole when the flow stopped. A lava lake in a volcanic crater is a fair picture: what one sees is a frozen crust, but the crust is not the volcano; beneath it is the liquid region through which the pressure that fed it passed. Once the mare is read this way, a mare need not carry basalt at all, and a patch of basalt need not be a mare.
What the gravity shows. A body denser than its surroundings pulls a passing spacecraft a little harder, and GRAIL mapped that extra pull over the whole Moon. A feed dome, frozen into a dense, iron-rich body, appears as a round high. Of the 73 highs counted, 25 lie under a dark plain, 4 are partly covered, and 44 lie under ordinary bright ground — the far side holds most of these. They are the openings of the far side, buried by the layers that later built its thick crust. The surface over them carries the same iron and thorium as the land around, because it is the land around: the cover laid over everything. The crust over them is 8–13 km thicker than over an open dome of the same strength, which is the thickness of that cover. The gravity gradients — how fast the pull changes from place to place — are sharpest at the edges of dense bodies; on them the author identified 34 maria, and 33 of them sit on one of the 73 domes. The one exception, Ingenii, lies over South Pole–Aitken, where the heat beneath that basin cooked its dome away (§C.5).
What the floor shows. A floor that is one level throughout froze as a lake freezes: one liquid surface that froze slowly, from the outside inward, not a pile of separate flows. It lies a few kilometres below its rim, and its centre sank over the dense body beneath it: of 12 open maria, 10 have a centre lower than the margin. The rank correlation runs from to and measures how consistently two quantities rise or fall together; says that a stronger dome goes, fairly consistently, with a lower centre. Of the maria of the contact, Serenitatis froze first, very close to the Earth, and Imbrium after detachment, as the Moon receded; both lie level with the plains beside them; the maria farther out lie deep inside a collar built of what they themselves threw.
What the chemistry shows. If the maria threw the material that made the craters, the land around each mare must carry its iron, the most close by and less farther out — and it does, from 6.9 wt% of iron oxide near the edge to 3.1 at 150 km, still above the far highlands at 600 km. A crater made later in that ground threw the iron-rich veneer aside and opened the poorer base, so it is poorer than its own ground. The dark plains without a feed dome behave differently: their melt spilled over their edges and did not reach far. Thorium, a radioactive element the literature attributes to the last residue of a magma ocean, is gathered almost wholly in the contact disc: a sixth of the surface holds 95% of it. The contact centre was fixed in Paper 3 before the thorium was read; when a disc of the same size is centred in turn on 16,200 points over the whole Moon, the fixed centre catches more thorium than all but two of them (§J.3).
What the craters on the floors show. An open mare holds or melts what lands on it and keeps no record while it is active; its floor collects craters only after it froze. The floors carry a twelfth of the small craters of the land around them, and the maria of the contact, which froze late, carry the fewest. Finally, if the basins of the maria had been dug by bodies from outside, those bodies would have left their mass in the crust; the melts of the basins do not carry it (§J.7).
Introduction — the literature and the model
The literature reads a mare as two events. First an external impacting body digs a basin; hundreds of millions of years later basalt rises from the mantle and floods it. The dark plains are the basalt, the basins are the holes, and the two are counted apart: a basin without basalt is not a mare, and a patch of basalt on the floor of a crater is. The heat that made the basalt is placed in the Procellarum region, where the radioactive KREEP material is concentrated. KREEP is named for its potassium (K), rare-earth elements (REE) and phosphorus (P); it is rich in thorium and uranium, whose decay releases heat, and the literature reads it as the last liquid left when a global ocean of magma crystallised.
The table sets the two readings side by side, question by question. Each row is a place where the same observation is given a different meaning; the rest of the paper takes the rows in turn and measures which meaning the data carry. The mascon of the third row, a “mass concentration”, is the excess of gravity found under the large near-side maria.
| Question | The literature | The model |
|---|---|---|
| What is a mare | A dark plain of basalt filling a basin | An opening over a feed dome; the basalt is its last surface |
| The basin | Dug by an external impacting body | The rim of the opening, raised by spray |
| The mascon | Mantle uplift and the load of the basalt | The feed dome, frozen into a dense, iron-rich body |
| The heat | KREEP under Procellarum | The Earth, faced by the near side while attached |
| The far side | Few maria | More feed domes than the near side, 40 against 33, buried by its layers |
| The smooth floors | Young basalt, few impacts since | Hot and of low viscosity at release; froze slowly afterwards, after most of the returning material had landed |
| The thorium | The residue of the magma ocean | The mark of the contact, the last region to let go |
| The ages | The time of eruption | The time of cooling |
The LEF model reads the same plains as one structure. The Moon was built on the Earth, fed from within through openings, and its maria are those openings. Each stands over a feed dome — the body through which the material rose — and the basalt is the last of what passed through it. The question of this paper is therefore not why there is basalt in the basins, but what a mare is, how many there are, and what each records of the feed system that built the Moon.
This changes what counts as evidence. If the maria are openings, a mare is recognised by the dense body beneath it, not by the colour of its surface; the land around it must carry the material it threw; its floor must have frozen as one surface after the craters around it were made; and its age is the time it cooled, not the time a separate flood arrived. Each of these is a measurement on public maps, and each is made in this paper.
The paper first defines its terms (Part A) and recalls what the series has fixed (Part B), so that the words opening, mare, basin and feed dome have one meaning throughout. It then answers its central question, what a mare is and how many there are by each definition, and reads the mare as the source of the returning material (Part C). It follows the openings, visible and buried (Part D), the feed dome beneath each mare (Part E) and the floor that froze over it (Part F). Part G sets the maria and the craters side by side in time, by their size and their state when they froze. Part H describes the engine that drove the feed — pressure, buoyancy, viscosity, volatiles and the heat of the Earth — and Part I the geometry of exposure: the order in which the openings came out from under the contact. The paper then reads the chemistry (Part J) and the clocks (Part K). The measured results are gathered in Part L, the predictions and their tests in Part M; Parts N and O discuss and conclude.
A mare is an opening over a feed dome. Material pushed upward from a subsurface focus raised a centre and widened its margins, and so built a dome beneath the opening; through it the material rose into the mare; at most openings it was thrown out, and part of it came back to the surface as returning material (Imbrium and Serenitatis, the maria of the contact, did not eject; Serenitatis only slight popping). What the literature counts as a mare — a dark plain of basalt — is what is left on the surface of such an opening. Counted as openings, the maria are not where the basalt is: 44 of the 73 feed domes seen in gravity lie under bright highland, 36 of them on the far side, buried by its layers together with the craters they made (Part D).
The floor froze like a lake, and sank over its dome. Every floor holds one level, about 3 km below its rim; the maria of the contact lie at the level of their plains, the far maria deep inside a collar of their own returning material; the centre of a mare stands lower than its margin, the more so the stronger the dome; the candidate causes are the weight of the dense, iron-rich body beneath it, suction, and mainly thermal expansion and contraction with heat and cold, stronger the larger the mass — still to be tested (Parts E, F).
The maria are the source of the returning material. The ground around every mare carries its iron and titanium, falling off with distance, and the large craters near it are poorer than that ground, having thrown aside the veneer the mare laid down (Part C). Thorium is concentrated where the Moon last touched the Earth: the contact disc, 17.5% of the surface, holds 95% of the thorium above 3 ppm (Part J).
The maria sealed in order. Most of the old openings of the far side sealed early, as the pear grew and less of the Earth’s heat reached them (Moscoviense, fed from Serenitatis, is the exception); the openings of the limbs threw over a long time. The near-side maria were open passages through which the Earth’s pressure passed into the Moon; at release it stopped reaching the Moon, and the ejections stopped. The near-side maria were then hot and of low viscosity and froze slowly, from the outside inward, which is why their floors are smooth — Mare Imbrium holds 11 craters of 20 km and more per million km² against 205 on the highlands. After release the small craters were made by drops thrown by the Earth, the last scatterer (Part I, §§F.5–F.6).
The requirements of the model, and what would test it, are collected in Paper 11 (The Requirements).
How the box reads. The first paragraph is the definition on which the whole paper rests, and it has three parts. The feed dome is the body beneath: material pushed up from a focus below the surface lifted the ground over it in the middle and spread it at the sides, as a dome. The opening is where that flow broke through the shell: material rose through it and, at most openings, was thrown out, and part of it came back down as the returning material that made the craters (Paper 6); Imbrium and Serenitatis, the maria of the contact, did not eject (Serenitatis only slight popping). The basalt is what was left: the last melt in the opening, frozen into the dark plain we see. Read in this way, a mare is recognised by the dome beneath it, and most domes turn out to carry no basalt at all.
The second paragraph says what the floor records. A lake freezes to one flat surface; a floor that is one level everywhere froze in the same way. When the flow stopped, the dome beneath froze into a dense, iron-rich body, and the centre of the floor stands lower over it — the stronger the dome, the deeper the sag. Three causes may lower it: the weight of that body, suction, and mainly thermal expansion and contraction with heat and cold, which is stronger the larger the mass in diameter and depth; the measurements do not yet choose between them. The third paragraph says where the thrown material went: into the ground around each mare, as a veneer rich in iron and titanium, thickest at the edge. The thorium marks something else, the place where the Moon last touched the Earth.
The fourth paragraph gives the order in which the maria stopped. Most openings of the far side sealed first, as the pear grew and less of the Earth’s heat reached them; Moscoviense, fed from Serenitatis by a straight internal passage, is the exception. The openings of the limbs threw over a long time. The near-side maria were open passages through which the Earth’s pressure passed, through the pear, into the Moon while the body was attached; at release the pressure stopped reaching the Moon, and the ejections stopped. The near-side maria were then hot and of low viscosity, and they froze slowly, from the outside inward, after almost all the returning material had already landed. That is why their floors are so clean: Imbrium carries 11 large craters per million km² where the highlands carry 205. After release only drops thrown by the Earth still reached the Moon, and they scattered the small craters (§F.6).
Terms and definitions
the same word, mare, names a surface, a hole and a history. The approach: the structure and its surface are named apart, and the source of the returning material is kept apart from where it landed.
This Part fixes the words before the paper uses them. The reason is practical: in the literature the word mare (Latin for “sea”, plural maria) is used at once for a dark surface, for the hole beneath it and for the story of how the hole was filled, and an argument that moves between the three without saying so cannot be checked. Here each thing gets its own name. Part A first names the instruments, the measurements and the materials the paper relies on; §A.1 then defines the four structures of the model — the feed dome, the opening, the mare and the basin — and sets each beside its meaning in the literature; §A.2 separates the place a crater’s material came from and the place it landed, a distinction on which every crater count in the paper depends.
The words of measurement. The maria are read through a small number of instruments and a small number of materials. Each is named once here, in plain terms, so that the later Parts can use it without stopping. The table can be read now or consulted when the term first appears.
| Term | What it is | How this paper uses it |
|---|---|---|
| The ground and its materials | ||
| Highland | The bright, light-coloured ground that covers most of the Moon, poor in iron | The “ground” against which maria and plains are compared; far from any basalt it holds about 2.30 wt% FeO (§C.7) |
| Albedo | The share of the sunlight a surface reflects; a dark surface has a low albedo | How the literature recognises a mare by eye (§C.1) |
| Basalt | A dark lava, rich in iron and often in titanium, that froze from a runny melt — runny as a light oil, about 1 Pa s (§G.3) | The last surface of an opening (§A.1) |
| FeO, TiO, wt% | Iron oxide and titanium dioxide, given in percent of the weight of the surface material; the Kaguya Multiband Imager reads them from the colour of the reflected sunlight, in pixels of about 240 m [S3] | The fingerprint of mare material on the ground around a mare (§§C.7–C.9) |
| Thorium, ppm | A radioactive element that stays in the liquid as a melt cools, and so gathers in the last liquid; Lunar Prospector mapped it from the gamma rays of its decay, in cells of about 60 km [S4]; ppm is parts per million, grams per tonne | The mark of the contact, the last region to let go of the Earth (Part J) |
| KREEP | Material rich in potassium (K), the rare-earth elements (REE) and phosphorus (P), with thorium, all elements that stay in the last liquid | The literature places it under Procellarum as the heat source of the basalt; the model does not (Introduction, Part J) |
| Ejecta | The material a forming crater throws out and lays around itself | Distinguished from the returning material that made the crater (§A.2) |
| Gravity | ||
| GRAIL | Two spacecraft that flew one behind the other around the Moon; as each passed over a denser region it was pulled ahead or held back a little, and the change in the distance between them measured the gravity beneath | The source of the gravity field, model GRGM1200L [S2] |
| Degrees 6–660 | The field is written as a sum of waves around the Moon; a wave of degree fits times around it. Leaving out degrees below 6 removes the broadest, Moon-wide variations; stopping at 660 sets the finest detail kept | Fixes which sizes of dense body the map can show |
| Bouguer anomaly | The gravity measured, minus the pull of the visible relief (hills, crater walls), computed for a crust of 2,550 kg/m³. What remains comes from density differences below the surface — as one weighs a parcel and subtracts the known weight of the box to learn about its contents | The map in which the feed domes are found |
| mGal | The unit of a gravity anomaly: one thousandth of a gal, and a gal is 1 cm/s² | A feed dome must stand 50 mGal and more above the ring around it (§C.3) |
| Gravity gradient | How fast the Bouguer gravity changes from one place to the next. It is strongest at the edge of a dense body, so a map of gradients draws the outlines of such bodies, as contour lines crowd together at the edge of a cliff | The map on which the author identified the 34 maria (§C.2) |
| Mascon | “Mass concentration”: a region of excess mass beneath a basin, seen as a gravity high | In the model, the feed dome (§A.1) |
| Maps and catalogues | ||
| LROC mare map | The outlines of the dark basalt drawn on the images of the Lunar Reconnaissance Orbiter Camera: 644 polygons grouped in 646 units under 97 names [S1] | The basalt count (§C.3); used as a mask, it removes the basalt pixels from a measurement, so that the ground beside a mare is read without the mare |
| QuickMap | The online map viewer of the LROC data, in which gravity and images can be laid one over the other | Where the author marked the openings by eye (§C.2) |
| Crater catalogues | Robbins (2019), every crater of 20 km and more [S5]; Wang & Wu (2021), every crater of 1 km and more [S6] | The craters counted and read throughout |
| Places on the Moon | ||
| Near and far side | The Moon turns once on its axis in each orbit and so keeps one face toward the Earth: the near side | The two hemispheres compared throughout |
| Leading and trailing halves | The half that faces the direction of the Moon’s motion along its orbit, centred on 90°W, and the half behind it, centred on 90°E | Where the returning material landed (§B.2) |
| Sub-Earth point | The point of the Moon that faces the Earth directly | Distances in Appendix A are measured from it |
A.1Opening, mare, basin and feed dome
Four structures carry the model, and they are best pictured from the bottom up: a dense body beneath (the feed dome), the place where its material reached the surface (the opening), the surface that opening left behind (the mare), and the margin around it (the basin).
The feed dome. A feed dome forms where material is pushed upward from a subsurface focus. The push raises the centre and widens the margins, and so builds a dome beneath the mare. From it the material rises into the mare; at most openings it was thrown out, and part of it returned to the surface of the Moon as returning material (Imbrium and Serenitatis, the maria of the contact, did not eject; Serenitatis only slight popping). The dome is not an intrusion and not a plug: it forms from the flow that passes through it and out. The difference matters. An intrusion is a body of melt that enters the crust and stops there; a plug is what blocks a channel. A feed dome is neither a body that came to rest nor an obstacle; it is the shape the flow itself builds as it passes upward, as the water of a strong spring raises a mound over its outlet while it runs through it. Once the flow stopped, the dome froze into a dense, iron-rich body, and that body is what the gravity field sees today (Part E).
The opening. The opening is the place where the feed reached the surface. An exit opening threw material outward; a mouth passed material while still covered, toward the exit openings, and was exposed only as the contact retreated. The same structure can begin as a mouth and end as an exit (§I.2). An opening is not a pipe with walls: it is a region of liquid within the parent material, bounded by a contrast of viscosity, through which pressure passes. Viscosity is a material’s resistance to flow — honey has more than water, and a cold, stiff shell vastly more than either. The opening is therefore defined by how easily its material flows compared with the material around it, not by a wall; the pressure from below passes through the runny region as through a gap, and the stiff material around it does not let it pass.
The table sets each familiar word beside the meaning the literature gives it and the meaning it has in this paper. Read it row by row: the left column is the word, the middle what a reader trained in lunar geology will understand by it, the right column what it means in the pages that follow.
| Term | In the literature | In this paper |
|---|---|---|
| Basin | A large crater of an external impacting body | The margin of an opening, built by layers of its own returning material (§F.3) |
| Mare | The basalt filling a basin, or any dark basalt plain | An opening over a feed dome; the basalt is its last surface |
| Mascon | A mass excess under a basin: mantle uplift and basalt load | The feed dome, frozen into a dense, iron-rich body (Part E) |
| Cryptomare | Basalt hidden under later ejecta | A buried opening: a feed dome under the layers (Part D) |
| Floor | The top of the basalt | The frozen surface of the opening, about 3 km below its rim (median 3.4 km, §F.1) |
Two rows carry most of the weight. In the second, the mare stops being a surface and becomes a structure: the dark basalt is only the last thing the opening left on top. In the fourth, a cryptomare — in the literature a mare hidden under bright material — becomes simply an opening whose surface was later covered; it is counted like any other. The remaining rows follow: the basin is the raised edge the opening built of its own material, the mascon is the frozen feed dome, and the floor is the frozen top of the opening.
A.2The source is not the landing place
An exit opening throws material that lands 50 to 1,000 km away, and while it is active its own floor is remelted and covers its record. Two consequences follow, and the equation below states them. A surface near an active opening gains craters made by what the opening throws; the opening’s own floor loses the craters that land on it, because it is still liquid or is melted again. The number of craters seen on a surface is therefore where is the number of craters observed on the surface today, the background — the craters made there by material from all other sources — the craters made by material thrown from the nearby opening, and the craters later removed by melting or covering. The equation is a bookkeeping rule, not a model to be fitted: it says only that a crater count is the result of three processes at once and cannot be read as a simple clock.
A mask that removes the maria does not restore what they erased: leaving the floor of a mare out of a count removes its area from the comparison, but the craters it melted while it was active are gone, and nothing in the remaining ground shows where they were. A crater cannot be assigned to the mare that threw it — the returning material carries no label of its source, and an opening throws to every distance between 50 and 1,000 km. The test is statistical, by distance and by side: if the maria are the sources, the ground and the craters around them must, on average, carry their material more strongly near them than far away (§C.7), and must differ between the leading and the trailing halves (Paper 6).
What we now have: separate names for the dense body beneath (the feed dome), the place where it reached the surface (the opening), the surface left behind (the mare’s basalt) and the margin around it (the basin); and a rule that a crater count records arrival, return and erasure together.
What the series has fixed
the maria are read through the construction of Paper 3 and the returning material of Paper 6, and neither is derived again. The approach: what is taken from them is stated in one place, with the numbers locked.
This paper builds on two earlier papers of the series and does not repeat their arguments. From Paper 3, LEF Mechanism in Practice, it takes the geometry of the body while it was being built on the Earth, and from that geometry the zones into which today’s Moon is divided. From Paper 6, The Craters, it takes the origin of the craters: material thrown out and returning. This Part states what is taken, where in the earlier paper it is derived, and the numbers that are held fixed here; a reader who wishes to check one of them is sent to its source.
B.1From Paper 3: the body on the pear
In the model the Earth, spinning fast, raised a bulge that was drawn out into a pear shape, and the body that became the Moon was built on its end (Paper 3). The body sat on the curved tip of the Earth’s pear, a flattened ball with a lower dome on the tip and an upper dome above it — a squashed ball resting on a rounded support, its underside hugging the support and its top standing high over it. The tip was 6,000 km across when the rounding began and 3,000 km at release: as the body became rounder, the area by which it touched the Earth narrowed to half its width (Paper 3, §B.4).
The construction ran in three stages: the outward rounding, as the body seated on the tip became a ball; the flattening, in which most craters formed and the largest, the differentiation having advanced and the ejected material being light and rich in water; and the inward rounding, as the flattening relaxed and the body densified. Differentiation is the separation of a melt into heavier and lighter parts; by the flattening it had gone far enough that what was thrown out was light and rich in water. Each of the three stages is derived in Paper 3; here they set the order in which the openings were exposed.
Three zones are carried onto the Moon of today: the hill, the base of the bulge, 6,000 km across and holding 99% of the near-side maria; the contact, the last 3,000 km, holding 66% of them; and Mare Imbrium within the contact, the opening that stayed connected to the Earth until detachment; through it and through Serenitatis, which peeled away first, heat and material entered the body from the Earth. The two shares are shares of area: of the area of the dark basalt of the near side on the LROC map, not of the number of maria (by number, 13 of the 14 near-side maria of Appendix A lie in the hill and 4 in the contact). The 66% is that of the contact as outlined on the map in Paper 3; on the circles of Appendix A, 3,000 km and 1,500 km in radius, the shares come to 99.8% and 72%. The hill is the region that sat over the wide tip when the rounding began, the contact the region still attached at release; on today’s Moon they are two nested discs on the near side, and their centres are given in §B.3. The source of each is Paper 3, §B.4.
How the contact let go. The corotation line is the distance at which a body turning with the Earth already moves at the speed of a free orbit. The contact peeled from the tip of the pear as the body’s centre of mass reached that line, and the Moon was detached a little beyond it. Detachment exactly on the line would leave the Moon on a circular orbit, which the tide cannot make eccentric; the eccentric orbit of the Moon therefore requires detachment slightly after the centre of mass crossed. The series adopts a release about 210 km beyond the line, when a little more than half the Moon, about 58%, had crossed it, because two independent tests both point to it: the present inclination (release at 22.5°) and the present eccentricity (for a hot young Moon). The full tables are in Paper 3.
The openings are of three kinds by when they were exposed: those of the flat shell at the first stage; those on the upper dome, exposed as it rose, which threw material outward; and those under the lower dome, covered until release, through which material only passed. These are the exit openings and the mouths of §A.1, now placed in time; their zones on today’s Moon are given for each mare in Appendix A.
The near side was opened by heat: the region that touched the tip of the Earth’s pear, the 3,000 km of the contact, melted away its sial — the light upper layer of crust, rich in silicon and aluminium — and the thin crust beneath the near-side maria is thin because they are openings (Paper 3, §B.7). The order of cause is the point: the crust there is not thin first and then broken through; it is thin because the openings and the heat beneath them removed its upper layer.
B.2From Paper 6: the returning material
Material thrown from the openings returned to the shell at the speed it left, and made the craters: some 99% of them are of returned terrestrial material (Paper 6, The Craters). A stone thrown upward falls back at the speed with which it was thrown; in the same way the material thrown from the openings landed back on the shell fast enough to make craters. The body’s own ejecta landed toward its trailing half, 90°E, and met its leading half, 90°W, head-on — the leading half moved into the material as a runner moves into rain, and was struck harder. The maria are the source of that material, and the foreign mass an external impacting body would leave is not found in the crust (Paper 6, §C.1, §L.5, Parts F–I). This is the link between the two papers: Paper 6 measures the craters, and this paper names the openings that threw the material that made them.
B.3 The numbers locked
The table lists the numbers taken from the two papers. They are held fixed throughout: no result of this paper is obtained by adjusting them. The right column gives, for each, the paper it comes from and what it measures there.
| Quantity | Value | Source |
|---|---|---|
| Tip of the pear, start of rounding / release | 6,000 / 3,000 km | Paper 3: the width of the contact narrows from 6,000 to 3,000 km as the body rounds outward (§B.4) |
| Base of the pear | 9,000–11,000 km | Paper 3: the width of the pear where it rose from the Earth |
| Hill centre / contact centre | 16.6°N 13.1°E / 24.1°N 335.2°E | Paper 3, §B.4: the two discs mapped onto today’s near side; 335.2°E is 24.8°W |
| Near-side cap / belt | 31° / 31°–70° | Paper 3, §B.4: the rule of proportional share — a part keeps its share of the surface as the body rounds, and shares of 7% and 33% become caps of 31° and 70° |
| Density of the body on the tip | 1,300 kg/m³ | Paper 3, §B.2: the foamed, light state of the full lunar mass seated on the tip, against 3,344 today |
| Share of returned terrestrial craters | about 99% | Paper 6: the craters made by returning material, not by external bodies |
The first three rows fix where things are; the fourth fixes the zones of exposure (a near-side cap within 31° of the sub-Earth point, and a belt from 31° to 70°; the rule fixes their size about the sub-Earth point, while on today’s Moon they lie about the contact centre, by which Appendix A places each mare — Paper 3, §B.4); the fifth fixes how light the body was while it was built; the sixth fixes where the craters came from. With these numbers fixed, the rest of the paper turns to the maria themselves.
The maria: what a mare is, how many there are, and the mare as the source
the number of maria depends on what a mare is, and a mare that is an opening must have thrown what made the craters around it. The approach: the two definitions are set side by side, every count is given under its own definition and matched one by one, and the ground around the maria is read for their material.
This is the central Part of the paper, and it answers three questions in turn. What is a mare — a dark plain, or an opening over a feed dome (§§C.1–C.2)? How many maria are there under each definition, and why do the counts differ (§§C.3–C.6, Study 1)? And if a mare is an opening, did it throw the material around it (§§C.7–C.10, Study 2)? The first two questions are answered from the gravity field and the basalt map; the third from the chemistry of the ground.
C.1The mare in the literature
In the literature a mare is a surface: a dark plain of basalt, recognised by its low albedo and mapped by its outline. The basin is a separate thing, the structure made by an external impacting body, and the mare is its filling. A basin without basalt is therefore not a mare, and a patch of basalt on the floor of a crater is. Basalt hidden under later bright material is a cryptomare, a mare that cannot be seen. The International Astronomical Union names the dark plains by kind: Oceanus, Mare, Lacus, Sinus, Palus — ocean, sea, lake, bay and marsh, names given when the dark plains were thought to be water. Under this definition a mare is counted by looking: whatever is dark and flat and made of basalt is a mare, whatever its size and whatever lies beneath it.
C.2The mare in the model
In the model a mare is an opening over a feed dome, and the basalt is only what remains on its surface. Under this definition a mare is counted by what lies beneath it, not by what lies on top. Two rules follow. Every opening with a feed dome beneath it is counted, also when it is buried and carries no basalt. A patch of basalt that a later crater exposed on its floor, with no dome beneath it, is not counted: it is a crater that landed on a lava area and exposed a lava floor. The first rule adds maria the literature does not see; the second removes some it does.
The maria surveyed in this paper. The maria were identified by the author on the gradients of the GRAIL Bouguer gravity field, which show the edges of dense bodies beneath the surface: 34 openings, listed in Appendix A with their positions, zones and the feed dome beneath each. The identification was made by eye: the author marked, on the gradient map in QuickMap, the round outlines that enclose a dense body, whether or not basalt lies on top. These are the maria of this paper, and every study in it is carried out on them.
34 maria and 36 marked openings. Two counts recur in this paper and must be kept apart. The author first marked 36 openings by eye on QuickMap, numbered 1 to 36; these 36 marks are the sample of the crust test (§D.2) and of Study 3. Six of the marks (numbers 2, 8, 14, 15, 22 and 31) did not hold as maria, and four openings were added later (numbers 37–40); the catalogue of Appendix A therefore holds 34 maria, among them Copernicus H (35) and Sinus Aestuum (36). Where the text speaks of the maria, it means these 34; where it speaks of the marked openings, it means the 36 original marks.
Each mare is given the area of the core of the feed dome beneath it. Three of them — Ingenii, Apollo and Bailly — lie over South Pole–Aitken, the largest and oldest basin of the far side; the feed domes beneath them were cooked away by the heat under that basin, and each is given a radius of 150 km. The dark plains of basalt that carry no feed dome — Oceanus Procellarum, Mare Insularum, Mare Nubium, Mare Cognitum, Mare Frigoris, Mare Vaporum, Mare Tranquillitatis and others — are not maria: they are the ordinary crust of the section of the pear, melted in place by the general heat of the Earth while the body was attached, with no channel to depth. They are dark for the same reason a mare floor is dark — melt froze on them — but the melt came from heat applied from outside, not from a feed rising from below, and so no dense body lies beneath them. In this paper they are called plains. Mare Fecunditatis, Mare Australe and Lacus Mortis, though they lie over gravity highs, are not among the maria of this paper.
C.3The counts, by every definition
The table gives every count of the maria in use, each under the definition that produces it. The grey rows count basalt surfaces, as the literature does; the blue rows count openings over feed domes, as the model does. The darker blue marks the count on which the argument rests: the feed domes, most of them buried.
| Definition | Count | What is counted |
|---|---|---|
| The literature: basalt surfaces | ||
| Mapped basalt units, LROC [S1] | 646 | polygons of dark basalt, under 97 names |
| Units of 1,000 km² and more | 189 | 122 on the near side, 67 on the far side |
| Names by kind | 26 / 18 / 1 | Mare or Oceanus / Lacus / Palus; the rest are crater floors named after their craters |
| Named maria without the six largest | 33 | the test set of Part E |
| Basins of 500 km and more, Neumann et al. [S10] | 20 | the large basins of the gravity field |
| The model: openings over feed domes | ||
| Maria identified by the author on the GRAIL gradients | 34 | 14 on the near side, 20 on the far side (Appendix A) |
| Feed domes in gravity, 100 km and more, 50 mGal and more | 73 | 25 under an open mare, 4 partial, 44 buried |
| Clear feed domes in the floor test (§E.1) | 22 | 37 with the weaker ones |
The literature’s counts range from 646 to 20 according to what is taken as one mare: every polygon, every large polygon, every name, or every large basin. The model’s counts are of a different kind. The 34 maria are the openings the author identified; the 73 feed domes are every dense body in the gravity field large and strong enough to be one; and of these 73 only 25 carry an open mare on top. The basalt count, read alone, would miss the 44 buried domes entirely.
How the feed domes were found. A feed dome is dense and pulls harder than the ground around it. Every round patch of stronger gravity of 100 km and more, with a central excess of 50 mGal and more over the ring around it, was taken from the GRAIL field. The search was automatic: no dome was chosen by eye, and the same two thresholds were applied everywhere. For each, the surface above it was read on the LROC map: under a mare, 25% or more of its area is basalt; buried, less than 5%, only bright highland; partial, in between. The two catalogues — the 34 maria marked by eye and the 73 domes found by threshold — were therefore made independently of each other, and §C.5 compares them.
C.4What separates the counts
The counts do not differ by chance; each difference has a cause. The table names four, and each is a place where the two definitions give different answers for the same ground.
| Difference | Cause |
|---|---|
| One dark plain, several openings | Oceanus Procellarum is one plain of 1.8 million km² and holds several feed domes; the literature counts one mare |
| One opening, several units | An opening’s basalt is cut by highland and later craters into many polygons; 646 units become a few dozen openings |
| Openings without basalt | 44 feed domes carry no basalt: 36 on the far side, 8 at the margins and poles of the near side; the literature counts none of them |
| Basalt without an opening | Floors of craters that landed on a lava area carry basalt and no dome; the literature counts them, the model does not |
The first two rows change the count by grouping: one large plain may hide several openings, and one opening may appear on the map as many pieces. The last two rows change it by kind: an opening that lost its basalt cover is still an opening, and a crater floor that happens to carry basalt is still a crater. The highlighted row is the largest single difference and the one that matters most: 44 openings that the basalt count cannot see at all.
On the far side the literature counts few maria and the model many openings; on the near side the two counts are close. The dichotomy of the Moon is therefore not a dichotomy of openings but of what covers them. The dichotomy is the well-known contrast between the two hemispheres: a dark near side, rich in maria, and a bright far side almost without them.
C.5 Matching the maria to the feed domes
If a mare is an opening over a feed dome, the maria marked on the gradients and the domes found by threshold should be the same places. This section tests that. The 34 maria identified on the gravity gradients were matched to the 73 feed domes of the gravity field, a mare and a dome being one when the mare lies within the dome’s core radius or within 150 km of its centre, whichever is larger. 33 of the 34 maria sit on a feed dome: all 14 of the near side and 19 of the 20 of the far side. The one that does not is Ingenii, over South Pole–Aitken, whose feed dome was cooked away by the heat under that basin; Apollo and Bailly, over the same basin, lie within the core of a large neighbouring dome. Thirty-three of the 73 domes carry a mare: 12 under basalt, 2 partly covered and 19 under bright highland. The full table is in Appendix A.
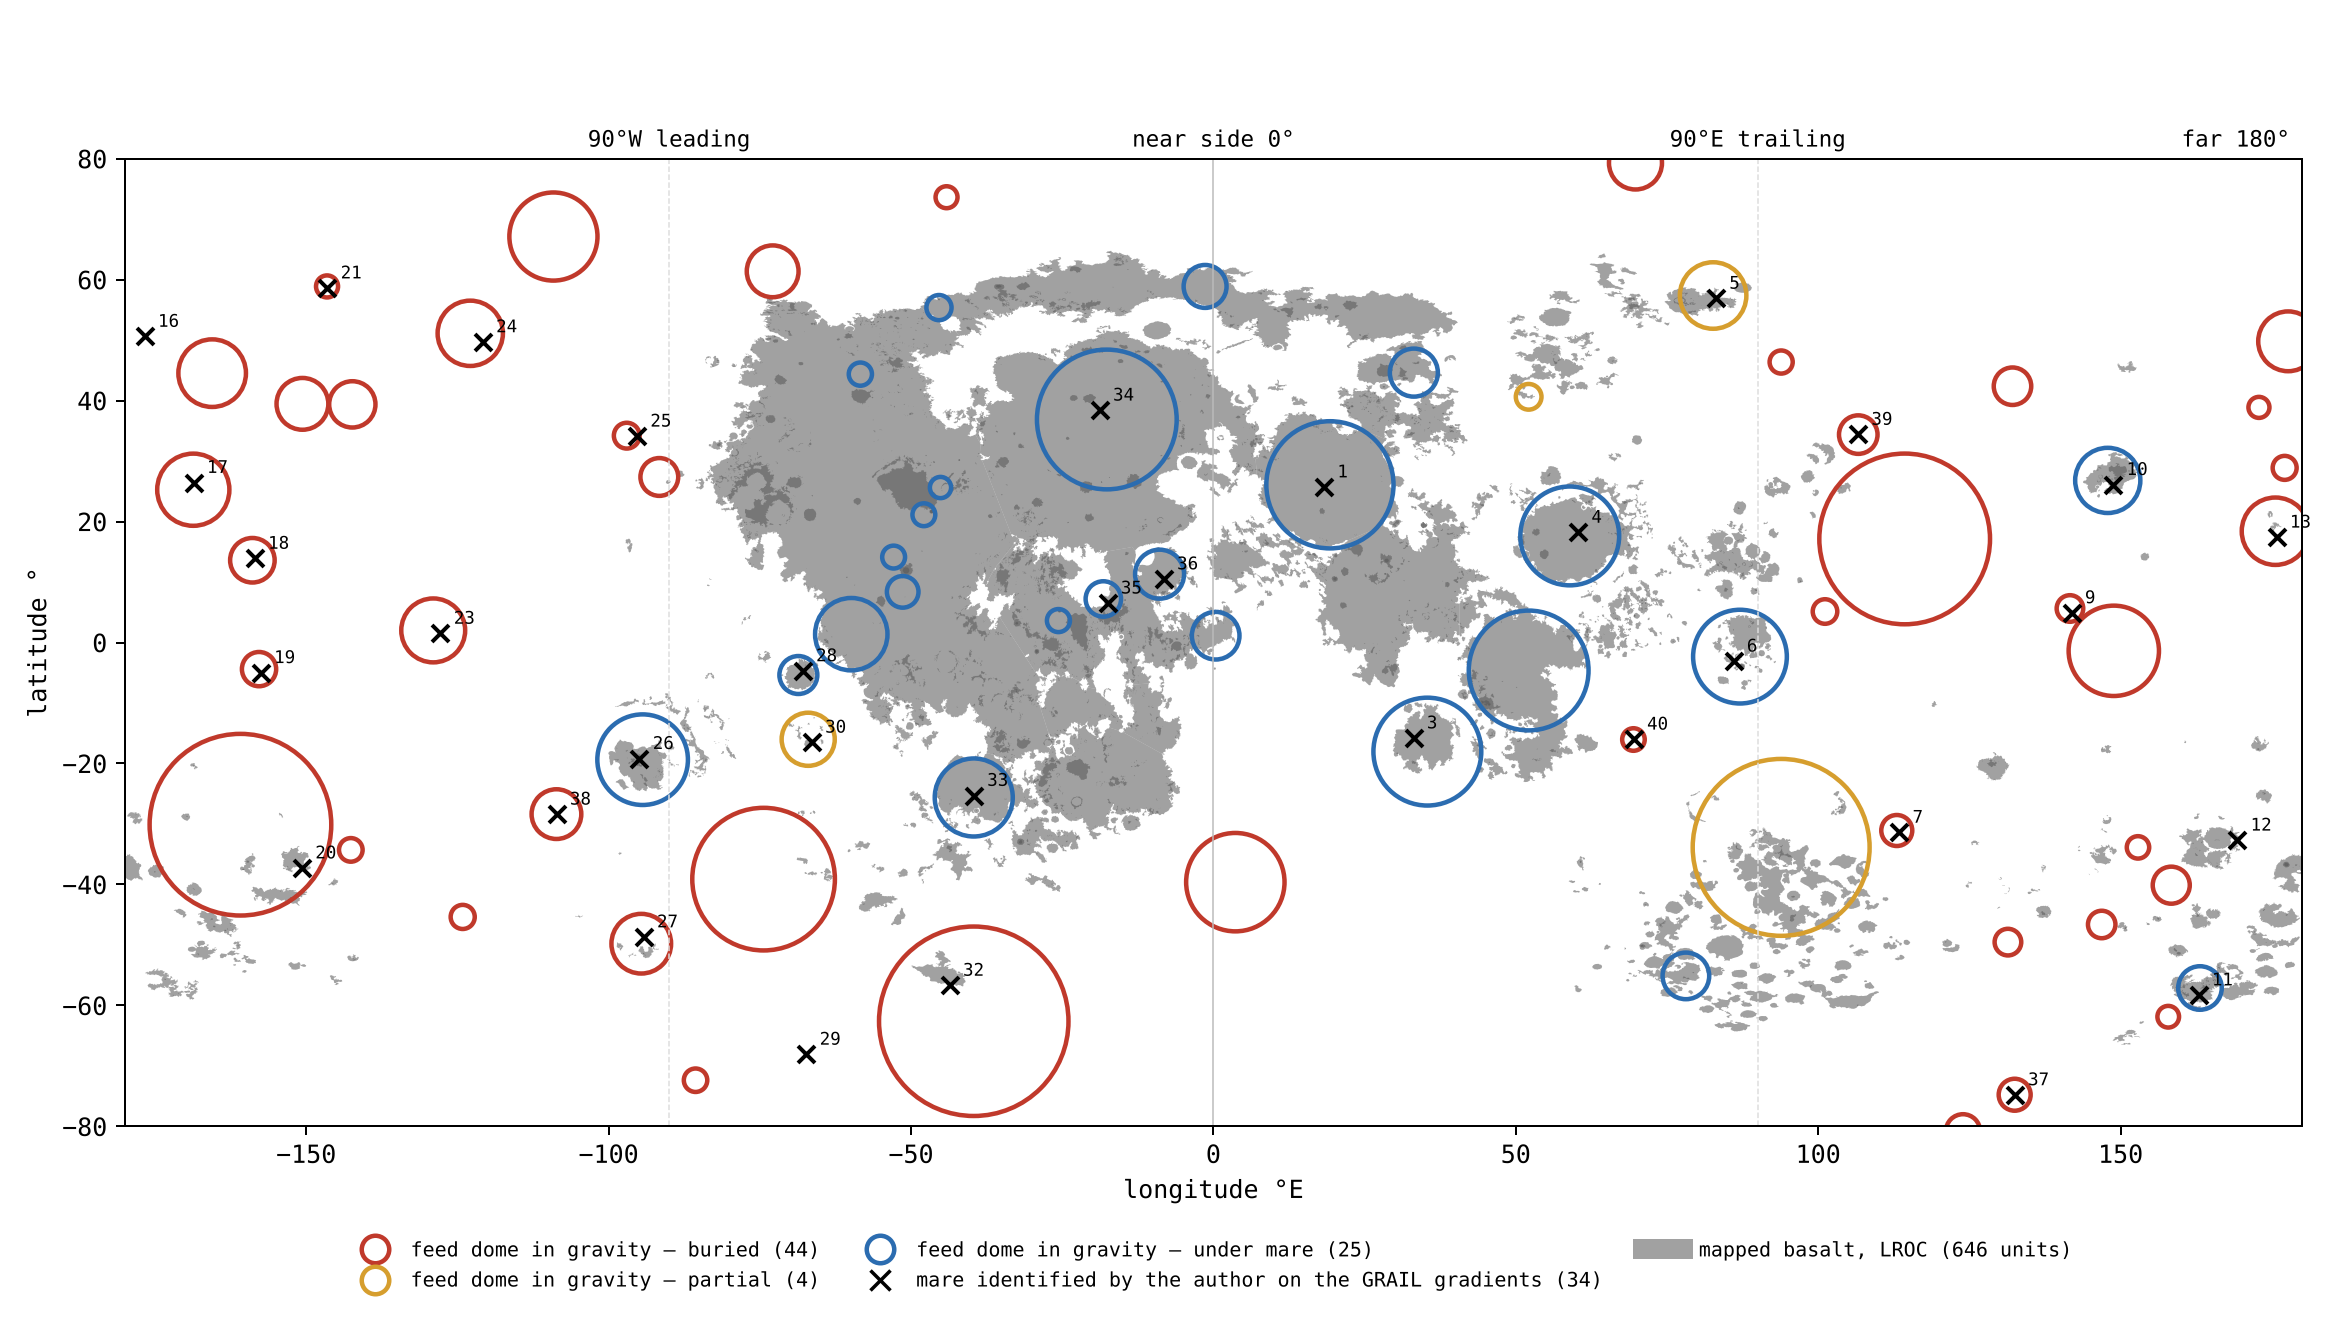
Figure 1 puts the three definitions on one map, the whole Moon spread flat with longitude across and latitude up. Look first at the grey patches: the basalt crowds onto the near side, in the middle of the map. Then look at the circles: the red ones, the buried domes, lie mostly where there is no grey at all, on the far side. Finally look at the crosses: almost every cross sits inside a circle, red or blue alike. The map shows the claim of this Part at a glance — the openings are spread over both sides, while the basalt is not.
A match of 33 out of 34 could still arise by chance if the domes covered most of the Moon. The table below asks how often points that are not maria would fall on a dome as well. Each row places 34 points in a different way, 20,000 times, and counts how many of them land on a dome. The green row is the result; the red rows are chance; the amber row is the strictest form of chance.
| Where the 34 points are placed | On a dome (mean) | Most in 20,000 trials | Trials reaching 33 |
|---|---|---|---|
| The 34 maria themselves | 33 | — | — |
| At random on the sphere | 7.9 | 18 | 0 |
| The whole set turned at random in every direction | 7.9 | 26 | 0 |
| The whole set turned in longitude only | 8.0 | 33 | 2 in 100 |
Points thrown at random fall on a dome about 8 times in 34: the domes cover roughly a quarter of the surface. Turning the whole set of maria as one piece keeps their pattern — their spacing and their clustering — and moves only where the pattern lies; it too gives about 8. Turning in longitude only keeps every mare at its own latitude, so that any tendency of maria and domes to favour the same latitudes is kept; even then 33 is reached only in 2 trials of 100, and only by turns of a few degrees, which leave the set almost where it is. The maria and the domes are therefore not two independent scatters that happen to overlap: they are one record.
The phenomenon. The literature counts the maria by their dark basalt; the model counts them as openings over feed domes, whether basalt covers them or not. The gap in knowledge. It has not been tested whether the maria identified on the gravity gradients and the dense bodies measured in the gravity field are one record or two. The research question: do the maria identified on the GRAIL gradients fall on the feed domes of the gravity field more often than chance would place them?
The maria are mapped as units of dark basalt, 646 polygons on the LROC map [S1]; the large basins are found as rings in topography and gravity, 20 of 500 km and more [S10]; buried basalt, “cryptomaria”, is known from dark-halo craters — small craters that dug through a bright cover and threw out the dark basalt beneath, ringing themselves with a dark halo — and from gravity [S17]. The dense bodies under the large basins, the mascons, are read as basalt fill and uplifted mantle [S20]. What is new here: every round gravity high of 100 km and more is taken as a candidate feed dome, the cover above each is read, and the maria identified on the gradients are tested against them.
A mare is an opening over a feed dome, so the maria seen on the gravity gradients and the feed domes measured in the gravity field are one record: nearly every mare sits on a dome, far more than chance would give; and many domes carry no basalt, most of them on the far side.
Type of research: quantitative; catalogues matched, with a chance test by simulation. The sample: the 34 maria of Appendix A, the 73 feed domes of the GRAIL field (degrees 6–660), the 646 LROC units. The tools: the GRAIL Bouguer gravity [S2], the LROC mare map [S1], and code that matches the catalogues and draws random sets.
| Rule | Why, in plain words |
|---|---|
| A dome: a round gravity high of 100 km and more, 50 mGal and more above its surroundings | A dense body pulls harder than the ground around it; the thresholds keep small and weak patches out |
| Cover: basalt on 25% and more, under 5%, or between | To tell an open mare from a buried one by what lies on top |
| A match: within the dome’s core radius or 150 km of its centre, whichever is larger | A mare and a dome are one if the mare lies on the dome |
The domes were found automatically from the gravity field; the maria were identified by observation of the gravity gradients. The two were matched by the rule above, and the same rule was applied to every random set.
The match. 33 of the 34 maria sit on a dome. Could chance do it? The 34 maria were replaced by 34 points placed at random on the sphere, 20,000 times: on average 8 of them fall on a dome, never more than 18, and not one trial reached 33. The whole set was then kept with its shape and turned at random in every direction: again on average 8, never more than 26. In the strictest trial the set was turned in longitude only, so that every mare keeps its latitude: 33 or more was reached in 2 of every 100 trials, the turns of a few degrees that leave the set almost in place. The cover. Of the 33 domes that carry a mare, 12 lie under basalt, 2 partly and 19 under bright highland.
Result. The hypothesis is supported: the maria seen on the gravity gradients and the feed domes are one record, the match far beyond chance; and most feed domes carry no basalt, most of them on the far side. The dichotomy of the Moon is a dichotomy of cover, not of openings. Limitations. The maria were identified by one observer; the thresholds of a dome (100 km, 50 mGal) are choices, and weaker domes would raise the count; a dome found by gravity alone may be a dense body of another origin; the three maria over South Pole–Aitken have no dome of their own. Directions for further research. A second, independent identification of the maria on the gradients; the count repeated at other thresholds and on the field of degrees 6–900.
C.6 What the difference in definition explains
The two definitions do not only give different numbers; they give a different picture of the Moon. Read as basalt, the Moon is two-faced: a dark near side and a bright far side. Read as openings, it is not: the far side holds more feed domes than the near side, 40 against 33, buried by the layers that built it (Paper 3, §B.7), while on the near side, which faced the hot Earth, the openings were active passages of the Earth’s pressure — Serenitatis until it peeled away, Imbrium until detachment. The smooth near side and the layered far side are one feed system under two covers — as two halves of a field with the same wells, one half later covered with soil and the other left bare. And a crater with a lava floor is not an opening: it landed on lava, and the model counts it among the craters, not among the maria.
What we now have: a definition of a mare by what lies beneath it; a count of the openings that includes the 44 the basalt does not show; and a test showing that the maria and the feed domes are one record. The rest of this Part asks whether these openings threw the material that lies around them.
C.7The source test
If a mare is the source of the returning material, the ground around it must carry its material, and more of it near the mare than far away. Mare material is easy to recognise by its iron and titanium: the basalt is rich in both, the highland poor. The test therefore reads iron around the maria, ring by ring of distance, and sets it against craters far from any basalt.
Around six maria — Crisium, Imbrium, Moscoviense, Nectaris, Serenitatis and Smythii — and around three plains — Procellarum, Tranquillitatis and Fecunditatis — 11,574 craters of 5–60 km outside the basalt were chosen and frozen before any chemistry was read, with 5,922 matched controls more than 600 km from any basalt. Choosing and saving the sample before reading the chemistry means the sample could not be shaped, even unknowingly, by the result. Iron and titanium are from the Kaguya Multiband Imager [S3]:
| Around | FeO, wt% | 0–50 km | 50–150 | 150–300 | 300–600 | Control |
|---|---|---|---|---|---|---|
| The maria | ground | 5.96 | 3.54 | 3.28 | 3.40 | 2.30 |
| crater minus ground | ||||||
| The plains | ground | 9.41 | 6.10 | 4.24 | 2.60 | 2.30 |
| crater minus ground |
The table reads from left to right, outward from the edge of the basalt; the deeper the orange, the more iron. Each group has two rows: the iron of the ground around the craters, and the difference between the inside of each crater and that ground. The last column is the control, far from any basalt. The rings here are coarse; the same craters read in the finer rings of §J.1 give 6.9 wt% at 0–25 km and 3.1 at 100–150 km, the values quoted in the abstract.
Around every mare the ground carries the mare’s iron, fading with distance: two and a half times the controls within 50 km, and still half as much again as the controls at 300–600 km. Around the plains the ground is richer near the edge and poorer far from it: their melt spilled over their edges onto the land beside them, and did not reach far. The difference in the far ring is the telling one: 3.40 around the maria against 2.60 around the plains, with 2.30 in the controls. A mare threw its material far; a plain only spilled over its edge.
The phenomenon. The craters near a mare are dark and rich in iron. The gap in knowledge. Whether a crater near a mare carries the mare’s iron because the mare’s material made it, or because it dug through a dark cover, has not been tested against controls chosen before the chemistry was read; nor has the ground around a mare been set beside the ground around a plain. The research question: does the iron inside the craters near a mare fall with distance from the mare as the iron of the ground around them does, does the inside of each crater equal its ground, and how does the ground around a mare differ from the ground around a plain?
Mare material is known to extend beyond the mapped edge of a mare, carried sideways by later cratering, a few kilometres to some tens of kilometres [S18]. Iron and titanium are read from the Kaguya Multiband Imager [S3]. What is new here: the inside of every crater is compared with its own ground, ring by ring of distance, with matched controls far from any basalt, and the maria and the plains are read apart.
The material a mare threw made the craters near it; so the craters near a mare carry its iron, the iron falls with distance, and each crater carries the iron of the ground it landed on, not more. A plain threw nothing: its melt spilled over its edge onto the land beside it, so the ground beside a plain is rich, but the richness does not reach far.
Type of research: quantitative, with a control group. The sample: 11,574 craters of 5–60 km outside the basalt, 5,840 around six maria and 5,734 around three plains; the control: 5,922 craters matched by size, more than 600 km from any basalt. The tools: the Kaguya iron and titanium maps, the LROC mare map, and code that reads each crater and its ground at 3–4 radii, basalt pixels removed.
The craters and the controls were chosen and saved before any chemistry was read. Each was then read inside and in its ground, and assigned to the mare or plain whose edge is nearest. The values are the table of §C.7.
The fall with distance. Around the maria the iron of the ground is 5.96 wt% within 50 km, 3.54 at 50–150 km, 3.28 at 150–300 km and 3.40 at 300–600 km, against 2.30 in the controls. Crater against its ground. Around the maria the crater minus its ground lies between and wt% (95% interval at 0–50 km: to ), and in the controls: far below the calibration scatter of the maps, 0.81 wt%. The crater carries its ground. The plains. Around the plains the ground holds 9.41 wt% within 50 km and 6.10 at 50–150 km, more than around the maria; at 300–600 km it holds 2.60, near the controls, while around the maria it still holds 3.40.
Result. The hypothesis is supported: the craters near a mare carry its iron, fading with distance, and each carries the iron of the ground it landed on; the ground beside a plain is rich, its spilled melt, and falls to the level of the controls far from it, while the ground far from the maria keeps an excess. Limitations. The test reads the surface; it does not separate a thin cover from the crater’s own fill; the far rings of neighbouring maria and plains overlap, and the near side, where the plains lie, has basalt on many sides. Directions for further research. The same test on titanium and thorium crater by crater; the halo of each mare and each plain read only on the side away from other basalt; craters around the far-side maria alone (Paper 6, Study 2).
C.8The veneer and the crater
The source test leaves one result to explain: a crater near a mare is slightly poorer in iron than the ground around it. The explanation is a thin surface layer. The ground around a mare is the mare’s own material: many small fragments thrown over the land around it laid a veneer rich in iron and titanium, thick at the mare’s edge and thinning outward. The ground beside a plain carries a veneer of the same kind, of the plain’s own melt spilled over its edge. A crater made later in this ground threw the veneer aside and opened the poorer base, and so it is poorer than its own ground at every distance; in the controls, where there is no veneer, the difference is zero — as a spade pushed into a lawn sprinkled with dark sand throws the sand aside and shows the paler soil beneath.
Dionysius, a crater of 17.4 km at 17.6 km from the plain of Tranquillitatis, shows the three places at once: the plain holds 17.2/8.1 wt% FeO/TiO, the ground around the crater 12.7/3.4, its interior 9.1/0.7, and its ejecta 8.5/1.5 — the crater threw out the poor base, and the rich veneer lies beyond it. The numbers fall in the order the picture requires: the plain richest, the ground beside it next, and the crater’s inside and the material it threw out the poorest, because both come from beneath the veneer.
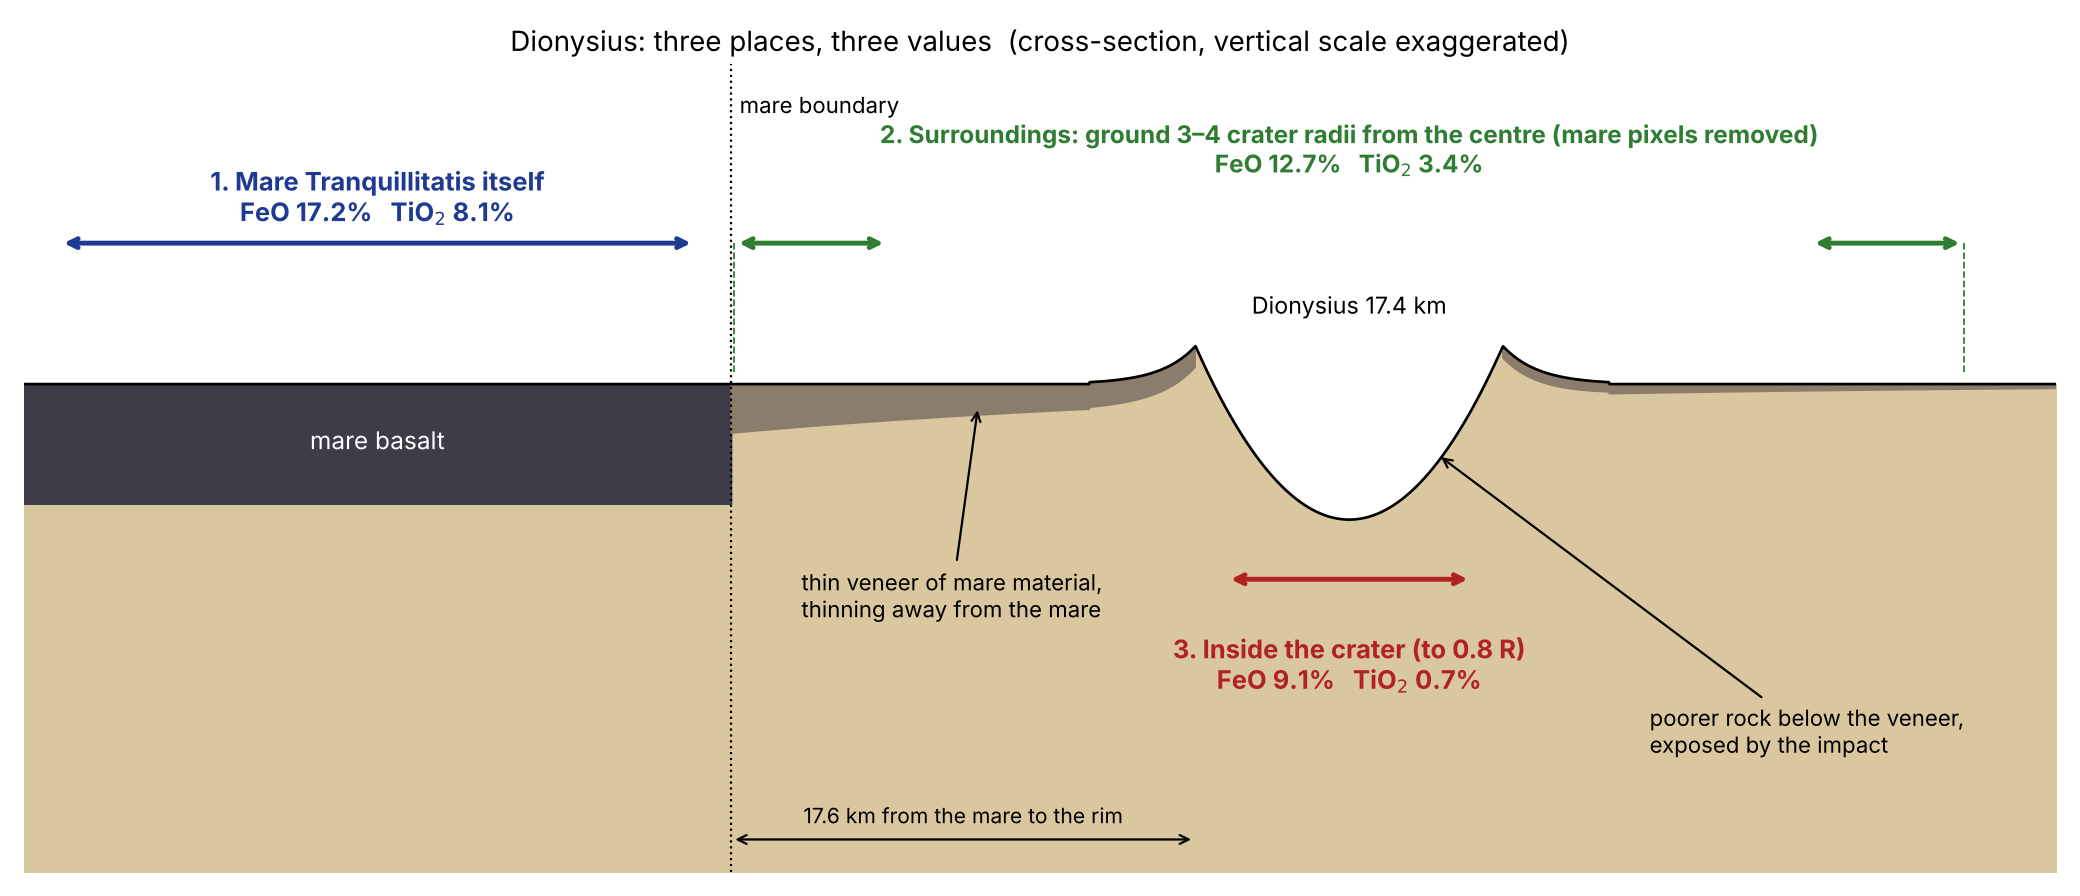
Figure 2 is a cross-section through the ground beside the plain: read it from the plain outward, and follow the dark veneer as it thins and is broken where the crater opened the poorer base beneath.
C.9The width and shape of the halo
The halo is the zone around a mare or a plain in which the ground carries its iron. The halo grows with the basalt beside it. Its width is measured by the half-distance: the distance at which the excess of iron over the far ground falls by half. The distance at which the excess of iron falls by half is about 23 km around Moscoviense and about 119 km around the plain of Tranquillitatis; for titanium 17 and 104 km. A wide plain spilled a wide veneer beside it; a small far-side mare, on a thick crust built of layers, laid a narrow one — Moscoviense reaches the far-side level of about 2% FeO within 100 km. The shape of the halo, east against west, is stated as a test in Part M.
C.10 The record of craters around the openings
An active mare covers its own record and makes craters elsewhere: this is equation (1) seen on the ground. Mare Crisium shows it most sharply: its rim is ringed by craters it made, while its floor, remelted while it was active, holds few. The difference between the leading and trailing halves in the number of craters is the subject of Paper 6 (§C.3, Parts F–I).
What we now have: the maria counted as openings, 33 of 34 on a feed dome; the 44 buried openings that the basalt does not show; and the ground around every mare carrying its material, fading with distance, as a source must. Part D follows the openings themselves, visible and buried.
The openings, visible and buried
if a mare is an opening, the openings must be found where no basalt lies. The approach: the feed domes of the gravity field are read with the surface above them, the crust over them and the chemistry on them.
Part C defined a mare as an opening over a feed dome and showed that the maria marked on the gravity map and the dense bodies measured in the gravity field are one record. This Part takes the next step. If the opening, not the basalt, is the mare, then some openings should exist where no basalt is seen at all: openings that worked, were later covered by the layers that built the land around them, and are now hidden under bright highland. We call such an opening a buried opening, and the dense body beneath it a buried feed dome. The question of this Part is how such an opening can be recognised when nothing on the surface shows it, and how it can be told apart from an ordinary crater.
The answer rests on gravity. A spacecraft pair such as GRAIL measures how strongly each part of the Moon pulls. The Bouguer gravity field is that pull after the attraction of the visible relief — the hills and hollows of the surface — has been computed and removed; what remains shows where the material beneath the surface is denser or lighter than average. A feed dome froze into a dense body, so it pulls harder than the ground around it and appears in the Bouguer field as a round patch of stronger gravity, whether basalt lies on top or not. Gravity therefore sees the opening through its cover. Three further readings then tell whether a gravity high is a buried opening: the crust under it (§D.2), the cover on top of it, and the chemistry and craters of that cover (§D.5).
D.1The map of the openings
The two catalogues of Part C are one record seen twice: 34 maria identified on the gradients of the gravity field, and 73 feed domes measured in it. The first catalogue was made by eye: the gradients of the field show where the pull changes sharply, that is, the edges of dense bodies. The second was made by code: every round gravity high of 100 km and more, standing 50 mGal and more above the ring around it, was taken as a feed dome (§C.3). (The mGal, or milligal, is a small unit of gravitational acceleration used for such local differences.) Thirty-three of the 34 sit on a dome (§C.5). The table of all maria, with name, position, zone, generation and the dome beneath, is Appendix A.
D.2Basin or crater, by what lies beneath
A large round dark plain may be one of two things. It may be an opening, the surface of a feed dome; or it may be an ordinary crater whose floor happens to be dark, because the returning material landed on a lava area and exposed lava on its floor. On the surface the two can look alike. This section separates them by what lies beneath.
What lies beneath decides. The reason is simple: a feed dome was pushed up from a subsurface focus, so it raised the dense material beneath the opening and thinned the light crust above it; a crater was made from above, by material that landed on the surface, and leaves the crust beneath it as it was. So under the centre of an opening the crust is thinner than in a ring at 1.3–2.0 radii around it; under a crater it is not. We call the difference — the crust thickness in the ring minus that under the centre — the crust jump.
Of the 36 marked openings (the points marked on the gravity map; their relation to the 34 maria is given in Part C), 26 show a jump of 8 km and more in the crustal models of GRAIL — Moscoviense +29 km, Orientale +28, Nectaris +24, Humboldtianum +24, Apollo +23, Smythii +23, Crisium +22, Serenitatis +21 among them; 4 are unclear; and 6 show less than 4 km, all of radius 43–92 km, Tsiolkovskiy among them. Every opening larger than about 120 km shows the jump. Under Moscoviense, for example, the crust is 29 km thinner at the centre than in the ring around it. Tsiolkovskiy, its floor dark with lava, is a crater: it landed on a lava area. The six small structures without a jump are therefore not openings that failed the test; they are craters that the eye, reading the dark floor, had taken for openings, and the crust beneath them sorts them out.
The phenomenon. Some round dark plains are large basins of the maria, others are craters whose floor is dark with basalt. The gap in knowledge. By their surface the two look alike; what lies beneath has not been used to sort the marked openings one by one. The research question: is the crust thinner under the centre of each marked opening than in a ring around it, and does that separate the openings from ordinary craters of the same size?
The GRAIL crustal models show the crust thinned under the large basins, read as the mantle lifted by the basin-forming event [S19]; the mascons above them are read as that uplift with basalt on top [S20]. (A crustal-thickness model converts the measured gravity into the depth of the boundary between the light crust and the denser mantle beneath it, given an assumed density for each; a mascon, short for “mass concentration”, is a region whose gravity is stronger than its surroundings because denser material lies beneath it.) What is new here: the thinning is measured for each opening of the catalogue, and the same measure is taken on ordinary craters away from any opening.
An opening sits over a feed dome that thinned the crust beneath it; a crater landed on the surface and did not. So the large openings show a crust jump between the ring and the centre, and the ordinary craters do not.
Type of research: quantitative, with a control group. The sample: the 36 marked openings; the control: 169 craters of 40–300 km radius from the Wang & Wu catalogue [S6], latitude within 70°, none closer to an opening than twice its radius. The control is the heart of the test: it asks what an ordinary crater of comparable size looks like beneath, measured in exactly the same way, so that a jump under the openings cannot be put down to the method or to size alone. The tools: the four crustal-thickness models of GRAIL, averaged, and code that reads the crust under the centre (to 0.3 of the radius) and in the ring of 1.3–2.0 radii. The four models differ in the densities and porosity they assume; averaging them keeps the result from resting on one set of assumptions.
The crust was read under each opening and each control crater with the same rings. A jump of 8 km and more counts as a jump; less than 4 km as none. The gap between the two thresholds keeps the borderline cases, the “unclear”, apart from both groups.
The openings. In the first reading (the text above), 26 of the 36 show a jump of 8 km and more, 4 are unclear and 6 show less than 4 km, all of radius 43–92 km. Read again with exactly the rings used for the control, 29 of the 36 show the jump and 5 show less than 4 km; the median jump is 17 km. Every opening larger than about 120 km shows it. The control. Of the 169 ordinary craters, 4 show a jump of 8 km and more, about 2%; their median jump is 1 km. What chance would give. The control fixes the chance rate: if the marked openings were ordinary craters, about 2% of them — less than one of the 36 — would show the jump. The observed number is 29. The typical opening has its crust thinned by 17 km; the typical crater by 1 km, within the noise of the models. By size. Among the structures of 40–120 km radius neither the small openings nor the craters show the jump; above 120 km almost every structure is an opening, and almost every opening shows it.
Result. The hypothesis is supported: a jump in the crust marks an opening, and an ordinary crater lacks it. The small openings without the jump, Tsiolkovskiy among them, are craters that landed on a lava area. Limitations. Size and kind are tied together: there are few ordinary craters as large as the large openings, so the comparison is strongest below 120 km; the crustal models assume a density for the crust, and the jump depends on it. A specialist may object that the large basins are expected to thin the crust whatever made them. The answer of this study is the control: the craters of 40–300 km radius, measured the same way, show the jump in only 4 of 169, so the jump belongs to the openings and not to any large round structure. Directions for further research. The jump read on the field of degrees 6–900, and against the strength of the dome above it.
D.3Procellarum, a basalt plain
Oceanus Procellarum, 1.8 million km² of basalt, is not one mare but a basalt plain. It is not the contact: the contact is the 3,000-km region at the tip of the pear, centred at about 22–24°N (Part B), and Procellarum lies within the near-side region that the Earth’s heat melted. Its rectangular border is seen in gravity without a topographic expression [S11]: a line that shows in the pull of the ground beneath but not in the height of the surface, as the boundary of a region shaped from below rather than dug from above would. It holds several feed domes, which the literature counts as one mare and the eye takes as one opening. The plain itself is crust melted in place, with no feed dome of its own (§C.2); the domes within its outline belong to separate openings, and the model counts them one by one.
D.4The buried feed domes
The table below sorts the 73 feed domes by the cover above them and by side. A dome is buried when less than 5% of its area carries basalt — only bright highland lies on it; under a mare when 25% and more is basalt; partial in between (§C.3). The highlighted cells show where the two kinds gather: the buried domes on the far side, the open ones on the near side.
| Buried (basalt 5%) | Partial | Under a mare | Total | |
|---|---|---|---|---|
| Far side | 36 | 1 | 3 | 40 |
| Near side | 8 | 3 | 22 | 33 |
| Whole Moon | 44 | 4 | 25 | 73 |
On the far side 36 of the 40 feed domes are buried: Freundlich–Sharonov, Hertzsprung, Coulomb–Sarton, Fitzgerald–Jackson, Dirichlet–Jackson, Korolev, Mendeleev, Schrödinger, Milne and others. On the near side only eight are buried, and they lie at its margins and near the poles: Balmer–Kapteyn and the Schiller–Schickard region among them, both known in the literature as cryptomaria — buried basalt, revealed by small craters that dug dark material up from beneath a bright cover. That two of the buried domes coincide with cryptomaria already known from other evidence is an independent check: where the literature has found hidden basalt by digging, the gravity finds a buried dome. They were open when the surface was flat, and were buried after. The far side, with its many buried domes, records a strong activity of maria in the early stages; the near-side maria formed or were exposed after.
The table also changes the picture of the Moon’s two faces. Counted by visible basalt, the far side has few maria; counted by feed domes, it has more than the near side, 40 against 33. The difference between the two faces lies in what covers the openings, not in how many there are (§C.6).
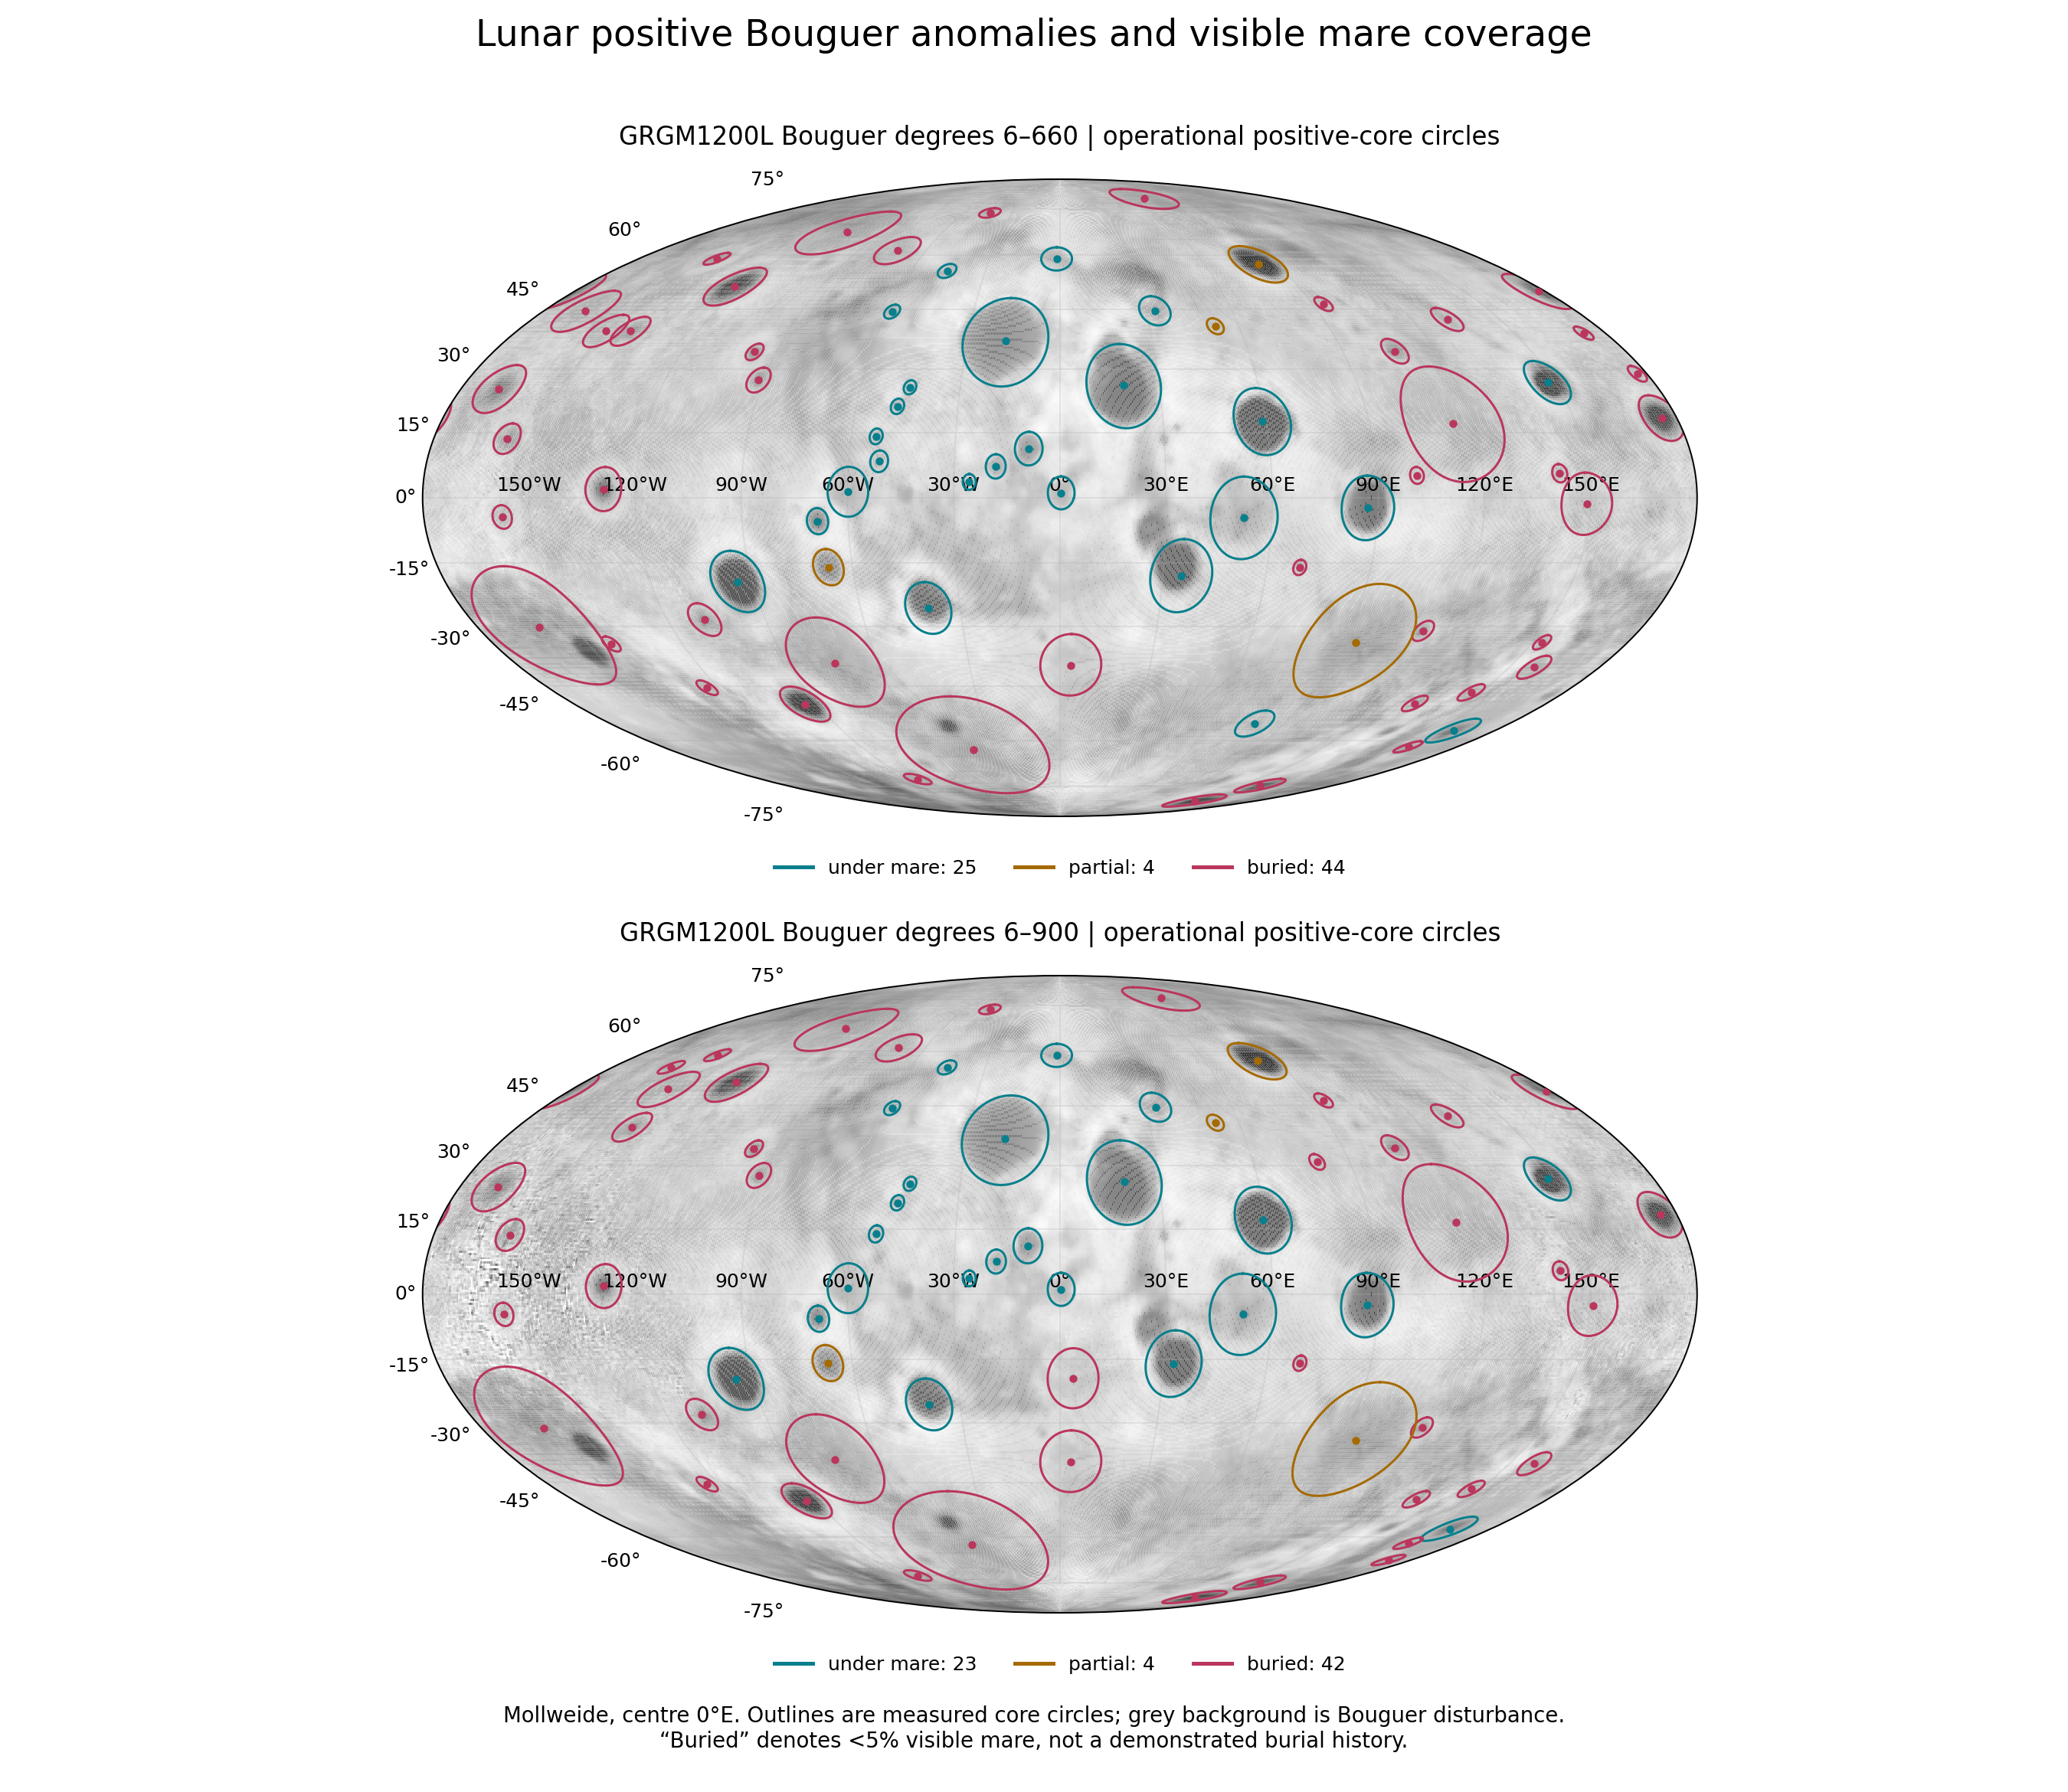
Figure 3 shows the whole Moon in an equal-area (Mollweide) projection, the near side in the middle and the far side at the left and right edges. The grey background is the Bouguer gravity; each outline is the measured core of a feed dome, coloured by its cover. Look at the distribution of colours: the blue outlines crowd the centre of the map, the near side, while the red ones fill the far side and the polar margins. The two panels show the same field at two resolutions. The “degrees” are the terms in which a gravity map is built, from the broadest variations to the finest: degrees 6–660 drop the broadest, Moon-wide variations and keep features down to a fine scale; 6–900 keeps finer detail still, at the cost of more noise. Almost the same domes appear in both, so the catalogue does not depend on the resolution chosen.
D.5 What lies on them
If a buried dome is an opening that was later covered, three things follow, and the table below tests each. The surface over it should be the same layer that covers the land around it, so its iron and thorium should match the surroundings. The crust over it should be thicker than over an open dome, by the thickness of the cover. And the craters made while it was open should have been buried with it, so craters should not gather on it. In the table, the green cells are the differences that come out as zero, as the cover requires; the orange cell is the extra crust over a buried dome. (Thorium, a radioactive element, is measured from orbit by the gamma rays it emits; ppm is parts per million by weight; FeO is iron oxide, in percent by weight.)
| Measure | Over the buried domes | Against domes under a mare |
|---|---|---|
| FeO on the core minus its surroundings | wt% ( to ) | ( to ) |
| Thorium on the core minus its surroundings | ppm ( to ) | lower by 3.52 ppm ( to ) |
| Crust over the centre | thicker by 8–13 km | — |
| Large craters on the dome against 3–5 radii | 0.48–0.95 | — |
The surface over a buried dome is the same layer that covers the land around it: the same iron and the same thorium. An open dome, by contrast, carries its own iron: over it the core is richer than its ring by 1.47 wt% FeO even with the mare pixels removed. The crust over a buried dome is thicker by the thickness of what covers it. And the craters do not gather around it, because the craters made in its time were buried with it: the density of large craters on the dome is 0.48–0.95 of that at 3–5 dome radii, never above it. A buried dome is therefore not a dense body that happens to lie under highland; it is an opening with a blanket over it, and every reading of the blanket says the same. One buried dome stands apart, the largest, inside South Pole–Aitken (30°S, 199°E), with 0.86 ppm of thorium over its surroundings.
The phenomenon. Of the 73 feed domes, 44 lie under bright highland with no basalt on them. The gap in knowledge. If these are openings that worked early and were then covered, the surface over them must be the same layer that covers the land around them, the crust over them must be thicker by that cover, and the craters of their time must be buried with them. The research question: what lies on the buried domes — iron, thorium, crust and craters — compared with the land around them and with domes of the same strength under an open mare?
Buried basalt, the cryptomaria, is known from dark-halo craters that dug it up from under a highland cover, and is read as early lava covered by the ejecta of later basins [S17]. The crust is read from the GRAIL models [S19], iron from Kaguya [S3], thorium from Lunar Prospector [S4]. What is new here: every buried dome is compared both with its own surroundings and with open domes of the same strength.
A buried dome is an opening covered by the layers that built the land around it; so over it the iron and thorium equal those of its surroundings, the crust is thicker than over an open dome of the same strength, and the craters do not gather on it.
Type of research: quantitative, comparing the core of each dome with a ring around it, and buried domes with open ones. The sample: the 44 buried domes; the comparison group: the 25 domes under an open mare. The tools: the Kaguya iron map, the Lunar Prospector thorium map, the four GRAIL crustal models, the Wang & Wu catalogue [S6], and code that reads the core and a ring at 2–3 dome radii, mare pixels removed from both. Removing the mare pixels on both sides keeps the comparison like for like: the open domes are not credited with the iron of the basalt on their surface, and what is compared is the ground itself.
Each dome was read on its core and its ring on every map; the 95% intervals were found by resampling the domes. Resampling means drawing many new sets of domes at random from the measured set, with repeats allowed, and recomputing the result each time; the range that holds 95% of those results shows how far the answer could move if a different set of domes had been available. The values are the table of §D.5.
Iron. Over the buried domes the core minus the ring is wt% FeO (interval to ): zero within the interval. Over the open domes, the same measure, mare pixels removed, is ( to ). The two intervals do not overlap: the open domes carry their own iron, the buried ones carry the iron of the land around them. Thorium. Over the buried domes ppm ( to ); lower by 3.52 ppm ( to ) than over open domes of the same strength. Crust. Thicker by 8–13 km over a buried dome than over an open one of the same strength, in all four models. Craters. 0.48–0.95 of the density at 3–5 radii: never crowded on the dome.
Result. The hypothesis is supported: the surface over a buried dome is the layer of the land around it, the crust over it is thicker by that layer, and the craters of its time were buried with it. One dome stands apart, the largest, inside South Pole–Aitken, with 0.86 ppm of thorium over its surroundings. Limitations. The thorium map resolves about 60 km, and 20 of the 73 domes are smaller than twice that; the comparison of strength between buried and open domes is matched only roughly. Directions for further research. The depth of each dense body from its gravity, against the thickness of the cover over it.
What we now have: an opening can be found without basalt. Gravity shows the dense dome beneath it; the crust jump shows that the dome thinned the crust from below, as a crater does not; and the cover over a buried dome is the ordinary layer of the land around it, thicker by its own thickness and holding no gathering of craters. Most such openings lie on the far side.
D.6The character of an opening by its zone
The model divides today’s Moon into zones by where each part of the surface stood on the body while it was attached (Part B), and the openings into generations by when they were exposed: generation I beyond the hill, generation II in the hill, generation III in the contact (Appendix A). If the generations are real, the character of the openings should change with the zone: openings with a mascon and a ring in the belt, mascons without a ring in the contact disc, buried domes on the far side. The last is now measured (§D.4); the first two are stated as tests in Part M.
D.7Exit openings and mouths
The paper uses two kinds of opening (§A.1): an exit opening threw material outward; a mouth passed material while still covered, toward the exit openings, and was exposed only later. Each opening is classified as an exit, a mouth, or both, by its generation, its structure and its filling. The classification by appearance and by position need not agree; where they disagree, the disagreement is recorded as a result, not resolved by choice. For Imbrium and Nectaris the two agree. Imbrium looks new and lies in the contact: 14.8° (447 km) from the contact centre, well inside the 1,500-km disc, generation III. Nectaris looks intermediate and lies on the hill: 69° (2,100 km) from the contact centre, outside the disc, and 38° (1,150 km) from the hill centre, generation II (Appendix A). Measured from the sub-Earth point, by which the share rule sizes the zones, Imbrium lies at 42°, in the belt; that reading gave the earlier statement (an earlier version placed Imbrium in the belt and Nectaris in the contact). In this way the classification cannot be bent to fit the model: each opening is read twice, independently, and both readings are kept.
The feed dome
an opening rose through a dome, and the dome must be seen. The approach: each mare was measured over the core of its own feed dome: the strength of the dome, and the height of the centre against the margin.
Part D found the openings, open and buried, through the dense bodies beneath them. This Part looks at the dense body itself, the feed dome, and asks whether the surface of each mare carries its mark.
It helps first to fix the physical picture. A feed dome forms where material is pushed upward from a subsurface focus — a place at depth from which the feed rises. The push raises the centre and widens the margins, as a hand pressing up under a sheet of soft dough lifts its middle and stretches it outward. Through the dome the material rose into the opening, and at most openings it was thrown out (§A.1); Imbrium and Serenitatis did not eject (Serenitatis only slight popping). While the feed is active, the melt stands at the height of the rim. When the feed stops, the material left in the dome freezes in place into a body richer in iron and titanium, and therefore denser, than the crust around it. That dense body is what the gravity field sees today: it pulls harder than its surroundings, and so stands out in the Bouguer field as a round high, strongest over its centre (Figure 5). Its strength, the excess of gravity at its centre over the ring around it, measures how much dense material it holds. Over it the surface, the floor of the mare, stands lower at the centre; Three causes may lower the centre — the weight of the dense body, suction, and, in our view mainly, thermal expansion and contraction with heat and cold, which is stronger the larger the mass in diameter and depth (§E.3). This Part measures the sag.
E.1The feed dome beneath each mare
Every mare of this paper stands over a feed dome seen in the GRAIL gravity field, except three that lie over South Pole–Aitken, whose domes were cooked away by the heat beneath that basin (§C.2). (Strictly, Ingenii alone has no dome under it; Apollo and Bailly fall within the core of a large neighbouring dome, §C.5, but none of the three has a dome of its own.) The domes differ widely in strength, the excess of gravity at their centre over the ring around them. Among the twelve open maria, the strongest are Orientale (740 mGal), Moscoviense (689), Nectaris (538), Crisium (527), Smythii (484), Serenitatis (412), Humorum (400), Grimaldi (333) and Imbrium (309). The buried maria of the far side carry domes as strong: Freundlich–Sharonov 519, Mendel–Rydberg 479, Hertzsprung 470. A buried mare is therefore not a weak or failed opening: its dome holds as much dense material as those of the great open maria; only its cover differs.
E.2The centre sank over the dome
If the centre sank over the dome as it froze, the floor above it should be lowest where the dome is thickest, over its centre, and the stronger the dome, the deeper the sag. The table gives the measurement. The blue rows are the test, on the open maria, where the surface is the mare floor itself; the last row, the buried maria, is shown apart because their surface is the cover laid over the dome.
| Measured | Result |
|---|---|
| Open maria: centre against margin | lower in 10 of 12, median m |
| Open maria: height of the centre against the strength of the dome | , |
| The two exceptions | Serenitatis m and Imbrium m, both maria of the contact |
| Buried maria (surface is the cover, shown apart) | lower in 15 of 17, |
The centre of a mare stands lower than its margin, and the stronger the dome beneath it, the lower the centre. The two maria whose centre stands high are the two large maria of the contact. Here is a rank correlation: the maria are ranked once by the strength of their dome and once by the height of their centre, and says how closely the two rankings agree — if they agree perfectly, if they are perfectly reversed, 0 if they are unrelated. A value of means that the stronger domes clearly tend to carry the lower centres. The value is the probability that a relation at least this strong would appear by chance if there were none.
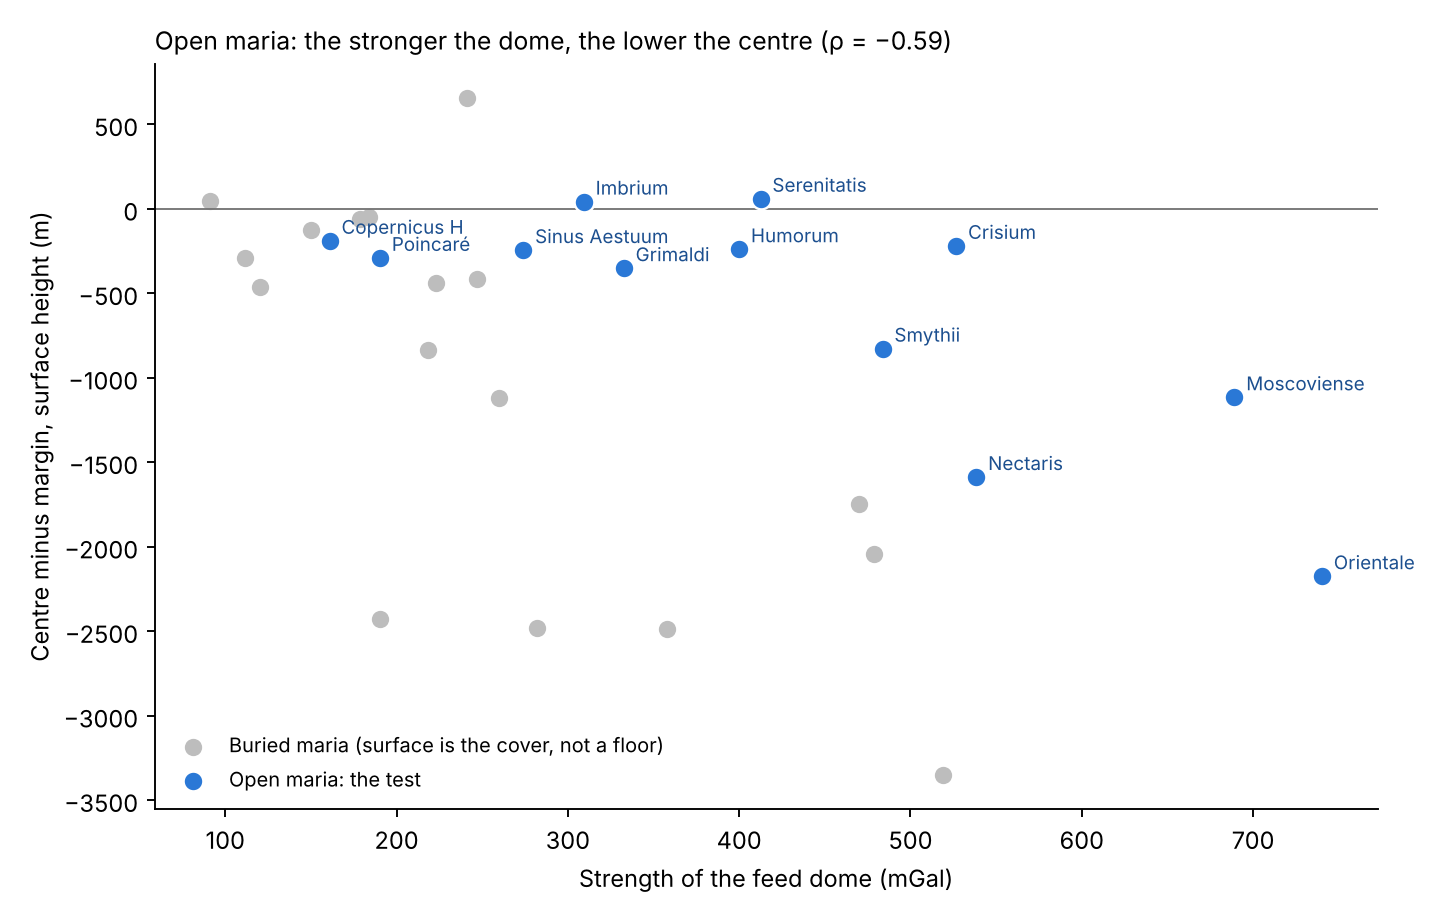
Figure 4 places each mare by the strength of its dome (horizontal) and by how far its centre stands above or below its margin (vertical); the horizontal line at zero marks a level floor. Look at the blue points: they fall from upper left to lower right. The weak domes, Copernicus H and Poincaré, carry floors only slightly lowered; the strongest, Nectaris, Moscoviense and Orientale, carry floors lowered by one to more than two kilometres. Only Imbrium and Serenitatis, the two maria of the contact, sit just above the line. The grey points, the buried maria, mostly lie below the line as well, but they are not part of the test.
The phenomenon. Every mare of this paper stands over a dense feed dome, and the floors of the maria are not perfectly level. The gap in knowledge. Whether the shape of a mare’s surface follows the strength of the dense body beneath it has not been measured mare by mare. The research question: does the centre of a mare stand lower than its margin, and does it stand lower the stronger the feed dome beneath it?
In the literature the dense bodies beneath the large basins, the mascons, are basalt fill over mantle lifted by the basin-forming event. Their load bent the floor down in the centre and the margins up, opening graben at the margins and squeezing ridges in the interior [S20, S21]. (A graben is a long trough where the ground was pulled apart and a strip dropped between two faults; a wrinkle ridge is a low, winding ridge where the surface was pushed together.) The surface is mapped by laser altimetry [S7], which measures the height of the surface by timing laser pulses from orbit. What is new here: the maria are the openings identified on the gravity gradients (§C.2), each measured over the core of its own feed dome, and the height of the centre is read against the strength of that dome.
The feed dome froze into a dense body rich in iron, thickest under the centre, and the centre sank over it, by its weight, by suction or, mainly, by thermal contraction. So the centre of a mare stands lower than its margin, and lower the stronger the dome.
Type of research: quantitative; the centre against the margin of each mare, and a rank correlation across maria. The sample: the 34 maria of Appendix A; the test is made on the 12 open maria, whose surface is the mare floor itself. The 17 buried maria are shown apart, since their surface is the cover laid over the dome and its height is that of the cover. The 2 partly covered and the 3 maria over South Pole–Aitken are left out of the correlation. Together these account for all 34: 12 open, 17 buried, 2 partial and 3 over South Pole–Aitken. The tools: the laser altimetry [S7], the feed domes of the GRAIL field (Part C), and code that reads the surface over each dome.
The rules of the measurement are set out below, each with its reason.
| Rule | Why, in plain words |
|---|---|
| The area of a mare: the core of its feed dome | The dome is the structure beneath the opening; its core sets where the centre and the margin are |
| Centre: 0–0.3 of the radius; margin: 0.7–1.0 | The middle of the dome against its edge, each by the median height |
| Strength of the dome: its gravity excess | The excess of the centre over the ring around it, from the gravity field |
The maria and their domes were fixed before the heights were read. This order matters: the areas could not be chosen, even unknowingly, to favour a sunken centre. For each mare the median height of the centre and of the margin was read from the laser altimetry, and the difference taken. The median, the middle value, is used rather than the mean so that a single crater or peak in the area does not move the result. The values are the table of §E.2 and Figure 4.
Centre against margin. Of the 12 open maria, 10 have a centre lower than the margin; the median difference is m. If centre and margin were equally likely to be the higher, chance would give about half, six of the twelve, with the centre lower; 10 or more of 12 would happen by chance about 2 times in 100 — as rarely as a fair coin falling heads 10 or more times in 12 throws. Strength against height. The rank correlation between the strength of the dome and the height of the centre is : the stronger the dome, the lower the centre, with a probability of chance of 4 in 100. Had there been no relation, the expected correlation would be near zero; a value as far from zero as would arise by chance in only 4 of 100 sets of twelve maria. Orientale, over the strongest dome (740 mGal), stands 2.2 km lower at the centre; Moscoviense (689) 1.1 km; Nectaris (538) 1.6 km. The exceptions. Serenitatis ( m) and Imbrium ( m), the two large maria of the contact. The buried maria, shown apart, are lower at the centre in 15 of 17, with a correlation of ; there the surface is the cover, and the difference includes the shape of the cover itself.
Result. The hypothesis is supported: the centre of a mare sank over its dense, iron-rich dome, and sank the more the stronger the dome. The two maria of the contact. Serenitatis and Imbrium froze close to the Earth. The Earth’s pull drew the near side outward; a mare that froze under that pull froze with its centre held up, and the centre did not sink afterwards. Serenitatis, which peeled away first (Paper 3), froze first, very close to the Earth, and was drawn outward the most ( m); Imbrium froze after detachment, as the Moon receded ( m). The maria farther from the contact froze when that pull no longer held them, and their centres sank over their domes. The two exceptions are thus not noise in the test: they are the two maria the model places where the Earth’s pull was strongest, and they are the two that did not sink. Limitations. The test rests on 12 open maria; the height at the centre also carries the later landings and the shape of the floor before it froze. Three causes may lower the centre — the weight of the dense body, suction, and, in our view mainly, thermal expansion and contraction with heat and cold, which is stronger the larger the mass in diameter and depth — and the measurement does not choose between them (§E.3). Directions for further research. The sag computed for a cooling iron-rich body of the measured density: a body 20–30 km thick cooled by 300–450 K contracts enough to lower the centre by the measured amount.
E.3 Why the floor sinks
The feed dome froze into a dense body rich in iron and titanium. The centre stands over the deepest part of that body, and sank the most. Three causes may lower the centre — the weight of the dense body, suction, and, in our view mainly, thermal expansion and contraction with heat and cold, which is stronger the larger the mass in diameter and depth. The weight of the dense body presses on what lies beneath it; suction draws the floor down as the melt beneath withdraws; and a mass that swelled with heat shrinks as it cools, the more so the larger and deeper it is. The picture of the last is a pot of thick soup left to cool: the surface ends lowest where the soup beneath it was deepest. All three are to be tested; the measurements do not choose between them, and the paper does not. What the measurements do fix is the link: the depth of the sag follows the strength of the dense body beneath each mare (§E.2).
A reader trained on the literature will note that the load of a mascon is also expected to bend the floor down at the centre (§E.2, Study 5, step 2). The two readings agree on the shape, a centre sunk over a dense body with its margins stretched and its interior squeezed. They differ on what the dense body is: in the literature, basalt fill over mantle lifted by an external event; in the model, the frozen feed dome itself, through which the opening was fed. The shape of the floor is common to both; what the model adds is the body beneath, and Part D has shown that body also under 44 openings that carry no basalt at all.
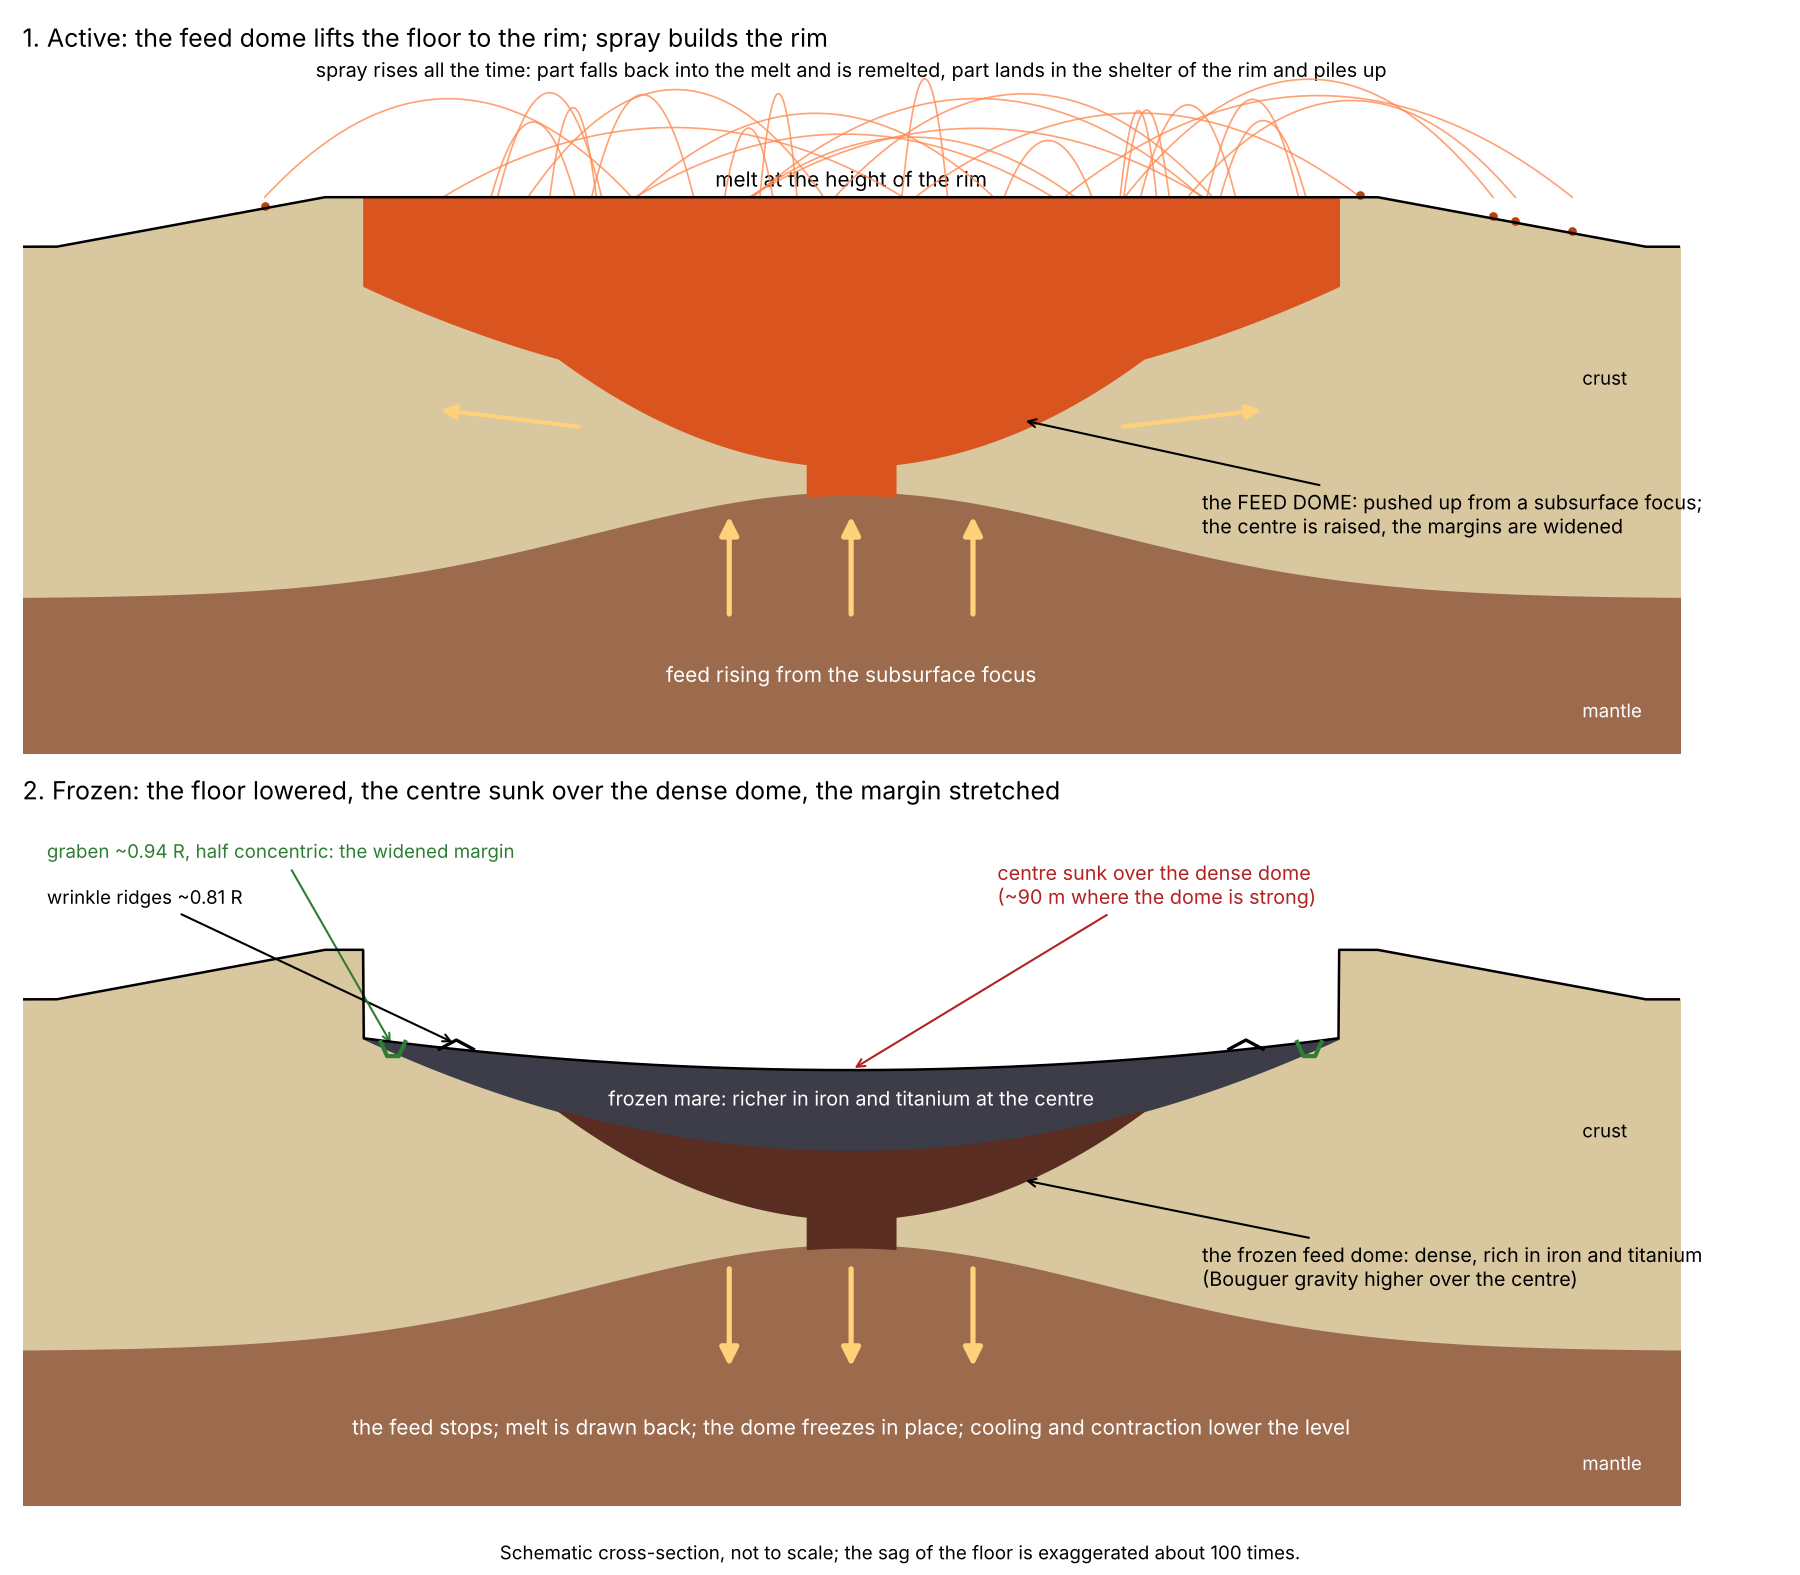
Figure 5 is a cross-section through one mare, read from top to bottom as a sequence in time. In the upper panel, the active stage, follow the arrows: the feed rises from the subsurface focus, pushes the dome up, and spreads the margins sideways; the melt stands level with the rim, and the spray thrown from it falls partly back into the melt and partly on the rim, where it piles up. In the lower panel, the frozen stage, the arrows point down: the feed has stopped, the dome has frozen into the dense body that gravity sees today, and the floor above it has sagged, deepest at the centre, with graben opened near the edge and wrinkle ridges squeezed further in. The sag is drawn about a hundred times deeper than it is, so that it can be seen at all.
What we now have: each mare stands over a dense feed dome; the floor of each open mare sank over its dome, the more the stronger the dome; and the only two that did not sink are the two maria of the contact, which froze close to the Earth and under its pull — Serenitatis first, Imbrium after detachment.
The floor, the floors and the last scatterer
if a mare froze as a lake, its floor must be one surface. The approach: the 646 units were measured for the levels, the rims and the small craters of their floors, and the floors compared with each other.
Part E went beneath the mare, to the feed dome, and found that the centre of a mare sank over its dense, iron-rich dome — by its weight, by suction or, mainly in our view, by thermal contraction, still to be tested — except at Serenitatis and Imbrium, the two maria of the contact, whose centres stand slightly raised. This Part comes back up to the surface the dome left behind: the floor. It asks three questions in turn. First, what shape is the floor — one surface or many, and how does it stand against its rim, the land around it and the basalt plains beside it (§§F.1–F.4)? Second, how many craters does it carry against the land around it (§F.5)? Third, which source made the craters it did gather, and what do they tell of the order in which the floors froze (§F.6)? The thread joining the three is simple: an opening that is still active melts or swallows whatever lands on it, so its floor begins to keep a record only when it freezes. The shape of the floor tells how it froze; the craters on it tell when.
Two words are used throughout. The floor of a mare is the basalt that lies within the core of the feed dome beneath it — the frozen surface of the opening itself. A buried mare is an opening that sealed and whose surface was later covered by the layers that built the far side, sial and returning material (Part D); it has no exposed floor of its own. An open mare is one whose floor is still exposed.
F.1One floor
Why a frozen lake is level. A liquid at rest under gravity cannot hold a slope: any part that stands higher flows down until the whole surface lies at one level, as the surface of a lake does. If it then freezes while still at rest, it keeps that one level. A floor built instead of many flows, laid at different times and frozen one by one, would show several levels — terraces or steps where one flow ends against another. The number of levels on a floor is therefore a direct test of how it formed. The model proposes that each mare floor is the top of one body of melt in the opening, which froze in place; it should show one level. And because the material that came out of the opening built the ground around it (§F.3), and the centre afterwards sank over the dome (Part E; by its weight, by suction or, mainly, by thermal contraction), the frozen level should lie below the rim and below the land around it, with its lowest part inward of the wall rather than against it.
How the floors were measured. The floor of each mare — the basalt within the core of the feed dome beneath it — was read on the global elevation model for the 16 maria whose floor covers 5,000 km and more: the 12 open maria, Humboldtianum (partial), Ingenii and Apollo over South Pole–Aitken, and Schiller–Zucchius, whose buried dome, 909 km across, still holds about 11,000 km of basalt; the other buried maria carry no floor to read. The elevation model is SLDEM2015 [S7], which joins the heights measured by the laser altimeter of the Lunar Reconnaissance Orbiter (LOLA) — an instrument that times a laser pulse down to the surface and back — with the stereo images of the Japanese SELENE Terrain Camera, giving one height map of the whole Moon. For this survey it was read on a grid of about 7.6 km (the limitation of Study 6 below), which is fine enough for these floors: a floor of 5,000 km, the smallest admitted, is about 80 km across, some ten cells. The outline of the basalt is taken from the LROC mare map [S1], and the outline of the core from the feed domes of Appendix A. On each floor the overall tilt was removed and the heights of all its cells were gathered into one distribution; a floor of one level gives one peak, a floor of several flows at several heights gives several. The rim, the land and the plain were then each read from the same height map by the rules set out in Study 6.
| Measured | Result |
|---|---|
| Levels within a floor | one level in 16 of 16; in the finer survey of all mapped units, one level in 188 of 189 |
| The floor against its rim | below it in 16 of 16, by a median of 3.4 km |
| The floor against the land around | below it in 16 of 16, by a median of 1.6 km |
| The lowest part of the floor | at a median of 0.57 of the radius; next to the wall in none |
The table gives the four answers, one per row. Every one of the 16 large floors shows a single level, and so do 188 of the 189 smaller mapped units of the finer survey. Every floor lies below its rim and below the land around it. Its lowest part lies, in the median, a little more than half way from the centre to the edge of the core (0.57 of the radius, where 0 is the centre and 1 the edge of the core) — and never against the wall.
A mare floor is one surface, frozen at one level, as a lake freezes. It lies well below its rim and below the land around it, and its lowest part lies inward of the wall, where the centre sank over the dome (Study 5).
Two depths, and how the numbers of this paper relate. The rim is the crest of the ground around the opening — the highest twentieth of the heights in a ring from 1.0 to 1.5 radii; the land is the ground beside the opening as a whole, without basalt, out to 300 km. They are two different references, and the floor stands below the first by a median of 3.4 km and below the second by a median of 1.6 km. The depth below the rim appears in two forms in this paper: as the measured median, 3.4 km (here and in the abstract), and as “about 3 km”, that median rounded (the opening box, §A.1 and §O.1); over the 16 floors it ranges from 0.9 km (Copernicus H) to 6.2 km (Moscoviense), with a mean of 3.3 km. (An earlier version gave “about 2 km” in §A.1 and §O.1; no measured depth below the rim is that small in the median, and 2 km is closer to the depth below the land, whose mean over the 16 floors is 2.0 km.) The 1.6 km below the land is a separate quantity, measured against a different reference.
Why 16 of 16 matters. If a floor were as likely to stand above its rim as below it, the chance that all 16 fall below by accident is one half multiplied by itself 16 times: 1 in 65,000 (Study 6). The same holds for the land. The result is therefore not a chance arrangement of a few maria but a property of every large floor.
The maria of the contact are shallow. The contact is the region of the Moon that last touched the tip of the Earth’s pear, the last 3,000 km of the tip (Paper 3); its maria are Imbrium, Serenitatis, Sinus Aestuum and Copernicus H. The maria beyond the contact lie outside it. A plain is basalt outside every mare: ordinary crust melted in place while the body was attached, with no feed dome and no channel to depth beneath it (§C.2). Set against the plain of basalt beside it, a mare of the contact lies at or near its level, and the large basins beyond the contact lie deep below it. The table gives every mare for which a plain could be read:
| Mare | Floor against the plain beside it | Step at the edge of the dome |
|---|---|---|
| The contact | ||
| Copernicus H | m | 44 m |
| Sinus Aestuum | m | 5 m |
| Imbrium | m | 94 m |
| Serenitatis | m | m |
| Beyond the contact (hill and beyond) | ||
| Ingenii | m | m |
| Crüger–Sirsalis | m | |
| Poincaré | m | 43 m |
| Schiller–Zucchius | m | |
| Grimaldi | m | |
| Humorum | m | m |
| Apollo | m | 6 m |
| Nectaris | m | m |
| Humboldtianum | m | |
| Crisium | m | m |
| Smythii | m | |
| Orientale | m | |
| Moscoviense | m | |
| Mendel–Rydberg | not measurable | |
The plain: basalt outside every mare, within 300 km of the edge of
the dome. The step: the floor within 0.85–1.0 of the radius against the
plain at 1.0–1.15, where both rings hold enough pixels.
Moscoviense:
from only 21 pixels of plain. Mendel–Rydberg: one pixel of plain.
Colour: blue where the floor stands above its plain, red where it lies
below, deeper with the depth.
The table has two blocks, the contact above and the maria beyond it below, each ordered from the floor standing highest to the floor lying deepest; the colour goes from blue, a floor above its plain, to deepening red, a floor below it. The middle column gives the floor against the plain; a plus sign means the floor stands above it. The last column looks only at the edge of the dome: it compares the floor just inside the edge (0.85–1.0 of the radius) with the plain just outside it (1.0–1.15), so that a wall or a drop at the edge would show as a large step.
The floors of Sinus Aestuum, Copernicus H and Imbrium stand at the level of the plains beside them — within a few tens to a few hundreds of metres — and no step marks the edge of the dome: 5 to 94 m, small against the kilometres of the maria beyond. Where floor and plain meet at one level with no step, the two were liquid together and froze together; this is what the model expects of the contact, where the maria were fed to the end beside plains that were themselves melted. Beyond the contact the picture divides by size. Of the 13 maria with a measurable plain, 9 lie below it, with a median of km. The six large, deep basins — Nectaris, Humboldtianum, Crisium, Smythii, Orientale and Moscoviense, the last from only 21 pixels of plain — lie one to two kilometres below the plains around them (1.0–2.2 km). Humorum and Apollo lie about half a kilometre below; Grimaldi, Poincaré, Crüger–Sirsalis and Schiller–Zucchius lie within 0.2 km of their plain; Ingenii, over South Pole–Aitken, stands 2.1 km above it. The earlier table of this section showed only the five large basins, under the words “a mare beyond the contact lies deep below it” (an earlier version); the full set says that the depth below the plain belongs to the large basins and not to the small maria. Serenitatis lies lower than the plains beside it: its margins are not a plain but a ring of spray from its slight popping during the peeling of the contact; it did not eject material of substance (§F.3).
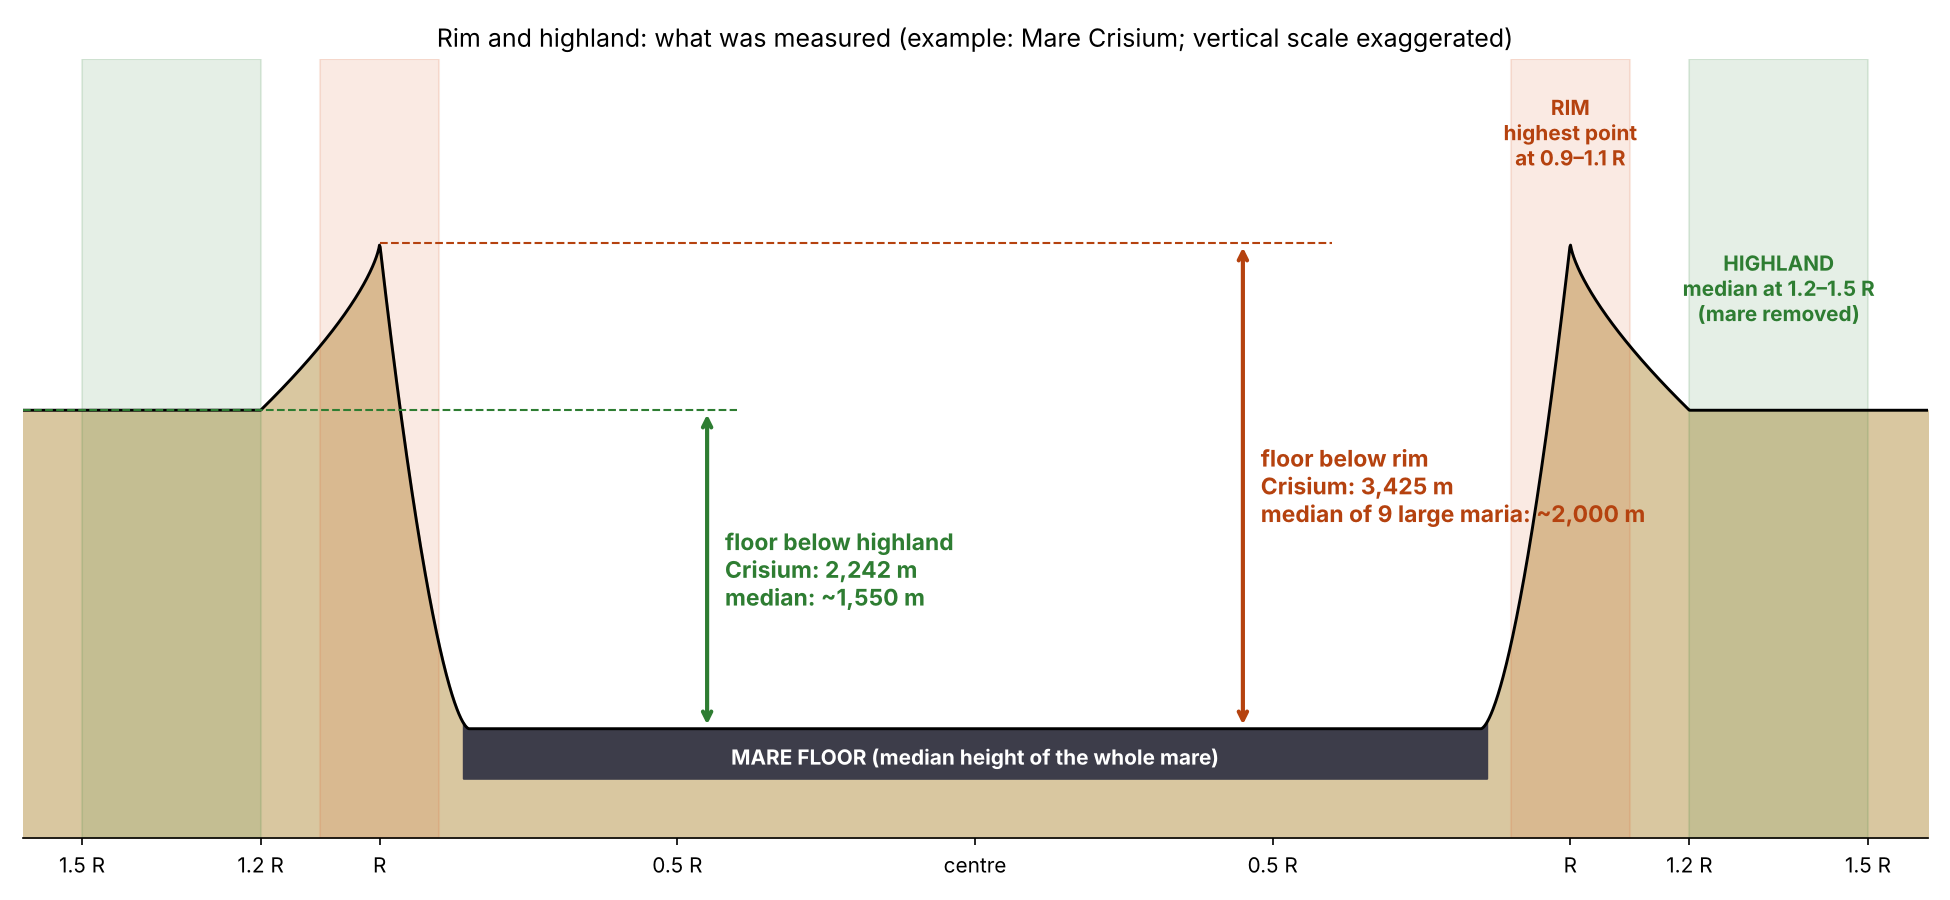
Figure 6 shows the same result for each large mare in turn: the height of its floor beside the height of its rim and of the highland around it. In every case the floor is the lowest of the three. What we now have: each floor is a single frozen level, set below its rim and its land, sunk at the centre except at Serenitatis and Imbrium, the two maria of the contact, whose centres stand slightly raised (Part E); at the contact it stands at the level of the melted plains beside it; beyond the contact the large basins lie far below them, the small maria near their level.
F.2Margins stretched, interior squeezed
Two kinds of feature cross the mare floors. A wrinkle ridge is a low, winding rise where the surface was pushed together and buckled; a graben is a long, narrow trough between two parallel faults, where the surface was pulled apart and a strip dropped down. Their positions tell where the floor was squeezed and where it was stretched. Positions are given as fractions of the radius of the core of the dome: 0 at the centre, 1 at the edge of the core, more than 1 outside it.
On the mapped units of the maria the wrinkle ridges lie at 0.71–0.77 of the radius and the graben at 0.76–1.22: the margin was stretched as the centre sank, and the interior squeezed into ridges. The picture is a sheet of ice on a pond whose water drops beneath its middle: as the middle sags, the ice is pulled apart near the shore and pressed together toward the centre. No moat runs along the walls: the lowest part of every floor lies inward of 0.9 of the radius. A moat — a trough along the foot of the wall — would mean that the floor sank most at its edge; the floor sank most near its middle, over the dome.
The measurements of §§F.1–F.2 form one study, set out below in the seven steps used for every study of this paper.
The phenomenon. Mare floors are smooth and dark, edged with graben and crossed by wrinkle ridges. The gap in knowledge. Whether a mare floor is one surface at one level, how it stands against its rim, the land around it and the plains beside it, and where its lowest part, its cracks and its ridges lie, has not been read together on the maria defined by their feed domes. The research question: is each mare floor one level; how does it stand against its rim, the land around it and the plains beside it; and where do its lowest part, its graben and its ridges lie?
The graben at the margins and the ridges in the interior are read as the flexure of the floor under the load of its basalt [S21]: the weight of the basalt bends the floor down in the middle, as a plank sags under a load. The basalt is read as many flows, of different ages, laid one on the other [S15], and the maria and the plains of the near side as one kind of surface. What is new here: the floor is the basalt over the feed dome, read against its rim, its land and the plain beside it, and the maria of the contact are set apart from those beyond.
A mare floor froze as one surface, as a lake freezes, below its rim; its centre sank over the dome, so its lowest part lies inward of the wall; the margin was stretched and the interior squeezed. The maria of the contact were fed to the end beside plains that were themselves melted, and froze at their level; the maria beyond the contact lie deep below the ground around them.
Type of research: quantitative, measuring heights and positions on maps. The sample: the 16 maria of Appendix A with a floor of 5,000 km and more; the 189 mapped units of 1,000 km and more for the finer count of levels. The tools: the LROC mare map [S1], the laser altimetry [S7], the feed domes of Appendix A, and code that reads levels, heights and positions inside each floor. The table below gives each rule of the measurement and, beside it, what it is meant to capture.
| Rule | Why, in plain words |
|---|---|
| The floor: basalt within the core of the dome | The surface of the opening itself |
| Levels: peaks of the height of the floor with its tilt removed | A floor of several flows at several heights shows several peaks |
| The rim: the highest twentieth of the ground at 1.0–1.5 radii | The crest of the ground around the opening |
| The land: ground without basalt within 300 km of the edge | The ground beside the opening |
| The plain: basalt outside every mare within 300 km of the edge | The melted crust beside the opening |
Each floor was read for the number of its levels, its median height, the height of its rim, its land and the plain beside it, the step at the edge of its dome, and the position of its lowest twentieth. The values are the tables of §F.1.
One level. All 16 floors show one level, as do 188 of the 189 mapped units. Below the rim and the land. All 16 floors lie below their rim, by a median of 3.4 km, and below their land, by a median of 1.6 km; 16 of 16 by chance, if each were equally likely either way, is 1 in 65,000. The lowest part. It lies at a median of 0.57 of the radius, and in no floor beyond 0.9. Against the plain. Three of the four maria of the contact lie within 254 m of the plain beside them, with steps of 5–94 m at the edge of the dome; Serenitatis lies 842 m below. Beyond the contact 9 of the 13 maria with a measurable plain lie below it (median km): the six large basins by 1,058–2,200 m, Humorum and Apollo by about 500 m, while Grimaldi, Poincaré, Crüger–Sirsalis and Schiller–Zucchius lie within 0.2 km of their plain and Ingenii stands 2,144 m above it. Graben and ridges. The ridges lie at 0.71–0.77 of the radius, the graben at 0.76–1.22.
Result. The hypothesis is supported: a mare floor is one surface frozen below its rim and its land, its centre sank, its margin was stretched and its interior squeezed; the maria of the contact froze at the level of the plains beside them, and beyond the contact the large basins lie deep below theirs. The part of the hypothesis that speaks of all the maria beyond the contact holds for the large basins and not for the small maria, which lie within about half a kilometre of their plains, Ingenii above its plain. Limitations. The elevation model used for the 34 maria resolves about 7.6 km, and a floor of one level does not by itself exclude many thin flows of equal level; the plains beside some far maria are few pixels; the positions of the graben and ridges are read on the mapped units, not on the dome cores. Directions for further research. The layering of the basalt from radar sounding, against one surface or many flows; the edge of the dome across the floors of the contact, traced at full resolution.
F.3The margins: layers of craters
§F.1 left one question open: why does the ground around a far mare stand so high above its floor? In the literature the high ground around a basin is its rim, raised by the event that dug it. The model reads it otherwise, as ground built up from outside by what the mare itself threw out.
Every mare overflowed, at one time or another, but not as lava over its rim: the basalt reaches 0–7% of the ring around the far maria (Moscoviense 1%, Orientale 1%, Smythii 3%, Nectaris 7%). If melt had spilled over the rim, the ground around would be basalt; it is almost none. What overflowed was the material that came out of the mare and landed around it. Near the mare it was hot and of low viscosity — viscosity is a liquid’s resistance to flow: honey is more viscous than water, and a hot melt flows more easily than a cool one. A landing smeared and did not keep the form of a crater, but it left its layer, as a spoonful of hot porridge dropped on a plate spreads out instead of holding a crater. Layer on layer, the returning material of the mare built its margins, and the ground around a far mare stands high. A crater builds its rim otherwise: the energy at its centre pushes material outward, and the push piles the rim. The maria of the contact were fed to the end and did not overflow; they lie at the level of their plains (§F.1). Serenitatis, though in the contact, lies below the ground beside it; it did not eject material of substance, and around it lies a ring of spray from its slight popping during the peeling.
If this is right, the ground around a far mare should rise as one moves out from the edge of the dome, reach a crest where the layers were thickest, and fall beyond it — a raised collar. Around the maria of the contact, which built no such layers, there should be none. The table measures exactly this.
| Ground without basalt, beyond the edge of the dome | 0–150 km | 150–300 | 300–600 | 600–900 | Collar |
|---|---|---|---|---|---|
| Far maria, buried (17) | 1,216 | 1,809 | 335 | 68 | |
| Far maria, open (10) | |||||
| Maria of the contact (4) | |||||
| Control, no mare near (170) |
Median heights, m. Collar: the ground at 150–300 km minus the
ground at 300–600 km. The control: points 450 km and more from the edge
of every dome and 300 km and more from any basalt, given the median core
radius of 150 km.
Each row is a group of maria, each column a ring of ground at a given distance beyond the edge of the dome, with basalt removed; the numbers are median heights. The last column, the collar, is the height of the second ring above the third: a positive collar means the ground is raised near the mare and falls away beyond. It is taken mare by mare and the median given, so it need not equal the difference of the two column medians. The red rows are the far maria, the deeper red those that are buried; the blue row the maria of the contact; the last row a control drawn from ground far from any mare, read in the same way, which shows what an ordinary stretch of the Moon gives by chance.
Around the far maria the ground rises from the edge of the dome to a crest at 150–300 km and falls beyond it: by a median of 742 m around the buried maria and 207 m around the open ones. Against the control, which gives 122 m, the buried maria stand clearly higher; the open far maria do not separate from it (Study 16). The buried maria show it most clearly because no later basalt covered their collar. Around the maria of the contact no such collar stands; the ground falls toward the mare all the way.
The phenomenon. The far maria lie deep below the ground around them, while the maria of the contact lie at the level of their plains (§F.1). The gap in knowledge. Whether the ground around a far mare is raised — built up by what came out of the mare — or whether the mare is simply sunk into ground of ordinary height, has not been measured against ground far from any mare. The research question: how high is the ground around a far mare, at each distance from it, against the ground of the same Moon far from any mare, and against the ground around the maria of the contact?
In the literature the ground around a basin is its ejecta and its rings, thrown out by the external impacting body and piled thickest at the rim, thinning outward; the crater’s own rim is uplifted and overturned by the outward push [S10]. What is new here: the margin of a mare is read as layers of the returning material of the mare itself, smeared on landing because it was hot, and the height of the ground is read ring by ring around every mare, with a control far from any mare.
The material that came out of a far mare landed around it hot, of low viscosity; each landing smeared and left a layer rather than the form of a crater, and the layers built a collar of raised ground around the mare. The maria of the contact were fed to the end and built no such collar. Hence: around the far maria the ground stands higher near the mare than farther out, more than around points far from any mare; around the maria of the contact it does not.
Type of research: quantitative; heights by ring, with a control group. The sample: the 31 maria of Appendix A with a feed dome; the control: 170 points on a grid of 4°, 450 km and more from the edge of every dome and 300 km and more from any basalt. The tools: the laser altimetry [S7], the LROC mare map [S1], the feed domes of Appendix A, and code that reads the median height of the ground without basalt in rings beyond the edge of the dome. The control answers the obvious objection — that the ground of the Moon rises and falls everywhere, so a “collar” could appear around any point — by measuring how large a collar ordinary ground shows.
For each mare the ground without basalt was read in four rings beyond the edge of its dome: 0–150, 150–300, 300–600 and 600–900 km. The control points were given the median core radius, 150 km, and read in the same rings. The first ring holds the slope of the rim down into the basin; the collar is the second ring against the third. The values are the table of §F.3.
The far maria. The collar stands a median of 471 m above the ground beyond it, positive around 20 of 27; against the control, a median of 122 m, the difference is significant (Mann–Whitney test, probability 0.009). The Mann–Whitney test ranks all the values of the two groups together and asks whether one group sits higher in the ranking than chance would allow; a probability of 0.009 means a difference this large would arise by chance less than once in a hundred trials. Around the buried maria it stands 742 m high, positive around 14 of 17 (probability 0.001 against the control); around the open far maria 207 m, positive around 6 of 10, not separated from the control. The maria of the contact. No collar: the ground at 150–300 km stands 137 m below the ground beyond, around all four.
Result. The hypothesis is supported: the ground around the far maria is raised in a collar, most clearly around the buried maria, whose collar no later basalt covered; the maria of the contact carry none. Limitations. The elevation model resolves about 7.6 km; the open far maria are few and their collar does not separate from the control; the ring of the collar was set at 150–300 km on the shape of the profiles, the slope of the rim filling the first ring; the far side stands high in general, which the control, drawn from the same Moon, only partly removes. Directions for further research. The layers themselves: smeared crater forms and stacked deposits in the collar, on images and radar, against the rims of large craters of the same size.
F.4 The floors by region
The floors differ in height not only from mare to mare but also by where they lie on the Moon. The table gives the typical floor height in four regions, named by the longitude at their centre: 90°W is the centre of the leading half (by the standard convention, the half facing the direction of the Moon’s motion along its orbit), 90°E the centre of the trailing half, 0° the middle of the near side and 180° the middle of the far side.
| Region | 90°W | 0° | 90°E | 180° |
|---|---|---|---|---|
| Floor height | km | km | km | km (South Pole–Aitken) |
Read the row from left to right: the floors deepen from the leading half to the trailing half. The far-side value is the floor of South Pole–Aitken, the deepest on the Moon, the subject of Paper 8. The floors of the leading half stand highest. They froze early: on the leading half the turning of the attached body carried the surface into the cold first.
F.5Craters on the floors
Until now the floors were read for their shape. From here they are read for the craters on them, which tell when each floor froze.
The floors are clean. “Clean” here has a precise meaning: a floor carries fewer craters per area than the land around it, at every crater size measured. The reason to expect it is the core of this paper’s picture. An open mare melts or holds what lands on it and keeps no craters on itself — as a pot of boiling soup keeps no mark of what is dropped into it; a floor gathers craters only after it froze. The land around, by contrast, kept every crater made on it from the time it was laid down. If the floors froze after most of the returning material had already landed, they must be far cleaner than their land; if they froze early, they would be as cratered.
The floor of each open mare — the basalt within the core of the feed dome beneath it — was compared with the land around it, out to 300 km beyond the core, the basalt removed from the land. Each mare is thus compared only with its own surroundings: it is its own control, so differences between regions of the Moon (the far side, for example, carries more craters in general) cancel. The fields of rays of 16 young craters were removed from both, each out to five crater diameters from its centre, so that the bright ground of a young crater is not counted on either side. The literature reads the rays of a young crater such as Copernicus as bright streaks of debris thrown far across the surface, with many small secondary craters; in the model a ray is a record within the ground beneath the surface, formed only where material landed on a floor that had already cooled (Further work, item 7). Either way, the ray fields are bright features with many small craters of their own; counting them on one side and not the other would make the comparison unfair, so they are removed from both alike. Ten of the open maria have a floor of 5,000 km and more outside the ray fields; Copernicus H and Sinus Aestuum lie wholly within the rays of Copernicus.
| Mare | Zone | Floor (km) | 1–2 km | 2–5 km | 5–10 km | Floor/ land, 2–5 |
|---|---|---|---|---|---|---|
| Imbrium | contact | 345,584 | 5,359 / 29,235 | 252 / 7,142 | 46 / 1,217 | 0.04 |
| Serenitatis | contact | 280,553 | 5,999 / 23,421 | 260 / 4,315 | 39 / 322 | 0.06 |
| Crisium | hill | 144,849 | 6,704 / 21,899 | 359 / 8,125 | 62 / 1,202 | 0.04 |
| Humorum | hill | 84,705 | 4,569 / 25,790 | 602 / 8,680 | 106 / 1,058 | 0.07 |
| Nectaris | hill | 71,817 | 18,408 / 29,508 | 2,409 / 12,085 | 111 / 1,404 | 0.20 |
| Smythii | hill | 41,365 | 4,883 / 30,275 | 774 / 13,034 | 435 / 1,354 | 0.06 |
| Grimaldi | hill | 16,693 | 3,894 / 23,850 | 719 / 7,019 | 120 / 1,058 | 0.10 |
| Orientale | beyond | 44,252 | 12,361 / 20,888 | 701 / 3,007 | 90 / 247 | 0.23 |
| Moscoviense | beyond | 23,092 | 7,405 / 34,399 | 2,468 / 14,974 | 650 / 2,431 | 0.16 |
| Poincaré | beyond | 15,397 | 6,624 / 20,579 | 1,299 / 12,798 | 779 / 2,323 | 0.10 |
Craters per million
km,
floor / land.
Each row is one mare, coloured by its zone: blue for the contact, amber for the hill (the base of the bulge, 6,000 km across, Paper 3), red for the maria beyond. Each size column gives two numbers, the density on the floor and the density on the land around it, both in craters per million km. The last column divides the first of these by the second for the craters of 2–5 km: 0.04 means the floor carries 4% of the craters its land carries. Look down that column: every value is far below 1.
Every floor is cleaner than its land at every size: of the craters of 2–5 km a floor carries 4–23% of the density of its land, a twelfth in the median; of 5–10 km, 4–36%, a ninth; of 1–2 km, 16–62%, a quarter. The maria of the contact are the cleanest floors of all, Imbrium and Serenitatis with about 250 craters of 2–5 km per million km. Which floors gathered more, and why, is read in §F.6.
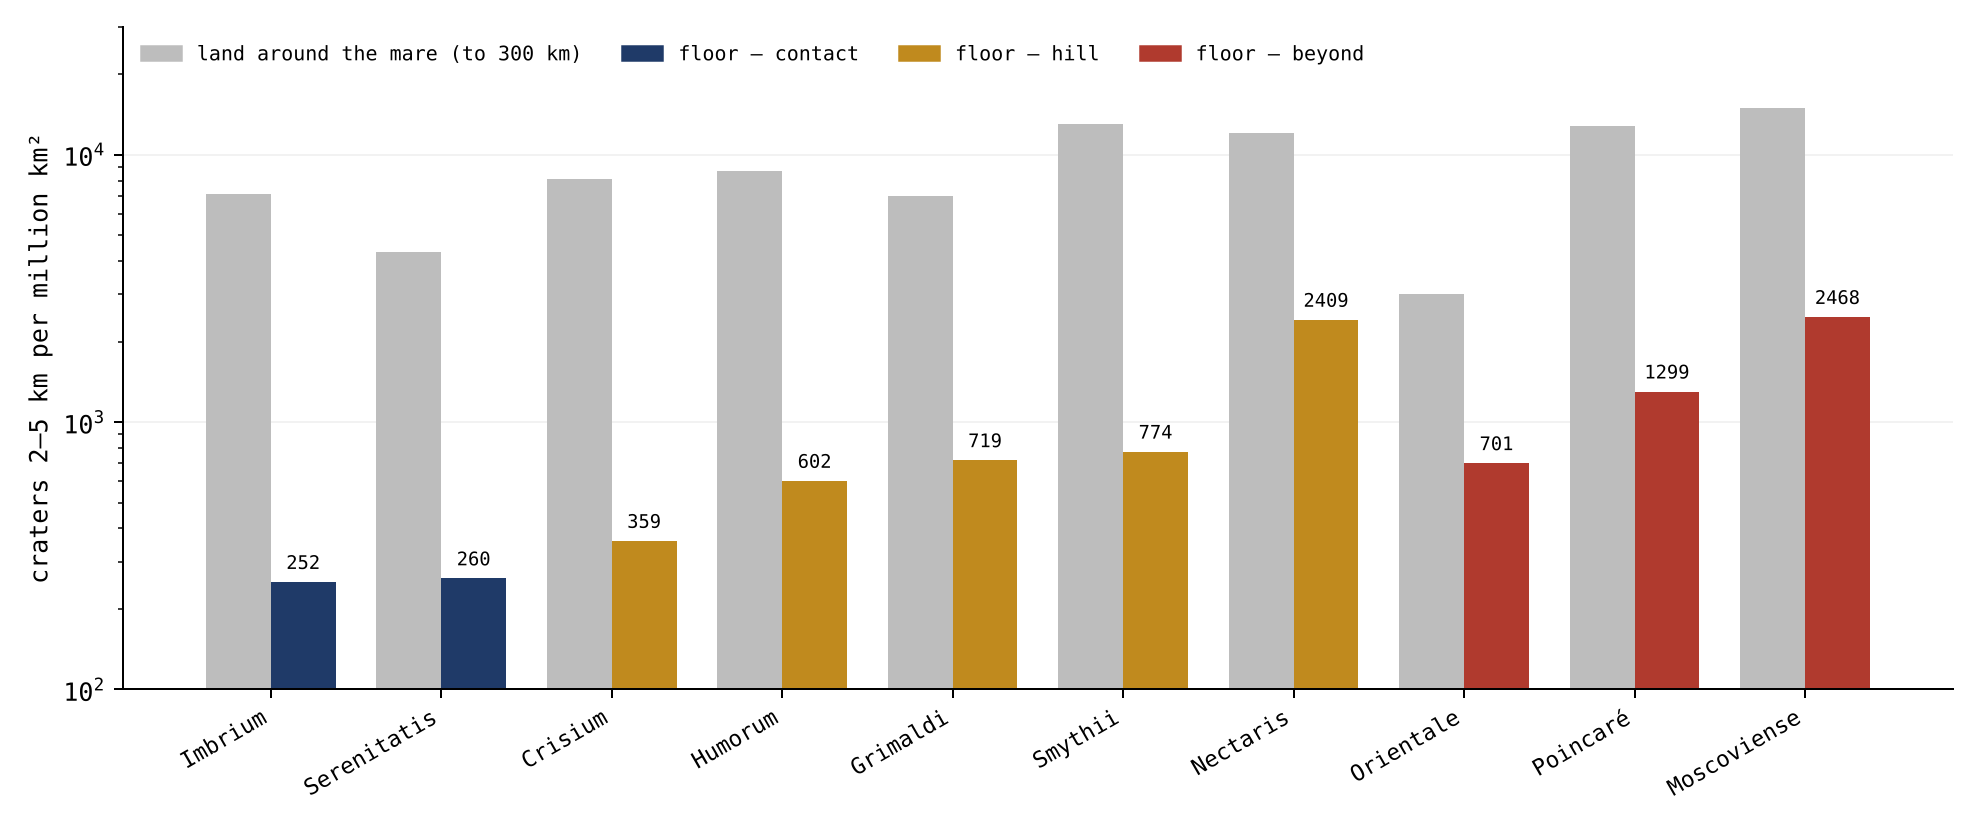
Figure 7 draws the 2–5 km column of the table as pairs of bars, the floor of each mare beside its land. The scale is logarithmic — each step up the axis is ten times the one below — because the floors and the land differ by more than ten times; on an ordinary scale the floor bars would barely show. In every pair the coloured bar stands well below the grey one, and the navy bars of the contact are the lowest of all.
The phenomenon. The floors of the maria look smooth beside the land around them. The gap in knowledge. An open mare melts what lands on it and keeps no craters on itself, so a floor gathers craters only after it froze; how few craters the floors carry against their own surroundings, mare by mare, has not been measured in one test. The research question: how many craters does the floor of each open mare carry, against the land immediately around it?
The small craters on the maria are read as the craters made on each surface since its last flow, and their density is used to date the flow [S15]; the highlands, older, carry more. What is new here: every floor is compared with the ring of land around it, so that each mare is its own control, and the floor is the surface over the feed dome, not the whole of the basalt. The two readings agree that a clean floor began to keep craters late; they differ in what set that start — in the literature the last flow of lava, in the model the freezing of the opening after the returning material had landed.
The floors froze after most of the returning material had landed; every floor is therefore far cleaner than its land, at every size.
Type of research: quantitative; densities compared, floor against land. The sample: the open maria of Appendix A with a floor of 5,000 km and more outside the ray fields, ten maria; craters of 1–2, 2–5 and 5–10 km on each floor and on the land around it. The tools: the Wang & Wu catalogue [S6], the LROC mare map [S1], the feed domes of the GRAIL field [S2], and code that counts craters per area. The rules below keep the comparison like for like: the same catalogue, the same sizes and the same removal of rays on both sides.
| Rule | Why, in plain words |
|---|---|
| The floor: basalt within the core of the feed dome | The surface of the opening itself |
| The land: no basalt, from the core out to 300 km beyond it | The ground the same returning material fell on |
| Rays of 16 young craters removed, to five diameters, on both sides | The ray field of a young crater is not part of either record |
For each mare the craters were assigned by their centres to the floor or to the land, and counted per million km of the area left after the ray fields were removed. The counts are the table of §F.5.
On all ten maria the floor is cleaner than its land at every size: the floor carries a median of 8% of the density of its land at 2–5 km (4–23%), 12% at 5–10 km (4–36%) and 24% at 1–2 km (16–62%). The cleanest floors are Imbrium (252 craters of 2–5 km per million km) and Serenitatis (260), the maria of the contact; the least clean are Moscoviense (2,468) and Nectaris (2,409).
Result. The hypothesis is supported: every floor is far cleaner than its land, at every size; the floors froze after most of the returning material had landed. Limitations. A crater on the edge of a floor is assigned by its centre; the smallest craters mix with secondaries; the list of young rayed craters removed is not complete; two maria of the contact could not be measured because their floors lie within the rays of Copernicus. Directions for further research. In what order the floors froze, read from the craters they did gather, is Study 12.
F.6 The order of freezing, and the last scatterer
§F.5 showed that every floor is clean; this section asks why some are cleaner than others, and who made the few craters they do carry. The last scatterer is the last source that threw the pieces which made the craters now on a surface. Knowing it matters, because the pattern of craters on the floors can be read as a clock only if the source that made them did not favour one mare over another.
The floors are clean, but not equally. The craters they carry were made after each floor froze, and the last scatterer that made them was the Earth: after release it went on throwing material, and part of it reached the Moon from all sides (Part G; Paper 6, Study 9). The sequence is this. At release the Moon left the Earth already round, its outer shell rigid; its flattening and rounding had taken place while it was still attached (Paper 7). The pear on which it had sat was not carried away with it: the sorting gathered it slowly back into the Earth over tens to hundreds of millions of years, and as it returned it left wrinkles in the Earth’s surface, the stripes of Paper 9. At release the pressure from the Earth stopped reaching the Moon, and with it the ejections from all the Moon’s openings; most openings of the far side had sealed long before, as the pear grew. The near-side maria, hot and of low viscosity, then froze slowly from the outside inward. The Earth’s own openings, however, did not stop. They went on throwing material, large pieces first while the Moon was close, small ones later as it receded, all of them hot (§§G.4–G.5). The Earth was therefore the last scatterer, and above all of the small craters on the frozen floors.
This is why the source matters for the reading. Material thrown by a mare of the Moon lands thickest near that mare, so it would leave more craters on the floors close to it than on the floors far away — a gradient toward one mare. Material from the Earth, arriving from all sides, has no such favourite on the Moon. No gradient toward one mare is then expected. Each floor gathered craters from the moment it froze, and the number of craters orders the floors by when they froze — as snow falling evenly on a set of tables, set out one after another, leaves the deepest layer on the table set out first. The maria of the contact, which froze last, are the cleanest. They froze last because they were the last to be fed: the contact was the last region of the Moon to let go of the Earth, Serenitatis, which peeled away first, froze first, very close to the Earth, and Imbrium, detached last, froze after detachment, as the Moon receded (Part E). The smallest pieces, of 1–2 km, are light and float far: they were scattered to every side, and the maria still active scattered small pieces of their own onto their neighbours, so that their spread over the floors is wide and their order by zone weak.
| Floors of the open maria | Contact | Hill | Beyond | Hill against contact | Beyond against contact |
|---|---|---|---|---|---|
| Area, km | 626,137 | 359,429 | 82,742 | ||
| 1–2 km | 5,646 | 8,194 | 9,910 | (1.0–2.0) | (1.2–2.4) |
| 2–5 km | 256 | 890 | 1,305 | (2.2–5.4) | (2.6–8.4) |
| 5–10 km | 43 | 128 | 375 | (1.7–5.2) | (3.5–17) |
| 10–20 km | 3.2 (2) | 53 (19) | 230 (19) | ||
| 20–40 km | 0 (0) | 39 (14) | 0 (0) | — | — |
| 40 km and more | 0 (0) | 14 (5) | 36 (3) | — | — |
| 10 km and more, together | 3.2 (2) | 106 (38) | 266 (22) | (at least 11.6) | (at least 25) |
Craters per million
km;
in brackets, the number of craters where it is small; 95% intervals by
resampling cells of 5° by 5°. The catalogue lists each large basin as a
crater of its own; these entries of 300 km and more, five of which have
their centres on the floors (Serenitatis, Nectaris, Humorum, Grimaldi
and Poincaré), are the maria themselves and are left out. An earlier
version counted them, and gave 1.6 (1), 22 (8) and 48 (4) at 40 km and
more, and 4.8 (3), 114 (41) and 278 (23),
and
for 10 km and more.
The table pools the floors of each zone: all the floors of the contact together, all those of the hill, all those beyond, each with its total area in the first row. Each following row is one crater size, from the smallest at the top to the largest; the blue deepens as the craters grow. The first three columns give the density on the floors of each zone; the contact column is in bold, as the cleanest. The last two columns give how many times more craters per area the hill and the beyond floors carry than the contact floors, with in brackets the range within which the ratio falls in 95 of 100 resamplings. To resample, the floors are cut into cells of 5° by 5°, the cells are drawn again at random many times, and the ratio is recomputed each time; because whole cells are drawn, craters that cluster together are kept together and do not narrow the range falsely. Read the ratio columns downward: from 2 km up the ratios grow with crater size, and for the craters of 10 km and more, together, the floors beyond carry eighty-three times the density of the contact floors (the basins’ own catalogue entries left out, as the note to the table explains).
The phenomenon. The floors are clean, but not equally (Study 7). The gap in knowledge. If the last scatterer is the Earth — which after release went on throwing material, part of which reached the Moon from all sides (Part G; Paper 6, Study 9) — no gradient toward one mare is expected; each floor gathered craters from the moment it froze. Whether the craters on the floors, small and large alike, order the floors by when they froze has not been tested. The research question: does the number of craters on each floor, at every size, order the floors by when they froze, with the maria of the contact, which froze last, the cleanest?
In the literature the craters on a flow measure the time since it was laid down, at a flux of bodies from outside nearly the same everywhere [S15]; the flows are dated one by one. What is new here: the floors are ordered by their distance from the contact, which in the model sets when they froze, and the density at every size from 1 km to the largest is read against that order. The order is fixed by the geometry of Paper 3 before any crater is counted, so the test cannot be tuned to the result.
The maria of the contact froze last; the farther a mare lies from the contact, the earlier it froze and the more craters it gathered, at every size from 2 km up. The smallest craters, of 1–2 km, made by light pieces scattered to every side and by the maria still active onto their neighbours, follow the order only weakly.
Type of research: quantitative; densities by zone, with intervals by resampling. The sample: the floors of the ten open maria of Study 7, ray fields removed; craters of 1–2, 2–5, 5–10, 10–20, 20–40 km and 40 km and more. The tools: the same catalogue, map and feed domes, and code that counts the craters of all the floors of each zone on their total area, with intervals found by resampling cells of 5° by 5°, so that clustering is allowed for.
Each mare was placed in its zone by the geometry of Paper 3: the contact, the last 3,000 km of the tip (within 1,500 km of 24.1°N, 335.2°E: Imbrium, Serenitatis); the hill, the base of the bulge, 6,000 km across (within 3,000 km of 16.6°N, 13.1°E: Crisium, Humorum, Nectaris, Smythii, Grimaldi); and beyond (Orientale, Moscoviense, Poincaré). The counts are the table of §F.6.
At every size the floors of the contact carry the fewest craters. From 2 km up the number rises zone by zone outward: by three to four times at 2–5 km from the contact to the hill and five times to beyond, by three and nine times at 5–10 km. Of the craters of 10 km and more, the floors of the contact, 626,000 km, carry two; the floors of the hill, 359,000 km, carry 38; the floors beyond, 83,000 km, carry 22, eighty-three times as many per area as the contact, and at least twenty-five times in 97 of every 100 resamplings (the catalogue entries of the basins themselves left out). Put plainly: the contact floors are the largest area of the three and carry the fewest large craters, while the small floors beyond, less than a seventh of that area, carry eleven times as many. Not one crater of 20 km and more lies on the floors of the contact; none of 20–40 km lies on the three small floors beyond. Of the craters of 1–2 km the order holds as well, but weakly: one and a half and nearly two times.
Result. The hypothesis is supported: from 2 km to the largest craters the floors are ordered by when they froze, the contact maria the cleanest, and the number of craters rises outward; the smallest craters, light and scattered to every side, keep the order only weakly. The Earth as the last scatterer needs no gradient toward one mare. Limitations. The distance from the contact stands in for the time of freezing and does not measure it; the list of young rayed craters removed is not complete; the large craters are few on every floor, so their ratios are wide. Directions for further research. The near-side excess of the small fresh craters on the land, which tests the Earth as the source directly (Paper 6, Study 9).
What we now have from Part F: each mare floor froze as one level, below its rim and its land, sunk at its centre except at Serenitatis and Imbrium, whose centres stand slightly raised; the far maria stand inside collars built of their own returning material; every floor is far cleaner than its land; and the few craters the floors carry, made last by material from the Earth, order the floors by when they froze, the maria of the contact last of all.
Size and state: the maria and the craters in time
the craters on the floors of the maria are not all in one state: some are melted, some smeared, some sharp, and the state follows the size. The approach: the state of every crater on the near-side mare floors is measured against its size, and read through the temperature and viscosity of the maria and of the arriving material, and through time. This part is shared by Papers 5 and 6: it belongs to the maria and to the craters alike. Its main study is numbered jointly with Paper 6: it is Study 8 in this paper and Study 5 in Paper 6.
The previous parts treated each mare as an opening over a feed dome, and its floor as the frozen surface of the melt that stood in that opening. A frozen floor is also a surface that receives craters, and the craters it carries tell how soft it was when they arrived. This part reads that record. By size and state we mean two properties of each crater set side by side: its diameter, and how well it has kept its form. A crater is sharp when it is as deep as, or deeper than, a fresh highland crater of the same diameter, with a standing rim and an open bowl; smeared when its rim still stands but its floor is partly filled and its walls are softened, so that it is noticeably shallower than a highland crater of its size; and melted when little more than its ring is left, the floor filled up to nearly the level of the surrounding plain. The question is simple: does the state of a crater depend on its size, and if so, what does that say about when the floors of the maria were still soft?
The part runs in seven steps. Section G.1 shows the three states side by side on one mare. Section G.2 measures the state of every crater of 3 km and more on the near-side basalt against its size (Study 8). Sections G.3 and G.4 give the two causes the model reads in the result: the cooling of the maria, and the change of the material that kept arriving from the Earth after release. Section G.5 joins the two into one sequence in time. Section G.6 turns to the large craters of the plains of the contact, whose rims were worn from below (Study 15), and G.7 states what the part shows.
Throughout, the contact is the last 3,000 km of the Moon’s base on the Earth, the disc where the Moon last touched the Earth, centred today at 24.1°N 335.2°E (Paper 3, §B.4); beyond the contact is the rest of the near-side basalt. A floor of a mare is the basalt over the core of a feed dome (Appendix A); a plain is basalt without a feed dome beneath it, such as Procellarum or Tranquillitatis.
G.1Three states on one floor
Before measuring thousands of craters it helps to see the three states on one surface. The yardstick is the depth-to-diameter ratio, the depth of a crater divided by its width. Fresh craters of a given size have a typical ratio, so a crater much shallower than its highland neighbours of the same size has been filled or worn, and one as deep or deeper has kept its form.
Within Mare Imbrium three craters show three states. Sinus Iridum, 246 km, is melted in half: its northern rim stands as the Jura Mountains, its southern half is gone, and its floor is the floor of the mare; its depth is a quarter of that of a highland crater of its size (depth-to-diameter 0.008 against 0.034). Seen from above it is a bay: an arc of mountains open toward the mare, with the mare’s own smooth surface running in where the southern rim would have been. Plato, 101 km, on the northern shore, kept its rim, but its floor is filled and smooth: it is smeared, at 0.020 against 0.034, a little more than half the depth of a highland crater of its size. Its ring of walls is complete, but inside it lies a flat, dark floor instead of a bowl. Kirch, 11 km, on the floor of the mare, is sharp, deeper than the highland craters of its size (0.166 against 0.078): a clean bowl with a crisp rim. The large crater is melted, the middle one smeared, the small one sharp.
The three stand on or beside the same mare, so differences of place, latitude or of the ground beneath cannot explain them. What differs is the size, and with it, as the following sections show, the time at which each arrived.
G.2The state of the craters by size
Two kinds of melting. A crater that landed on an active mare could be melted in two ways. Melted and vanished: it landed, melted, spread and disappeared while the mare was active, merging with the material of the mare; no body is left beneath the surface, at most remnants, and no ring; it is absent from every catalogue, and is seen only as the deficit of craters on the floors. Melted to a ring: it lost depth, its floor filled, and only its ring is seen; it is in the catalogue as a crater far shallower than a highland crater of its size. In this part melted alone means a crater melted to a ring, still seen; vanished means a crater melted and vanished. The distinction matters because the two are counted in different ways: a melted crater is counted by its state, a vanished one only by its absence, as a shortfall against a surface that kept its craters.
The measurement. Every crater of 3 km and more on the near side whose centre lies on basalt was taken from the catalogue of Wang & Wu [S6], with its depth from the global elevation models, and assigned to the floor of a mare — within the core of the feed dome beneath one of the maria of Appendix A — or to a plain. Its depth-to-diameter ratio was compared with that of the highland craters of the same size, latitude within 60°, basalt removed from the highland sample. Shallower than 95% of the highland craters of its size, a crater is melted: only its ring is seen. Shallower than 75% of them, it is smeared. The rest are sharp. Of the 3,478 craters, 324 lie on the floors of the maria and 3,154 on the plains.
The comparison is made size by size for a reason. Large craters are naturally shallower for their width than small ones, so a single depth threshold would call every large crater filled. Comparing each crater only with highland craters of its own size removes that effect: a crater is called melted only if it is shallower than almost every highland crater of the same diameter. The highland craters are the control because the highland was solid when they formed and has no basalt in it.
The craters that vanished. Like for like, within the contact and beyond it, the floors of the maria carry fewer craters than the plains at every size:
| Where | Surface | 2–5 km | 5–10 km | 10–20 km | 20–40 km | 40+ km |
|---|---|---|---|---|---|---|
| Contact | floors of the maria | 263 | 44 | 4.6 | 0 | 0 |
| Contact | plains | 836 | 129 | 37 | 23 | 14 |
| Beyond the contact | floors of the maria | 983 | 119 | 65 | 34 | 28 |
| Beyond the contact | plains | 2,107 | 293 | 145 | 90 | 68 |
Craters per million
km,
near side, ray fields of young craters removed. The catalogue entries of
the basins themselves (300 km and more) are left out, as in §F.6; an
earlier version counted them and gave 1.5, 40 and 69 in the last column
(the 1.5 was the entry of the Serenitatis basin).
The table is read in pairs of rows: each floor row (blue) against the plain row beneath it, in the same zone. The numbers are densities, craters per million km, so surfaces of different area can be compared directly; the bright rays of young craters were removed so that their secondary craters do not inflate any count. The darker blue marks the floors of the contact, where the shortfall is deepest. Within the contact the floors carry about a third of the small craters of the plains beside them (263 against 836 at 2–5 km), and the shortfall grows with size, to none at 20–40 km against 23 on the plains. Beyond the contact the floors carry about half of what the plains carry, at every size. Both surfaces are basalt on the same side of the Moon, exposed to the same arriving material; the floors lost craters that the plains kept. These are the vanished craters.
The state follows the size. On the floors of the maria, the craters that remain:
| Size | Craters | Sharp | Smeared | Melted |
|---|---|---|---|---|
| 3–5 km | 201 | 71% | 12% | 17% |
| 5–10 km | 74 | 57% | 14% | 30% |
| 10–20 km | 26 | 35% | 12% | 54% |
| 20–40 km | 13 | 0% | 15% | 85% |
| 40–80 km | 7 | 14% | 43% | 43% |
| 80 km and more | 3 | 0% | 0% | 100% |
The colours show the direction. Read down the table, from small craters to large: the blue of the sharp column fades, from 71% of the craters of 3–5 km to none of 20–40 km, and the red of the melted column deepens, from 17% to 85% and to all three craters of 80 km and more. The smeared share stays near one in eight until the large sizes. The row of 40–80 km, with only seven craters, breaks the trend slightly; the last two rows rest on ten craters together and are shown for completeness.
Why does a melted share that rises with size tell when the floor was still soft? A crater’s final state is set by the floor it lands on, not by its size alone: the size effect has already been removed by comparing each crater with highland craters of its own size. If all sizes had arrived on the floors at the same time, they would have met the same floor and would show the same mix of states. They do not: the large are mostly melted, the small mostly sharp. The large therefore met a softer floor than the small, which means they arrived earlier, while the mare was still liquid or mushy, and the small arrived later, when it had frozen. The size of a crater on a mare floor thus acts as a clock of the floor’s state; Sections G.3–G.5 explain why the two run together.
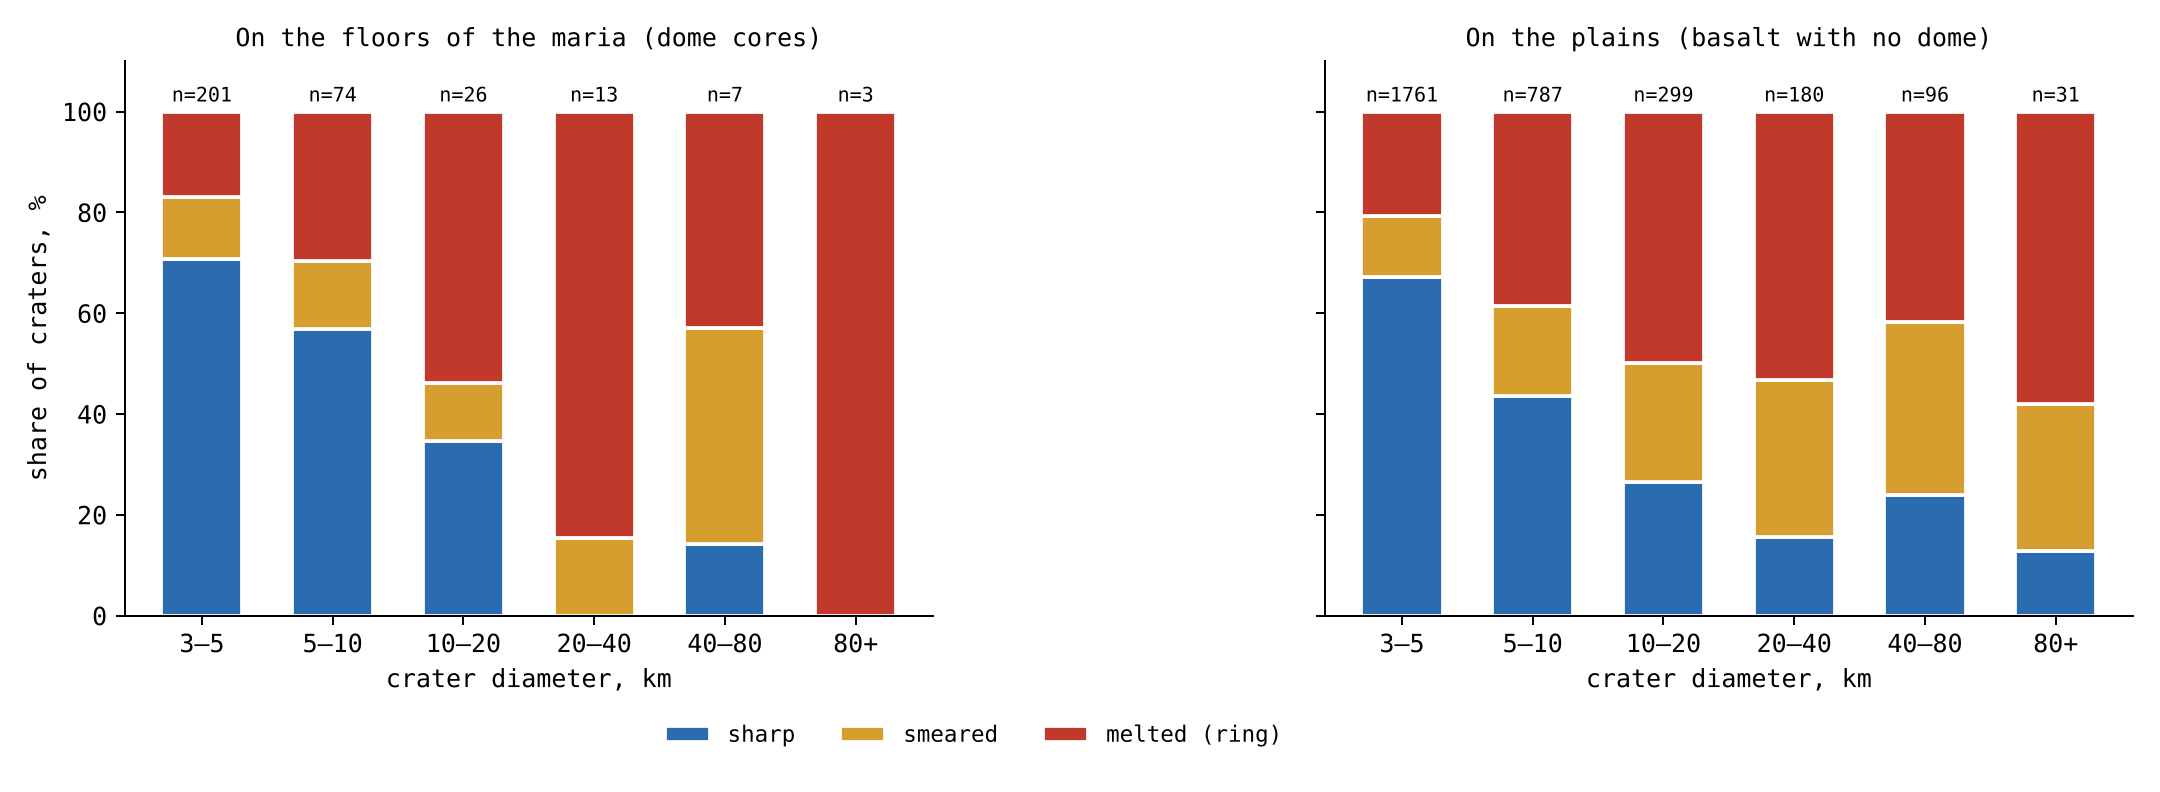
Figure 8 shows the same classification for each size bin, on the floors of the maria and on the plains, with the three states in the colours of the table. On the floors the red of the melted craters grows toward the large sizes, while the blue of the sharp craters shrinks. The plains are shown beside the floors so that the two surfaces can be compared at a glance; the difference between them in the number of craters is the subject of the density table above.
The small craters on the contact. On the floors of the maria within the contact disc (1,500 km of its centre; this takes in also the edge of the floor of Humorum), 82% of the craters of 3–10 km are sharp and 9% melted; on the maria beyond the contact, 56% and 28%. On the floors of the maria of the contact there is no crater of 40 km and more, and only three of 10–40 km, all sharp.
The maria of the contact were the last to freeze (§G.3): they lay where the Moon last touched the Earth, were fed the longest and are the deepest — deepest in the body of the mare itself, inward, not in the height of its floor (§G.3). Any large crater that landed on them while they were liquid melted and vanished, and so did most small ones of that time. What is left on their floors is what arrived after they froze: small pieces, which made sharp craters on solid ground. The contact maria therefore carry fewer craters than the others, and a larger share of those they carry is sharp. Their sharp small craters are not a sign that they are old and untouched; they are the late arrivals from the Earth, landing on a floor that had only just become hard.
The phenomenon. On the floors of the maria some craters are melted to a ring, some are smeared, and some are sharp (§G.1); and the floors carry few craters. The gap in knowledge. Whether the state of a crater on a mare floor follows its size, and whether craters vanished into the floors of the maria while the plains kept theirs, has not been measured on all the craters against a control of the same size. The research question: do the floors of the maria carry fewer craters than the plains, like for like; does the share of melted, smeared and sharp craters on the floors change with size; and how do the craters on the floors of the contact differ from those beyond?
Craters on the maria partly flooded by later basalt have long been used to measure the thickness of the basalt: a crater whose rim still stands above the flow tells how deep the flow is [S16]. The flows are dated by crater counts on top of them [S15]. The viscosity of the mare basalts was measured on returned samples [S14]. In that reading, the state of a crater follows the thickness of the later flows, and the maria and the plains are one kind of surface. What is new here: the floors over the feed domes are set apart from the plains, and all the craters of 3 km and more are classified by one rule against highland craters of their own size.
The large pieces arrived in the time when the maria were active; on an active mare they melted, many of them spreading and merging with the material of the mare until they vanished, others left as rings. The small pieces arrived at the end of the storm of the melt, when most maria had frozen, and stayed sharp. Hence: the floors of the maria carry fewer craters than the plains at every size, within the contact and beyond it; on the floors the share of melted craters rises with size and the share of sharp craters falls; and on the maria of the contact, the last to freeze, the large craters are gone and the few craters that remain are sharp, late arrivals from the Earth.
Type of research: quantitative; densities and states compared across surfaces, sizes and zones. The sample: the 3,478 craters of 3 km and more on the near-side basalt, 324 on the floors of the maria and 3,154 on the plains; for the densities, all the craters of 2 km and more on the same surfaces, ray fields removed; the control: highland craters of the same sizes, latitude within 60°, basalt removed. The tools: the Wang & Wu catalogue [S6] with its depths, the LROC mare map, the feed domes of Appendix A, and code that classifies each crater by the rule of §G.2.
The rule was set on the highland craters alone, size bin by size bin, before any crater on the basalt was classified, so that the lines between the classes could not be tuned to the result. Each crater was then classified, assigned to a mare floor or a plain, and its distance from the centre of the contact (24.1°N, 335.2°E) recorded. The counts are the tables of §G.2.
Vanished. Within the contact the floors of the maria carry a third of the craters of 2–5 km of the plains, an eighth of those of 10–20 km, and none of 20–40 km against 23 per million km; beyond the contact, about half at every size. The change with size. A test for a steady trend across ordered groups (the Cochran–Armitage test, which asks whether a share rises or falls steadily from one size bin to the next rather than wandering at random) gives, on the floors of the maria, a rise of the melted share and a fall of the sharp share with size, each with a probability below one in ten billion of arising by chance; crater by crater, the larger the crater, the shallower it is against the highlands (rank correlation ; a rank correlation measures whether one quantity tends to fall as the other rises, from for a perfect fall to for a perfect rise). The contact. Of the craters of 3–10 km, 93 of 113 on the floors of the contact are sharp against 91 of 162 beyond (Fisher’s exact test, which gives the exact probability of so uneven a split between two groups if both had the same true share: about 5 in a million); no crater of 40 km and more lies on the floors of the contact, and the three of 10–40 km are sharp.
Result. The hypothesis is supported: on the floors of the maria craters melted and vanished, merging with the material of the active mare, while the plains kept theirs; the state of the craters that remain follows the size, melted for the large and sharp for the small; and on the maria of the contact, the last to freeze, the large craters are gone and the craters that remain are sharp. Limitations. The depth of a small crater is less well measured than that of a large one; the classes rest on a rule that sets the lines at 95 and 75 of every 100 highland craters; the large craters on the floors are few; and the state alone does not tell whether a crater was melted or covered by a later flow. Directions for further research. Remnants of the vanished craters in the gravity field beneath the floors of the maria of the contact; the large craters of the plains of the contact (Study 15).
G.3 The maria: temperature, viscosity and time
Study 8 established the pattern. This section and the next give its causes: here, the floor that receives the crater; in §G.4, the material that makes it. The key property of the floor is its viscosity, its resistance to flow: water has a low viscosity, honey a higher one, cold tar a very high one. A floor of low viscosity closes over a crater; a floor of very high viscosity keeps it.
The viscosity. A mare basalt melt is fluid: the lavas returned by Apollo have a viscosity of the order of 1 Pa s near their liquidus [S14], about 1,200 °C. The liquidus is the temperature above which the melt is wholly liquid; 1 Pa s is about a thousand times the viscosity of water, close to that of glycerine. As the melt cools below the liquidus, crystals grow in it; as they approach half of its volume the melt stops flowing, and its viscosity rises by many orders of magnitude before it freezes at the solidus, about 1,050 °C. The solidus is the temperature below which no liquid is left. A mare passes through three states as it cools — liquid, mush, solid — and the material that lands on it meets each in turn. The mush is the middle state, a crowd of crystals with melt between them, like wet sand or setting plaster: it holds a shape for a time but slowly yields.
What a landing does in each state. On a liquid mare the returning material sinks and mixes, the crater closes behind it, and at most a part of the rim that stood on firm ground remains: the crater is melted. On a mush the crater holds its shape for a while; its walls slump, its floor fills, its rim survives: the crater is smeared. On a frozen floor the crater keeps its full form: it is sharp. The picture is that of a spoon pressed into a pot of cooling porridge: in the hot pot the hollow closes at once, in the thickening pot it slowly fills and its edges sag, and in the cold, set pot it stays. Sinus Iridum is the first case — its southern rim, standing on the liquid mare, is gone, its northern rim, on the firm shore, remains as the Jura Mountains; Plato is the second; Kirch the third.
Time. A mare freezes from above. The frozen lid thickens as the square root of time, where m s is the thermal diffusivity, a constant of order one set by the latent heat, and the depth of the melt. In words: heat leaves the melt through the lid already frozen above it, and the thicker the lid, the slower the heat escapes, so each further metre of lid takes longer than the last; the thickness grows as the square root of the time . The thermal diffusivity measures how fast heat spreads through the material; the latent heat is the heat a melt must give up to freeze, beyond what it gives up in cooling. The second relation follows: the time to freeze the whole depth grows as the square of the depth. A mare ten times deeper stays liquid a hundred times longer. The maria of the contact were fed the longest and are the deepest. Deepest here is the depth of the body of the mare itself, measured inward, not the height of its floor: the centres of their floors stand slightly raised, Serenitatis by m and Imbrium by m. The material at that depth was hot, so they stayed liquid the longest; and they lay closest to the Moon’s own heat source, a second reason they were the last to freeze. While they were liquid, the large craters that landed on them while they were liquid melted and vanished into the mare: not one of 20 km and more remains on their floors. The maria of the limbs, cut off earlier and shallower, froze first, and some of the large craters on them survive as rings.
G.4 The arriving material: temperature, size and distance
The second clock is in the material that lands. In the model about 99% of the craters are made by returning material from the Earth (Paper 6), and the Earth’s output did not stay the same after release.
The Earth went on throwing. At release the Earth did not stop. Its openings went on throwing material; most of it fell back to the Earth, and part reached the Moon and landed on it. To reach the Moon at a distance from the Earth’s centre, the material must leave the Earth’s surface at 8.8 km s for a Moon at 17,000 km, 9.9 at 30,000 km and 10.6 at 60,000 km ( km). Here is the gravitational constant, the Earth’s mass and its radius. The equation is the balance of energy: a piece leaving the surface must carry enough energy of motion to climb out of the Earth’s gravity from the surface to the Moon’s distance. As the Moon receded, the speed needed rose toward the Earth’s escape speed, the speed at which a piece leaves the Earth altogether. At 17,000 km, close to the distance of release, a piece that the Earth could throw at 8.8 km s reached the Moon; once the Moon stood at 60,000 km, the same piece fell back, and only those thrown at 10.6 km s or more arrived.
The large first, the small later. As the Moon receded, a piece needed a higher speed to reach it (equation 3). The Earth’s gravity brought the large pieces back, while the small ones, which the Moon draws easily, still arrived. The large pieces came out first; as the storm of magma on the Earth calmed, smaller pieces, still hot, were thrown. While the Moon was close, large pieces reached it; as it receded, only smaller ones did. The size of the largest crater made on the maria falls with time.
All hot; the floors cooled. The material left a hot Earth with a low viscosity, in the state of the returning material that built the craters of the shell (Paper 6, Part J), and it stayed hot to the end: the large pieces first, then, as the storm of magma calmed, smaller pieces, still hot. What changed was the floor that received them. A small piece landing on a floor that had already frozen makes the sharpest crater: Kirch. Its ratio of 0.166, more than twice that of a highland crater of its size, is what a small piece on a frozen floor leaves.
G.5 The chain in time
Two clocks run together: the maria cool, and the material arriving from the Earth, hot throughout, grows smaller. Because both run the same way, a large crater is almost always an early crater, and an early crater almost always met a soft floor. This is why size and state are tied on the floors of the maria.
| Stage | The Earth | The maria | The crater | Example |
|---|---|---|---|---|
| Early | close; large, hot pieces reach the Moon | liquid, low viscosity | melted | Sinus Iridum |
| Middle | receding; middle-sized pieces | mush, viscosity rising | smeared | Plato |
| Late | far; only small pieces, still hot | frozen | sharp | Kirch |
The table is read from top to bottom as time runs, and the row colours follow the temperature of the maria: red for the early stage, when the floors were liquid, amber for the middle, blue for the late stage, when they had frozen. Each row joins the state of the Earth, the state of the maria, and the crater the two together leave, with the example of §G.1.
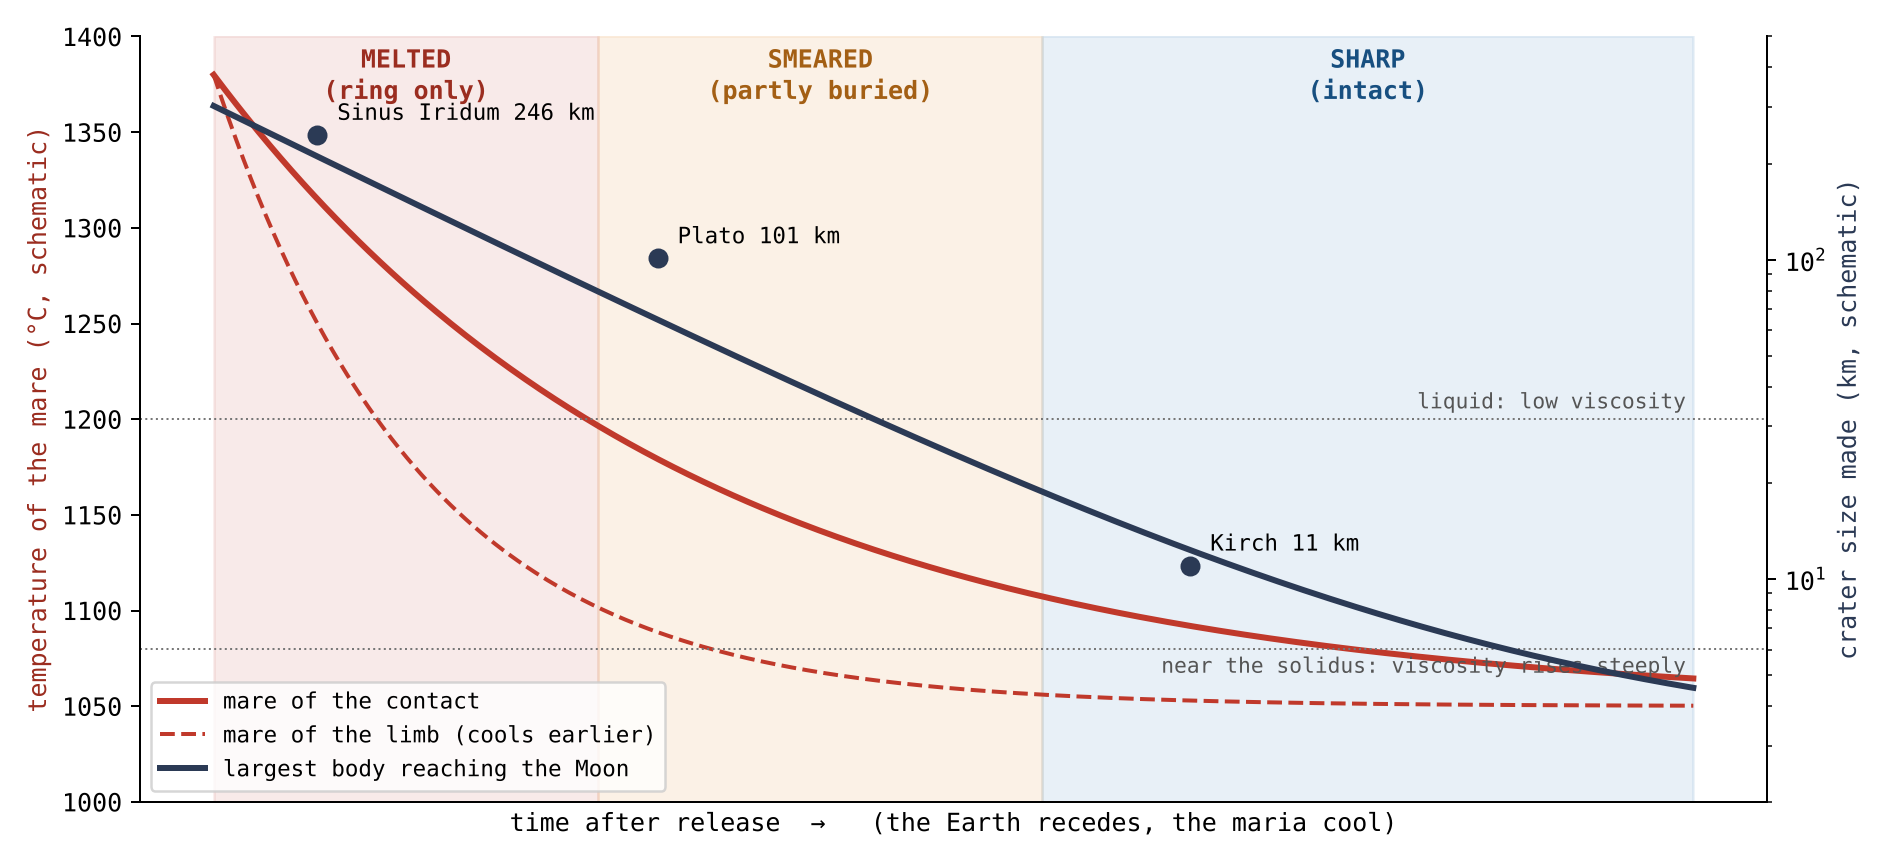
Figure 9 draws the same chain as curves. Time runs to the right. The red curves fall as the maria cool, the dashed curve of the limb earlier than the solid curve of the contact; the navy curve falls as the largest piece that can reach the Moon grows smaller. The shaded background shows which state a landing leaves at each moment. A crater’s place in the figure is fixed by when it arrived and on which mare: a large crater can only lie at the left, where the background is melted, and a crater on the contact stays in the melted band longer than one on the limb.
The order is read without years. On the maria of the limb the same chain ran earlier, because they froze first: a large crater that would have been melted on the contact could stay sharp on the limb.
G.6 The plains of the contact: heat from below, and the rim
The floors of the maria of the contact carry no large crater. The large craters of the contact are not missing, however: they lie on its plains, and their rims carry a second kind of wear. This section asks what wore them.
The large craters of the contact are on its plains. Of the 41 craters of 40 km and more on the basalt within the contact, not one lies on the floor of a mare: 37 lie on the plains, 22 of them on Procellarum, and 4 on the basalt of Imbrium and Serenitatis outside the cores of their domes. None is sharp, 33 are melted and 8 smeared. Beyond the contact, on the plains, 27 of 85 are sharp and 25 melted (an earlier version gave 27 of 86, counting with them a crater of 64 km on the basalt of Serenitatis that lies 1,507 km from the contact centre, just outside the disc). Most are of middle size: half are of 40–60 km, and four exceed 120 km.
The literature. The craters on the maria were made by bodies from outside; the basalt that came after them flooded the land around them. Flooding raises the ground outside a crater, so the rim that remains exposed stands lower above it, though the crest itself is not lowered [S16, S25]; a crater deeper than the flow keeps its rim as a ring above it. In that reading a low rim on a mare plain measures the thickness of the basalt laid around it. The picture is of a sandcastle with water rising around it: the water hides the lower slopes and the castle looks lower, but its top is untouched.
The model. The plains of the contact lay over the Earth: the heat that reached them came from below, from the Earth beneath them. A crater that landed on them after the middle of the storm, a piece of middle size thrown from the Earth, met a hot plain; the plain wore the rim away where it touched it, on the side that faces it. The crest itself was lowered and blunted. In the picture above, this is not water rising around the castle but warm ground beneath it softening one side, so that the top itself slumps. On Imbrium the heat came from below the crater, from the Moon, through the opening: the crater was melted from its floor upward, and its rim, standing on firmer ground, was kept.
The separating test. The two readings predict different things, and the test is built on the difference. Flooding raises the ground on the side of a crater that faces the basalt, on every plain alike. Heat from below wears the rim on the side that faces the hot plain, where the plain was hot: on the plains of the contact, not on the plains beyond it. For every crater of 40 km and more on the near-side basalt the rim crest was traced on 36 radial profiles of the elevation model of 64 pixels per degree, against a plane fitted to the ground at 1.6–2.4 radii; each direction was classed as facing a plain or facing the highland by the ground beyond the rim. A radial profile is a line of heights drawn outward from the crater’s centre, one every 10° around it; in each the crest is found as a peak, and its height measured above the surrounding ground.
| Craters of 40 km and more | Craters | Crest above the ground (m) | Rim missing, plain side minus highland side |
|---|---|---|---|
| Plains of the contact | 29–33 | 393–590 | (10 to 35) |
| Plains beyond the contact | 34–39 | 627–960 | 0% ( to 0) |
| Basalt of Imbrium and Serenitatis | 4 | 148–1,721 | ( to ) |
| Highland, near side | 590 | 616–1,006 | — |
Crest: medians by size bin, 40–60, 60–100 and 100 km and more.
Missing: the share of directions on which no crest of 50 m prominence is
found, plain-facing minus highland-facing, crater by crater; 95%
intervals by resampling.
The red row is the plains of the contact, the one group the model sets apart; the rows beneath it are the comparisons. The third column gives the height of the crest above the ground, as a range over the three size bins; the fourth asks, for each crater, on how many more of the plain-facing directions than of the highland-facing ones the rim cannot be found at all. A crest of 50 m prominence is a peak standing at least 50 m above the dips on either side of it. The figures in brackets are 95% intervals obtained by resampling: the craters are drawn again at random many times, and the range covering 95 of every 100 redrawn results shows how firm the value is. Only the red row stands apart in both columns: lower crests, and rims missing on the plain side.
On the plains of the contact the crest stands 345–375 m lower than on the plains beyond and in the highland, and the rim is missing on a quarter more of the directions that face the plain than of those that face the highland. On the plains beyond the contact, where the same basalt lies around the craters, the rim is missing no more toward the plain than toward the highland. On both kinds of plain the crest that remains stands lower on the side of the plain, by about 220–270 m, as flooding predicts on every plain. Both effects are therefore present: flooding, seen on every plain, and a loss of rim on the plain side seen only on the contact.
The shape of the crest. A flood rises along the outer flank and does not reach the crest, so a flooded crest keeps its shape; a crest worn by heat is blunt. Where a crest survives, its shape was read on the elevation model of 512 pixels per degree (SLDEM2015, 60 m) [S26], profile by profile: the sharpness (the curvature at the top), the width of the crest 50 m below its top, and the angle between the inner and outer slopes. A knife edge has high curvature, a narrow width below its top and a small angle; a rounded loaf has low curvature, a wide top and a wide angle.
| Plain side minus highland side, crater by crater | Sharpness (m/km) | Crest width, 50 m below (km) | Angle at the crest |
|---|---|---|---|
| Plains of the contact (29) | ( to ) | (0.03 to 0.31) | (2.0 to 7.0) |
| Plains beyond the contact (34) | ( to ) | no difference | (0.3 to 2.8) |
| Highland, near side (77) | ( to ) | no difference | (0.2 to 3.3) |
95% intervals by resampling cells of 5° by 5°. The highland side
of each crater is its own control.
Each value is a difference within one crater: the crest on its plain side minus the crest on its highland side. A negative sharpness and a positive width and angle mean a blunter crest on the plain side. Because each crater is compared with itself, differences of size, age and latitude between craters cancel. Here the resampling draws whole cells of 5° by 5° rather than single craters, so that neighbouring craters, which are not independent, are drawn together. The red row of the contact is the only one in which all three measures point the same way with intervals that exclude zero.
On the plains of the contact the crest that survives on the side of the plain is blunter than on the side of the highland: less sharp, wider, and with a wider angle. On the plains beyond the contact and in the highland the two sides differ by little, and the difference in angle disappears when only the finest elevation model is used. Against the plains beyond, the angle of the contact is wider by (0.4 to 6.3). A flood cannot blunt a crest it does not reach; a hot plain beneath the rim can.
The phenomenon. The large craters on the basalt of the contact are melted, none sharp, and not one lies on the floor of a mare (Study 8). The gap in knowledge. A low rim on a plain of basalt is read as the rim exposed above a flood; whether the rims of the plains of the contact were lost in another way has not been tested. The research question: are the rims of the large craters on the plains of the contact lower and more broken than elsewhere, and are they lost on the side that faces the plain only where the plain was hot?
Craters on the maria partly flooded by later basalt are used to measure the thickness of the basalt: the flood raises the ground outside the crater and the exposed rim stands lower above it [S16, S25]. Du et al. found 262 fully exposed, 360 partly exposed and 39 wholly concealed rims, and basalt thicknesses of 33–455 m around 41 of them [S16]. What is new here: the rim crest is traced in 36 directions, each classed by the ground it faces, and the plains of the contact are compared with the plains beyond it, where the same flooding would act.
The plains of the contact were heated from below by the Earth beneath them; the hot plain wore away the rims of the craters that landed on it, where it touched them. Hence: on the plains of the contact the crests are lower than on the plains beyond and in the highland, and the rim is lost more on the side that faces the plain; on the plains beyond the contact, which were not heated from below, no such loss on the side of the plain.
Type of research: quantitative; crests and floors by group, and the plain-facing against the highland-facing directions crater by crater. The sample: the 137 craters of 40 km and more on the near-side basalt (37 on the plains of the contact, 85 on the plains beyond, 5 on the basalt of Imbrium and Serenitatis outside the cores of their domes, one of them, on Serenitatis, just outside the contact disc, and 4 of them with a measurable crest; 10 on the floors of the maria) and 592 highland craters of the same sizes, near side, latitude within 60°. The tools: the Wang & Wu catalogue [S6], the LOLA elevation model at 64 pixels per degree, the LROC mare map, and code that traces the crest on 36 radial profiles.
The three rules of the tracing, and why each was chosen:
| Rule | Why, in plain words |
|---|---|
| The ground: a plane fitted to 1.6–2.4 radii | The present level around the crater, the same rule for every group |
| The crest: the highest peak of 50 m prominence at 0.8–1.2 radii, profile by profile | A rim seen as a ridge, not as an average over a ring |
| A direction faces a plain when half of the ground at 1.2–1.6 radii is basalt | To tell the side that touched the plain from the side that touched the highland |
For each crater the ground plane was fitted, the crest was traced on each of the 36 profiles, and each profile was classed as facing a plain or the highland. Craters without enough ground for a plane were kept in the output; alternative ground planes, of the highland only and of all the ground, were read as checks. The values are the table of §G.6.
The crest. On the plains of the contact the crests stand 375 m lower than on the plains beyond (95% interval 44–615 m) and 345 m lower than in the highland (167–450 m); with either alternative ground plane the difference remains, 219–422 m. The side that faces the plain. On the plains of the contact the rim is missing on 24% more of the plain-facing directions than of the highland-facing ones (10–35%), and the same holds among the craters smaller than 100 km alone; on the plains beyond the contact the difference is 0 ( to 0). On both, the crest that remains is lower on the side of the plain, by 265 and 217 m. The floor. The floors lie near the level of the ground on the plains of the contact and on the plains beyond alike; they do not separate the two. The shape of the crest. On the plains of the contact the surviving crest is blunter on the side of the plain: sharpness lower by 35 m/km (18–46), width 50 m below the top larger by 0.14 km (0.03–0.31), angle wider by (2.0–7.0); beyond the contact the sharpness and width do not differ, and the angle differs by , which vanishes on the finest model alone. Matched crater against crater, at the same diameter, latitude and interior depth, only four pairs of the contact and beyond could be formed, too few to compare the two groups directly. Imbrium. The four craters on the basalt of Imbrium and Serenitatis lose their rim no more toward the plain than toward the highland (); the crest of Sinus Iridum stands 1,721 m above the ground.
Result. The hypothesis is supported: on the plains of the contact the rims are lower and are lost on the side that faces the plain, and on the plains beyond the contact, flooded alike, they are not; the lowering of the remaining crest on the side of the plain, common to both, is the work of flooding, while the loss of the rim, and the blunting of the crest that survives on the side of the plain, are the work of the hot plain of the contact. Limitations. The ground plane is the present level, not the ground the crater landed on; a crest not found by the tracing is not proof that no rim is there; the craters on Imbrium are few; the heat from the Earth beneath the contact is inferred, not measured. Only the crests that survive can be measured for their shape, and the matched comparison between the contact and beyond rests on four pairs. Directions for further research. A larger matched sample of craters of the contact and beyond, of equal interior depth, on the finest elevation model.
G.7What this shows
The craters on the maria record the Earth after release. Material kept arriving from it — large at first, smaller with time, hot throughout — while the maria cooled beneath it. The large craters that landed on liquid floors vanished or were melted to rings; the middle ones that met a mush were smeared; the small ones that came last, onto frozen floors, stayed sharp; and on the plains of the contact, heated from the Earth beneath, the rims of the large craters were worn on the side of the hot plain. The activity of the Earth waned with time, but it went on after release, and the size and state of the craters on the maria are its record.
The engine
an opening lives as long as its melt is fed and can flow. The approach: the conditions of pressure, buoyancy, viscosity, volatiles and heat are stated, with what is computed and what is left to compute.
Parts C–G described what a mare is: an opening over a feed dome, with a floor that froze and sank, and a record of craters that tells when it froze. This Part asks what made such an opening work — what drove material up through it, and what decided when it stopped. We call this the engine of the opening. The engine has four parts, taken in turn: the force that pushes the material up, and why it must be carried by a liquid (§H.1); the volatiles that lighten the melt and help it flow (§H.2); the flux, the amount passing through the opening, and how its fall seals the opening (§H.3); and the heat of the Earth, which kept the openings of the near side open while the body was attached (§H.4). Some of these conditions are computed here; the one that needs a full thermal calculation, the critical flux, is stated as a requirement and collected in Part M.
H.1Pressure, buoyancy and viscosity
The force is carried by liquid. A solid would have to carry a stress of 13–16 GPa against a strength of about 0.2 GPa, sixty to eighty times too much; a liquid has no tensile strength and flows. A stress is a force divided by the area that carries it, and the strength of a material is the largest stress it can bear for a long time without breaking or creeping; one gigapascal (GPa) is about ten thousand times the air pressure at sea level. No solid of the shell could therefore carry the load; it would break and flow long before. A liquid does not need strength to pass on a push. It passes pressure from one end to the other as the fluid in a car’s brake line passes the push of the pedal to the wheels: the fluid itself resists nothing, it only transmits. This is why the engine of an opening is a column of melt and not a solid piston.
An opening is therefore alive while its melt is fed by pressure and buoyancy and its viscosity is low enough to flow beneath a strong shell. Two forces push the melt up. The pressure is the push from the source beneath, passed up through the liquid. The buoyancy is the lift a lighter fluid feels inside a denser surrounding, as a cork rises in water. The viscosity is the resistance of a fluid to flowing: honey has a high viscosity and water a low one. A melt of low viscosity can move through the opening while the strong shell around it holds its shape; a melt of high viscosity stalls.
The viscosity is bounded from both sides: water lowers it from above, and the need to carry iron bounds it from below. Water dissolved in a melt loosens its structure and makes it flow more easily, so a melt rich in water cannot be too thick. But a melt that is too thin lets the dense iron settle out of it instead of carrying it up, as a thin liquid lets heavy grains sink while a thick one holds them. The working melt of an opening lies between these two limits.
H.2 Volatiles
Volatiles are substances that pass easily into gas, water first among them. The early system was rich in volatiles. They lighten the melt, expand it and lower its viscosity, and they drive the material out of the maria that built their margins (§F.3). A melt carrying dissolved gas is lighter than the same melt without it, and as it rises and the pressure on it falls, the gas comes out of solution and swells it, as a bottle of soda foams when it is opened. This both lifts the melt and throws it out.
The maria were not alike in this: the volatile-rich maria sprayed more, and the maria rich in light material threw it far early, before the viscosity rose (§J.2). This difference between the maria returns in the chemistry of the ground around them, which Part J reads ring by ring.
A specialist will object that the interior of the Moon is known to be dry. The interior of the Moon is called dry today; that describes the Moon after the volatiles left, not during the construction. The samples measure the state that remained once the gas had escaped through the openings; the engine worked before that, while the volatiles were still present.
H.3Flux, decay and the critical flux
The flux is the mass that passes through an opening in a unit of time. What an opening passed in its life is : the flux added up over the whole time the opening was active, from its first flow to its seal. Part of it stayed in the body and part was thrown, that is, the flux that fed the opening equals the part retained in the body, which built its interior, plus the part erupted out of the opening. Only the thrown part made returning craters. This matters for reading the craters: the number of craters around a mare measures what it threw, not everything that passed through it.
An opening seals when the flux falls below the level at which the heat brought in no longer balances the cooling. A tap left running on a frosty night is a fair picture: while the water flows strongly, the warmth it carries keeps the pipe open; when the flow falls to a trickle, the cold wins and the pipe freezes shut. The level of flow at which the two balance is the critical flux. The critical flux and the times of sealing require the time of transport, the diameter of the opening, the rate of rise, the viscosity of the melt, the rate at which the contact narrowed and the thermal history of the dome; they are listed as a requirement in Part M.
H.4The heat of the Earth
While the body was attached, the near side faced the hot Earth. Radiation from an Earth of about 2,000 K, with a view factor of 0.205, holds the near-side surface near 1,345 K, above the solidus: the near side could not freeze while attached, and its openings stayed open.
Three terms carry this result. The view factor is the share of the radiation leaving a surface that reaches a given body — in plain words, how much of the sky that body fills as seen from the surface. A view factor of 0.205 means that, from the near side, the Earth filled about a fifth of the sky. A surface that receives this radiation and sends it out again settles where what it emits equals what it receives; for a fifth of the sky filled by a body at about 2,000 K this is about K. The solidus is the temperature below which a material is wholly solid; for mare basalt it is about 1,050 °C (§G.3), close to 1,320 K. The near-side surface was held above it. It could not form a lasting solid lid, and the openings beneath it could not seal.
The far side faced away from the Earth. As the pear grew, less and less of the Earth’s heat reached it; it radiated to space and froze. Most of its openings sealed one after another and formed a closed cap that the pressure pushed; Moscoviense, fed from Serenitatis by a straight internal passage, stayed active long after them. One asymmetry of heat makes the mouth, the seal, the dark maria and the difference of ages: the near side, kept hot by the Earth, kept its openings as mouths and exits, passages of the Earth’s pressure, until release; most of the far side sealed its openings early; the near-side maria stayed liquid to the end and, after release, froze slowly from the outside inward into the large dark plains seen today; and the two sides froze at different times, so their surfaces carry different ages.
What we now have. An opening worked while a liquid melt, lightened by volatiles and of the right viscosity, was fed through it by pressure and buoyancy, and while the heat it brought in balanced its cooling. On the near side the Earth’s radiation removed the cooling from the balance while the body was attached. Part I adds the second condition: an opening could throw outward only once it was exposed.
The geometry of exposure, and the generations
the openings were not exposed all at once. The approach: the retreat of the contact is followed as a clock, and the openings are sorted by when they were exposed and what they did in each stage.
Part H stated what kept an opening working. This Part adds where and when each opening could work as an exit. The body sat on the tip of the Earth’s pear (§B.1) in three parts. The contact was the disc of the lower dome that touched the tip and stayed attached to the end, 3,000 km across at release. Around it lay the annulus of the lower dome, which sat on the tip while the tip was 6,000 km wide and peeled away from it as the contact shrank. Above both stood the upper dome, turned away from the Earth and open to space from the start. An opening under the contact was covered by the Earth and could only pass material into the body; an opening open to space could throw material outward. As the contact shrank, openings passed from the first state to the second. When the body rounded, each part kept its share of the surface, and the three parts became three zones about the centre of the near side: the contact a near-side cap of about 31°, the annulus a belt from 31° to 70°, and the upper dome the far side beyond (§B.3; Paper 3, §B.4). In the catalogue of Appendix A the same order is carried by the zones of Paper 3: the contact, the hill around it reaching toward the limbs, and beyond, on the far side.
I.1The moving front of exposure
As the tip of the pear narrowed from 6,000 to 3,000 km, the contact retreated, and the shell was exposed from the outside in. The outer regions were exposed first; the last contact stayed covered until release. The edge of the contact is therefore a front that moved inward across the shell, and every opening was exposed at the moment the front passed over it.
The geometry itself makes a clock. An opening far from the centre of the contact was exposed early; one near the centre, late. Its distance from the centre is a reading of when it was exposed, without years. The whole construction, from the start of the bulge to release at 3.873 Ga, took about 600 Myr (roughly 400 for the bulge and the pear, 100 for the flattening and 100 to release); the clock of exposure orders the openings within that time, without fixing their dates.
An image makes it plain: a deflated football, its half resting on the floor, is inflated and rounds, and the number of its faces that touch the floor falls. The faces do not change; what falls is how many of them touch the Earth at once, and only a face in contact can be a mouth. In the picture the faces are the openings and the floor is the Earth. The faces that lift off the floor first are those at the edge of the patch in contact; the face at the centre of the patch is the last to leave it.
I.2 From a covered mouth to an exposed exit
An opening under the contact fed the body inward while covered. When the front passed over it, the same path was exposed and began to throw outward. In the terms of §A.1, it began as a mouth, through which material passed while still covered, and ended as an exit, which threw material out. The mare seen today is the last stage of a structure whose life began long before. The structure is the same in both states; what differs is the dome around it, open to space or sealed. The dome seals above, and the opening below goes on passing material beneath it. This is why the same opening can carry the marks of both lives: a deep feed from its covered time, and the craters and margins of its exposed time.
I.3Gradual exposure within one mare
A large mare that straddled the front was exposed from one side to the other, : the time of exposure is not one value for the whole mare but changes with the position across it, the outer side first and the inner side last. If the record keeps it, a gradient should appear within the mare in the direction of exposure: in the preservation of craters, in the filling, or in the structure. The side exposed first had longer to throw material and to collect craters. The test is stated in Part M.
I.4 Three generations
The openings fall into three generations by their history of exposure, not by the age of their basalt. The difference matters: the basalt is only the last surface of an opening and can be young over an opening that worked for a long time, so its age dates the end of an opening, not its life. Generation I: openings on the face of the dome, on the far side, exposed from the start and throwing outward. Generation II: openings in the belt, exposed during the rounding, first mouths and then exits. Generation III: openings in the contact disc, exposed only toward release, the last mouths. In the author’s words: the maria are exit openings; some are exits proper, and some are mouths through which material passed to the exits, and which were exposed with time.
| Generation | On the body | On the Moon today | Life of the opening |
|---|---|---|---|
| I | The upper dome, open to space | Beyond 70°; in Appendix A, beyond the hill: the far side | Exposed from the start; threw outward; sealed early, many now buried (§D.4) |
| II | The annulus of the lower dome: the belt | The belt, 31°–70°; in Appendix A, the hill, toward the limbs | Exposed during the rounding; a mouth first, then an exit |
| III | The contact disc | The near-side cap of about 31°; in Appendix A, the contact | Covered until near release; the last mouths |
The table is read from top to bottom as the order of exposure, which runs from the outside in: the colour moves from the far side, exposed first, to the contact, exposed last. The zones of today follow Appendix A, where each mare is placed in its zone and generation by the geometry of Paper 3.
I.5What the maria did in each stage
The construction ran in stages (§B.1): the outward rounding, as the body seated on the tip became a ball; the flattening; the inward rounding, as the flattening relaxed; then release, and the time after. The table follows the maria through them.
| Stage | What the maria did |
|---|---|
| Outward rounding | The first openings, on the flat shell, threw material; the craters already on the surface changed with it |
| Flattening | The maria worked at full strength; most of the craters formed, and the largest |
| Inward rounding | The maria calmed; most far-side openings sealed, as the pear grew and less of the Earth’s heat reached them, and formed a closed cap that the pressure pushed (Moscoviense, fed from Serenitatis, stayed active); the limb openings went on throwing |
| Release | The Earth’s pressure stopped reaching the Moon, and the ejections stopped; the near-side maria, hot and of low viscosity, began to freeze slowly from the outside inward; their floors are smooth |
| After release | No opening of the Moon threw any more; the near-side maria froze over hundreds of millions of years to 1–2 billion; the small craters were made by drops the Earth went on throwing, drawn to the Moon (§§F.5–F.6) |
The highlighted rows mark the two turning points: the flattening, when the maria threw the most and the largest craters formed, and the release, when the Earth’s pressure stopped reaching the Moon. Most of the far side sealed first, while the body was still attached, as the pear grew and less of the Earth’s heat reached it (§H.4); at release the ejections stopped everywhere, and the near-side maria, no longer fed, froze slowly afterwards.
Why the near-side floors are smooth. At release they were hot and of low viscosity, and they froze slowly, from the outside inward, as a lake freezes; they kept only what fell after they froze. On the floor of Mare Imbrium lie 10 craters of 20 km and more on 871,000 km² (the whole basalt named Imbrium on the LROC map, not only the floor over the core of its dome, 345,584 km² in §F.5), 11 per million km²; on Serenitatis 16, against 205 on the highlands (207 in Paper 6, §D.2, on a slightly different highland area) — about thirteen to eighteen times fewer (205/16 to 205/11). Procellarum, a basalt plain and not a mare, carries 27; an earlier version counted it among the maria and read “eight to eighteen” (205/27 to 205/11), and before that “three to eighteen”. A density per million km² lets surfaces of different size be compared: it is the number of craters a surface of that area would carry. The highlands, which froze early, kept the craters of the whole construction; the floors of the near side kept only what fell after they froze. The count includes craters melted into the basalt and seen only as rings, so that the number made after the floor froze is smaller still.
I.6The size of an opening as a memory
An opening that fed for long under cover, in heat and under pressure, can be wider than one that was exposed and cooled early: a hot flow widens its path, as running water widens a channel in ice. The prediction is that the diameter is ordered by the duration of feeding, . In words, the diameter of an opening is a function of how long and how it was fed, of the pressure , the temperature , the flux and the viscosity of its melt; the size of an opening is a memory of its feeding. Read on the catalogue of Appendix A, the openings of the near side are the larger, by the source of heat: the six largest feed domes, 450–909 km across, all lie on the near side, and the median diameter is 375 km there against 227 km on the far side, where the largest is Orientale, 435 km (an earlier version read “the openings of 200–1,200 km lie almost all on the near side”; on the far side 11 of 18 domes measure 200 km and more).
The condition that ties geometry to the engine is that an opening must still be active when it is exposed: Here is the time at which the opening sealed (Part H) and the time at which the front of exposure reached it (§I.1). The engine sets the first, the geometry the second. A mouth that sealed before the front reached it never became an exit. Such a mouth threw nothing outward and left no field of returning craters, however much it passed while covered.
What we now have. The openings were exposed in an order set by the narrowing contact: the far side first, the belt next, the contact last. Each opening was a mouth while covered and became an exit when exposed, provided it was still active. Most of the far side sealed early, as the pear grew and less of the Earth’s heat reached it (Moscoviense the exception); at release the ejections stopped, and the smooth floors of the near side record that they froze after it, slowly, from the outside inward. Part J reads the same history in the chemistry of the ground.
Chemistry
the maria carry their history in their elements. The approach: iron and titanium around the maria, thorium against the zones of the construction, and the siderophile elements of the basins are read in turn.
Parts H and I followed the openings in time: how they worked, and when each was exposed and sealed. This Part reads the same history in the elements of the surface, as they are mapped from orbit. Three kinds of element carry it, and each tells something different.
| Element | What it marks | What it tells here |
|---|---|---|
| Iron and titanium (FeO, TiO) | The material of the maria, which is rich in both | How far each mare threw its material, and when it sealed (§J.1–J.2) |
| Thorium | The last liquid of a cooling melt, which keeps it | Where the Moon last touched the Earth, and where the last liquid went (§J.3–J.6) |
| Siderophile elements | Metal from outside, which carries them | Whether a foreign body left its mass in the basins (§J.7) |
Iron and titanium are given as the weight of their oxides, FeO and TiO, in percent of the weight of the ground (wt%): 6.9 wt% FeO means 6.9 grams of iron oxide in every 100 grams of surface material. Thorium is far rarer and is given in parts per million (ppm), grams in a tonne.
J.1Rings of iron and titanium
If the maria are the source of the returning material (§B.2), the ground around each mare should carry its material, most near it and less farther out. The question of this section is how that material falls with distance. Each mare is surrounded by rings: bands of ground at a set distance from it, 0–25 km, 25–50 km and outward to 300–600 km. The ground is read around small craters of 5–60 km chosen in each ring, at 3–4 crater radii from each crater’s centre, and every pixel of basalt is removed, so that what is measured is the land around the mare and not lava that spread over it.
In the ground at 3–4 radii around each crater, basalt pixels removed, the iron and titanium are highest in the nearest ring and fall outward. Around the six maria, pooled, iron falls from 6.9 wt% at 0–25 km to 3.1 at 100–150 km and then holds at 3.3–3.4 out to 600 km, and titanium from 0.90 to 0.51; the controls hold 2.3 and 0.46. The controls are ground beyond 600 km from any of them, the level of the highland where no mare reached. The iron near the maria is three times that level, and even at 300–600 km it stays one-half higher. Around the plain of Procellarum the iron falls from 10.9 to 2.4 wt%, the level of the controls, at 300–600 km.
| FeO/TiO, wt% | 0–25 km | 25–50 | 50–100 | 100–150 | 150–300 | 300–600 |
|---|---|---|---|---|---|---|
| The maria | ||||||
| Smythii | 7.8/1.25 | 5.8/0.92 | 3.6/0.72 | 3.2/0.64 | 3.4/0.57 | 3.5/0.62 |
| Imbrium | 10.8/1.07 | 9.8/0.97 | 9.6/0.78 | — | — | — |
| Serenitatis | 8.0/1.31 | 7.0/0.67 | 6.7/0.68 | — | — | — |
| Crisium | 4.7/0.72 | 4.1/0.60 | 4.2/0.53 | 4.0/0.49 | 4.4/0.43 | 3.4/0.43 |
| Moscoviense | 7.3/1.00 | 3.2/0.61 | 2.4/0.48 | 1.9/0.47 | 2.1/0.48 | 2.3/0.46 |
| Nectaris | 5.2/0.84 | 4.6/0.79 | 4.1/0.72 | 4.1/0.65 | 4.5/0.65 | 6.0/0.67 |
| Six maria pooled | 6.9/0.90 | 5.1/0.75 | 3.9/0.61 | 3.1/0.53 | 3.3/0.53 | 3.4/0.51 |
| The plains | ||||||
| Tranquillitatis | 8.6/1.24 | 7.7/1.12 | 6.8/1.03 | 5.8/0.84 | 5.0/0.81 | 4.5/0.78 |
| Fecunditatis | 9.4/1.12 | 7.9/0.93 | 7.3/0.83 | 6.8/0.74 | 6.4/0.73 | 6.3/0.64 |
| Procellarum | 10.9/1.12 | 8.8/0.84 | 6.5/0.69 | 4.7/0.58 | 3.2/0.49 | 2.4/0.39 |
| Controls, beyond 600 km | 2.3/0.46 | |||||
Each cell gives iron and titanium, FeO/TiO, in the ring of its column. The table is read along each row, from the nearest ring on the left to the farthest on the right: in every row the values fall outward. The highlighted row, the six maria pooled, is the main result; it should be read against the last row, the controls. The grey row, Procellarum, is the plain that falls all the way to the controls. The dashes mark the rings left unread around Imbrium and Serenitatis, whose far rings fall among other basalt surfaces (Step 7 of Study 9).
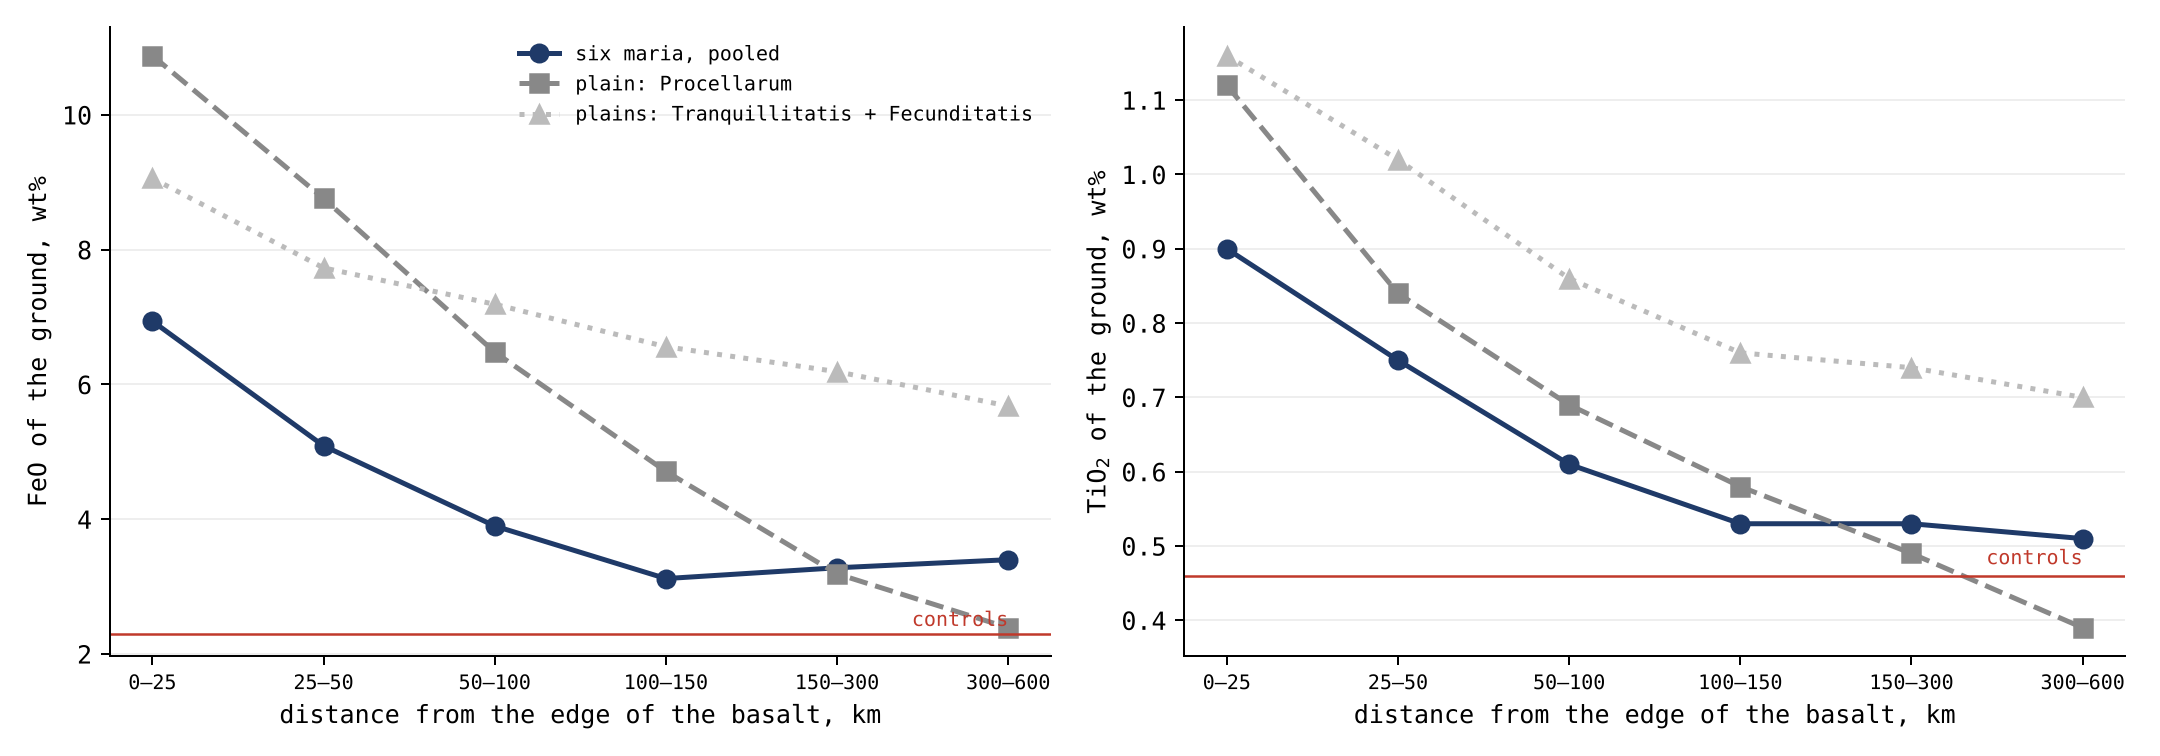
Figure 10 draws the same values as curves against distance. The curves of the maria fall steeply over the first 100 km and then level off above the controls; the curve of Procellarum keeps falling until it meets them. That difference is the subject of Study 9.
The phenomenon. The ground around every mare is richer in iron and titanium than the far highlands. The gap in knowledge. How far each mare’s signature reaches, and whether it falls in the same way around every mare and around the plains, has not been read ring by ring with the basalt itself removed. The research question: around each mare, how do the iron and titanium of the land fall with distance, how far does the excess reach, and how does this differ around the plains?
The excess is read as mare material carried sideways into the highland by later cratering, a few kilometres to some tens of kilometres [S18]. In that reading each later crater throws a little of the mare a short way, and many such throws spread it. Iron and titanium are read from Kaguya [S3], a Japanese orbiter that mapped them over the whole Moon. What is new here: six maria and three plains, each read in six rings out to 600 km, the basalt pixels removed, against controls far from any basalt.
Each mare threw its material around it, the light and fluid material first and far, the heavy later and near; so around every mare the iron and titanium fall with distance, and the excess reaches far beyond the reach of sideways mixing. A plain threw nothing and only spilled its melt beside it, so the excess beside a plain falls to the level of the controls within the reach of its spill. The two readings therefore part where the reach is concerned: sideways mixing by craters stops within some tens of kilometres, while a mare that threw its own material reaches hundreds.
Type of research: quantitative; values by ring. The sample: the land around the craters of 5–60 km near six maria (Smythii, Imbrium, Serenitatis, Crisium, Moscoviense, Nectaris) and three plains (Tranquillitatis, Fecunditatis, Procellarum); controls beyond 600 km. The tools: the Kaguya maps at full resolution, the LROC mare map, and code that reads the land at 3–4 crater radii in rings of 0–25, 25–50, 50–100, 100–150, 150–300 and 300–600 km. The LROC mare map is the outline of every basalt unit mapped by the Lunar Reconnaissance Orbiter Camera; it is used here to remove the basalt pixels.
The craters were chosen before any chemistry was read (Study 2), so that the choice could not follow the values; the land around each was read with the basalt pixels removed, and placed in its ring. The values are the table of §J.1.
The maria, pooled. The iron falls from 6.9 wt% at 0–25 km to 5.1, 3.9 and 3.1 at 100–150 km, and holds at 3.3 and 3.4 at 150–300 and 300–600 km, 1.1 wt% above the controls; the titanium falls from 0.90 to 0.51. Mare by mare. Around Smythii and Moscoviense the iron falls by half within 50–100 km; around Crisium it stays at 4 wt% out to 300 km. The plains. Around Procellarum, the largest plain, the iron falls from 10.9 to 2.4 wt%, the level of the controls, at 300–600 km; around Tranquillitatis and Fecunditatis it stays high, 4.5 and 6.3 wt%, at 300–600 km, where the ground lies between other basalt surfaces. The exceptions. Southwest of Nectaris the iron rises again beyond 150 km, toward the iron-rich southern highlands, while its titanium stays flat; around Moscoviense the ring reaches the far-side level within 100 km.
Result. The hypothesis is supported: around every mare its signature falls with distance, and the excess of the maria holds out to 600 km; beside the largest plain the excess falls to the controls, the reach of a spill. An excess that holds to 600 km is ten times and more the reach of sideways mixing by later craters; it is the reach of a mare that threw its own material. Limitations. The far rings of neighbouring maria and plains overlap, and the two smaller plains lie among other basalt; the exceptions are explained by the land beyond, not tested; the rings read the surface, not depth. Directions for further research. The rings read only on the side of each mare and plain away from other basalt; a model of how far material thrown from a mare falls, by size and speed, against the measured fall-off.
J.2The chronology of iron
The rings of §J.1 also carry a clock. The iron of the ground records when each mare sealed. A mare sealed at its state of about 17% FeO; the ground far from it sealed low, and the ground near it high. In plain words: what a mare threw early landed far and was poor in iron; what it threw late landed near and was rich; and what it held when it sealed, about 17% FeO, is the iron of the mare itself. The maria rich in iron sealed late, and the maria poor in iron early.
The light material, poor in iron and rich in volatiles, flowed far at first; as the mare concentrated, its viscosity rose and its material flowed shorter distances, which is why the iron is highest at the rim. This is the same engine as in Part H, read from its products: at first the volatiles kept the melt thin and light and threw it far (§H.2); as they left, the melt became heavier, richer in iron and thicker, and it landed close. The fall of iron with distance is the record of that change.
J.3Thorium is held by the contact
Thorium is a radioactive element that does not enter the crystals that grow as a melt cools; it stays in the liquid and gathers in the last of it (§J.4). Where it is concentrated, the last liquid of some melt gathered. The question of this section is where on the Moon that is, and whether it is the contact, the region that last touched the Earth, fixed in Paper 3 before the thorium was read.
| Region | Area | Thorium excess above 3 ppm | Median thorium |
|---|---|---|---|
| The contact, 1,500 km radius | 17.5% | 95.0% | 5.39 ppm |
| The hill, 3,000 km radius | 57.8% | 98.4% | — |
| Outside the contact | 82.5% | 5.0% | 1.52 ppm |
The table sets the share of the Moon’s surface in each region (Area) against the share of the Moon’s thorium excess it holds. The two columns should be read side by side: if thorium were spread evenly, each region would hold the share of its area. The contact holds more than five times its share; the ground outside it, four-fifths of the surface, holds a twentieth. The colour deepens toward the region that holds the most.
The contact disc, a sixth of the surface, holds 95% of the Moon’s thorium above 3 ppm and 78% of the area where thorium exceeds 3 ppm. Thorium is measured from orbit by the gamma rays its decay emits, and Lunar Prospector mapped it over the whole Moon in cells of half a degree [S4]. The excess above 3 ppm is the part of the thorium that stands above the ordinary level of the highlands; it is the quantity that tells where thorium was gathered. The median, the middle value when all cells of a region are ranked, is 5.39 ppm inside the contact against 1.52 ppm outside it, three and a half times as much.
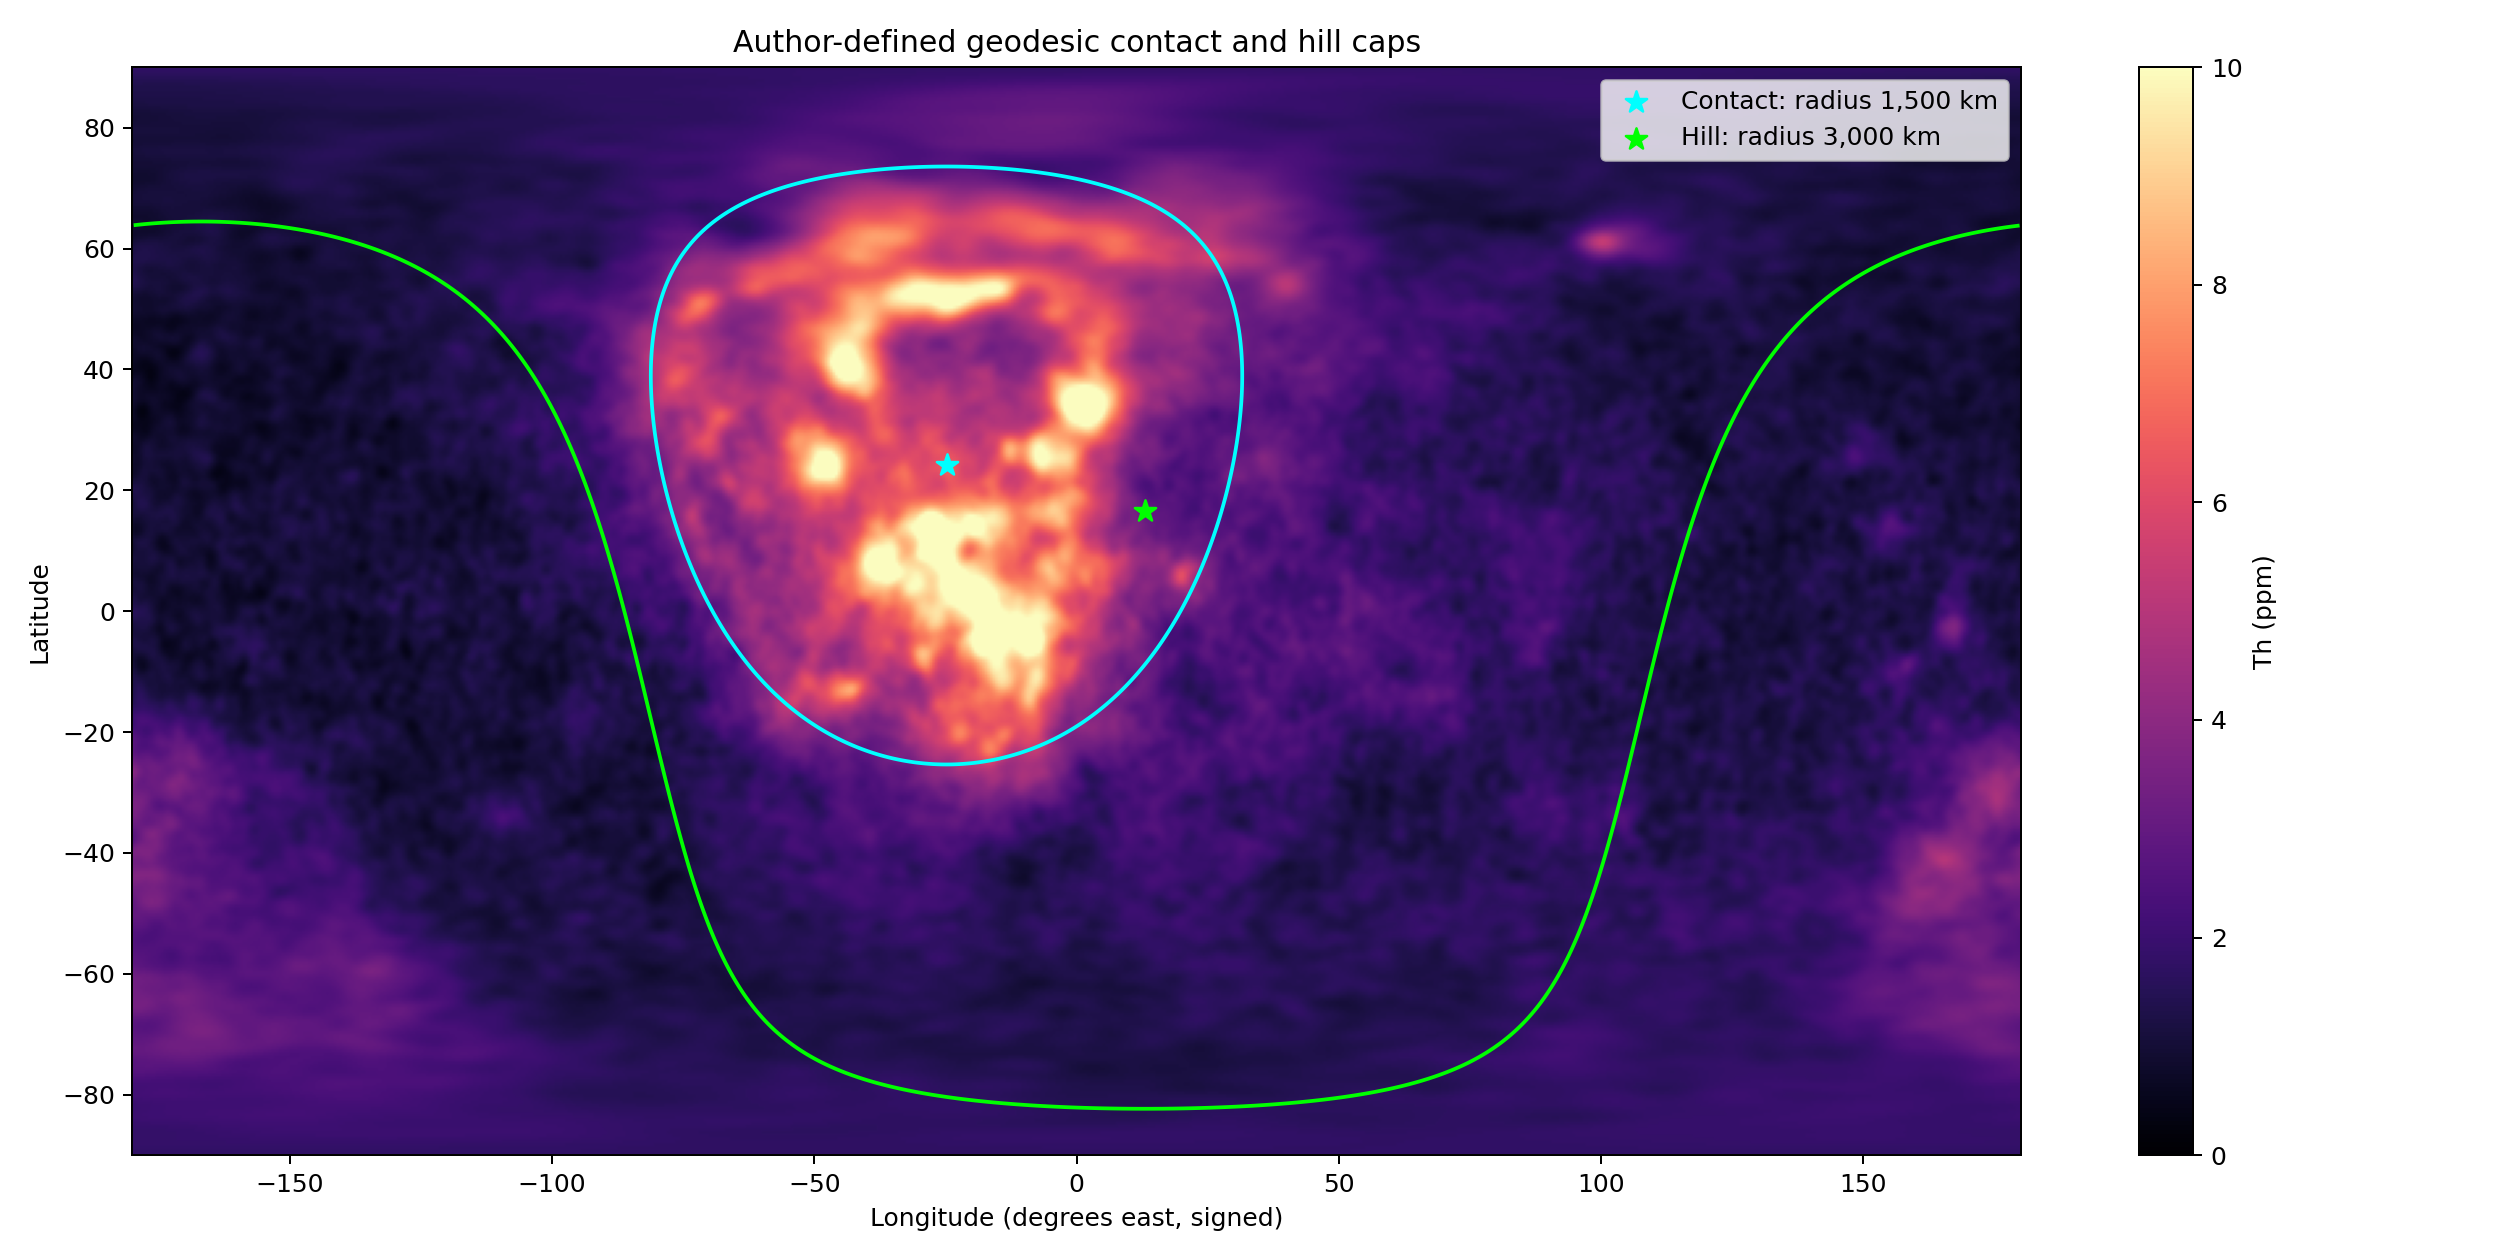
Figure 11 shows the map: the bright thorium of the west of the near side lies inside the cyan circle of the contact, and almost none lies outside the green circle of the hill.
Is the contact the place of the maximum, or only near it? A cap of 1,500 km placed anywhere on the near side west of centre would catch much of the thorium. A specialist would rightly say that holding most of the thorium does not show that the contact is the centre of it. The test is therefore to move the same cap over the whole Moon and see where it catches the most. The cap was centred in turn on 16,200 points, every 2° in latitude and longitude, and the share of the Moon’s excess inside it was computed at each. The test resembles a target drawn on a map before the data are opened, then compared with every other place the same target could have been drawn. The best point lies at 23°N, 334°E and catches 95.14%; the contact centre of Paper 3, 24.1°N, 335.2°E, catches 94.99%. It lies 1.6° (47 km) from the best point and ranks third of the 16,200: only two of all the possible centres do better, and by less than a fifth of a percent of the excess. With caps of 1,000 and 2,000 km it ranks fifth and nineteenth; at every size it lies within the top 0.2% of all centres. The result therefore does not depend on the size chosen for the cap. Moving the cap away from the contact, the share falls steadily: below half at about 50° from it, and to nothing on the far side (Figure 12).
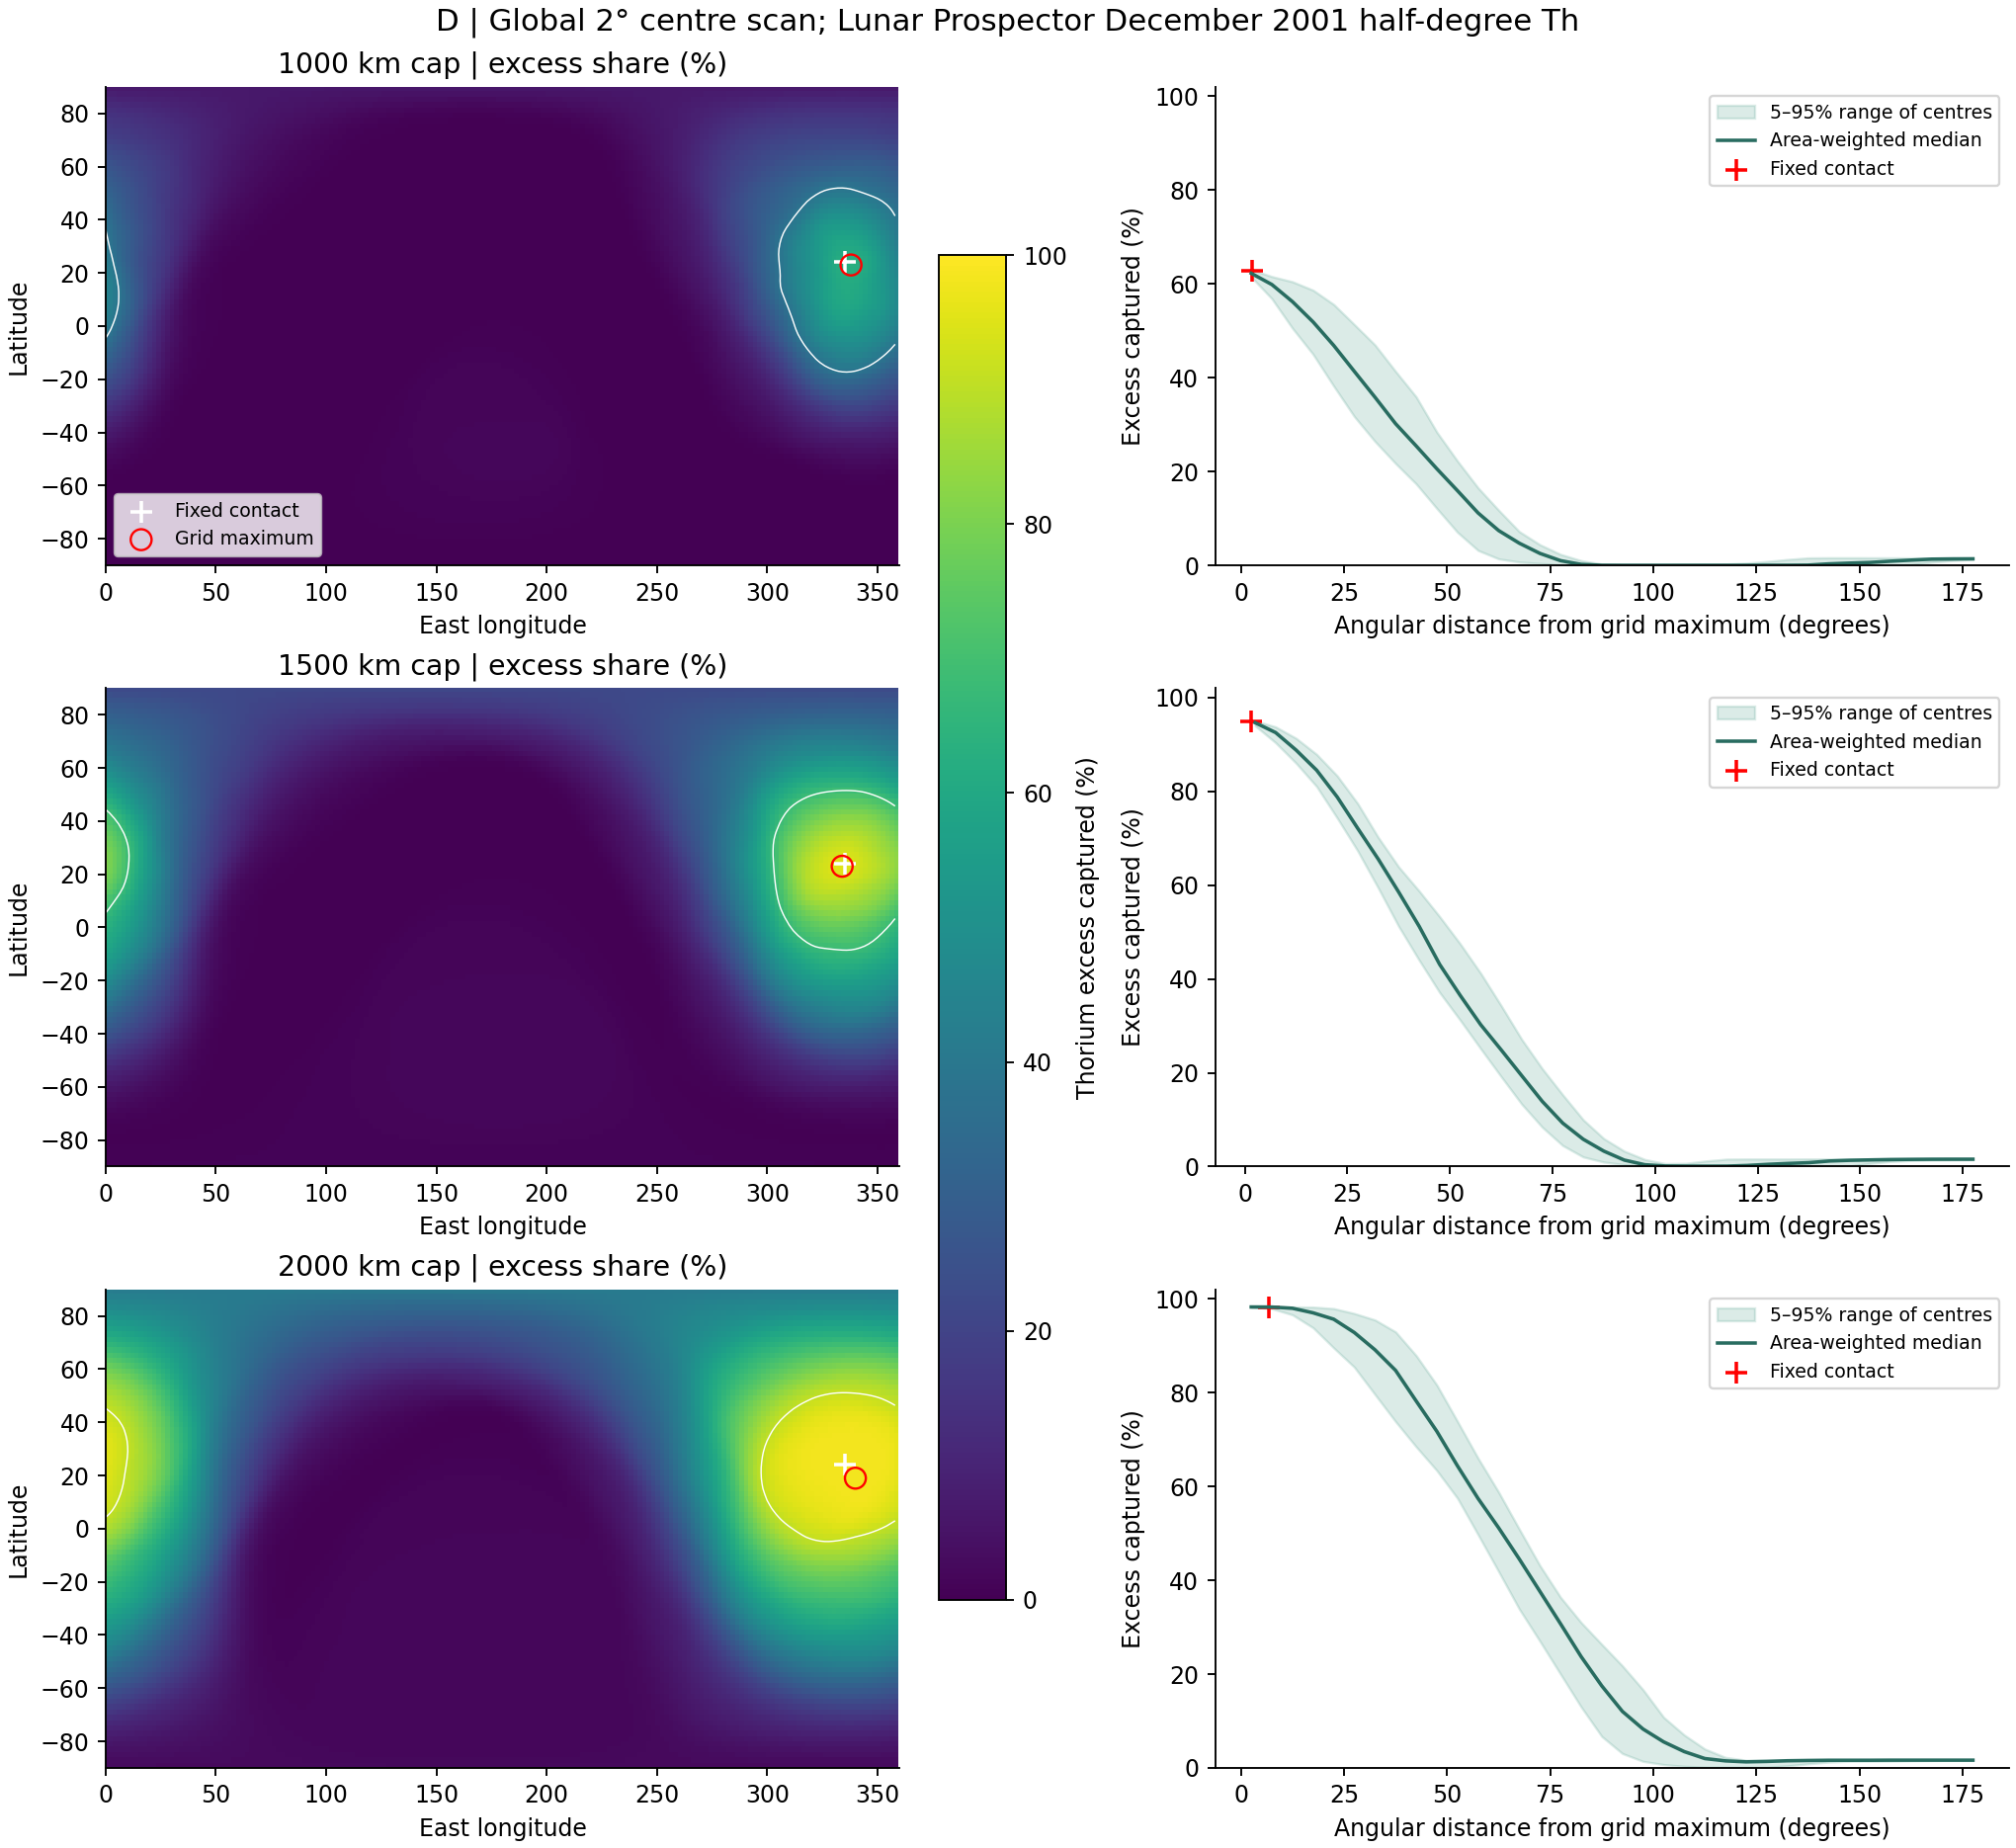
In the left panels of Figure 12 each point of the Moon is coloured by the share a cap centred there would catch; the cross of the contact sits beside the circle of the best point, inside the small white contour of the top 5%. The right panel shows the share falling smoothly with distance from the best point, the shape of a single gathering with one centre.
The phenomenon. The thorium of the Moon is gathered in the west of the near side. The gap in knowledge. The literature reads the gathering as a terrane of the crust, rich in heat-producing elements; the model reads it as the region of the contact, the last 3,000 km that touched the Earth. A cap that holds most of the thorium shows that the contact and the thorium overlap; it does not show that the contact is where the thorium is gathered most, because a cap placed nearby might hold as much or more. The research question: does the contact fixed in Paper 3 hold the Moon’s thorium, and is its centre the place where a cap of its size holds the most?
Lunar Prospector mapped the thorium of the whole Moon from orbit [S4]. The concentration in the west of the near side is named the Procellarum KREEP Terrane: a region of the crust rich in potassium, rare-earth elements and phosphorus (KREEP), read as the last residue of the crystallising magma ocean gathered under the near side [S22]. The magma ocean is the molten outer layer the literature gives the young Moon; as it crystallised, the elements that do not enter crystals were left in its last liquid. In that reading the terrane has no special centre: it is where the residue happened to gather. What is new here: the thorium is read against a centre fixed in Paper 3 before this reading, and that centre is tested against every other possible centre on the Moon.
The thorium was brought by the contact, the region where the Moon last touched the Earth. So a cap of the contact’s size centred on the contact holds almost all the Moon’s excess thorium, and no other centre on the Moon does markedly better.
Type of research: quantitative; shares of the excess and of area, and a scan of the whole Moon. The sample: every half-degree cell of the thorium map, 259,200 cells. The tools: the Lunar Prospector thorium map [S4]; the contact (1,500 km) and the hill (3,000 km) of Paper 3; and code that sums the excess above 3 ppm inside a cap, weighting each cell by its true area on the sphere, for a cap centred on each point of a 2° grid. The rules of the measurement, and the reason for each, are these:
| Rule | Why, in plain words |
|---|---|
| The excess: thorium above 3 ppm | The highlands far from the contact hold about 1.2 ppm; the excess is the thorium that was gathered |
| Area weighting | A cell near the pole is smaller than one at the equator; each counts by its true area |
| The centre fixed before the data | The contact centre comes from Paper 3, so the test cannot have chosen it to fit the thorium |
The contact and the hill were taken as fixed in Paper 3. The share of the excess, the share of the area above 3 ppm and the medians inside and outside were computed for them, and then for caps of 1,000, 1,500 and 2,000 km centred on all 16,200 points of the grid.
The contact. A sixth of the surface (17.5%) holds 95% of the excess and 78% of the area above 3 ppm; the median is 5.39 ppm within the contact and 1.52 outside. The scan. The best centre for a cap of 1,500 km, 23°N 334°E, holds 95.14%; the contact centre holds 94.99% and ranks third of 16,200, 47 km from the best. For caps of 1,000 and 2,000 km it ranks fifth and nineteenth. The fall. The share drops below half at about 50° from the contact and reaches zero on the far side.
Result. The hypothesis is supported: the contact holds almost all the Moon’s excess thorium, and its centre, fixed before the thorium was read, is within 47 km of the best centre on the Moon, third of 16,200. The thorium is gathered around the place where the Moon last touched the Earth. Limitations. The contact of Paper 3 was drawn from the outlines of the near-side basalt, and the thorium of the literature’s terrane lies on the same region; the coincidence of centres is therefore strong but not wholly independent of the basalt. The map resolves about 60 km, and a different reconstruction of the thorium or another threshold could move the best point slightly. Directions for further research. The same scan on the reconstructed thorium maps of finer resolution, and Study 13, which asks where within the contact the thorium lies.
J.4 Within the contact: the maria, the plains and the highland
§J.3 showed that the contact holds the thorium. This section asks where inside the contact it lies, and the answer separates the two kinds of dark ground that the model distinguishes. Four maria lie in the contact: Serenitatis, Imbrium, Copernicus H and Sinus Aestuum. The rest of the contact is of two kinds of ground. One is the highland. The other is the plains of basalt: Oceanus Procellarum, Mare Insularum, Mare Nubium, Mare Cognitum, Mare Frigoris and the like. A plain is the ordinary crust of the section of the pear, melted in place by the general heat of the Earth while the body was attached; it had no channel to depth and no feed dome beneath it (§C.2). A mare is a channel that joined the interior of the Earth to the interior of the Moon, and its area is the core of the feed dome beneath it. Both are dark basalt at the surface; they differ in what lies beneath them, and so in where their last liquid could go.
| Within the contact | Share of its area | Median thorium | Share of the Moon’s excess |
|---|---|---|---|
| The four maria | 11.1% | 3.99 ppm | 5.0% |
| Plains of basalt | 51.8% | 5.62 ppm | 52.4% |
| Highland | 37.1% | 5.48 ppm | 37.6% |
The table divides the contact into its three kinds of ground. The first and last columns should be compared: a kind of ground that holds the share of the excess its area gives it is ordinary for the contact; one that holds less has lost thorium. The blue row, the maria, is the one that falls short.
Within the contact the plains and the highland carry nearly the same thorium, 5.62 and 5.48 ppm, and each holds about the share of the excess that its area gives it. The maria carry far less: 3.99 ppm, and 5% of the excess on 11% of the area, less than half their share. Every mare of the contact is poorer than the ground around it, in a ring from its edge to 150 km beyond:
| Mare of the contact | Mare | Ring around it | Difference |
|---|---|---|---|
| Imbrium | 4.72 ppm | 6.11 ppm | |
| Copernicus H | 8.75 | 9.86 | |
| Sinus Aestuum | 6.73 | 7.78 | |
| Serenitatis | 2.78 | 3.36 |
Each row sets a mare against the ground just around it, so that the comparison is made within one region and the general level of that region cancels. The difference is negative in every row; the blue fades from the largest loss, Imbrium, to the smallest, Serenitatis.
Outside the contact the maria equal the ground around them or exceed it: the median difference is ppm in the hill and beyond it, and the maria poorer than their ring are a minority, 2 of 11 and 8 of 19 (Figure 14). The loss of thorium is therefore a mark of the maria of the contact, not of maria in general.
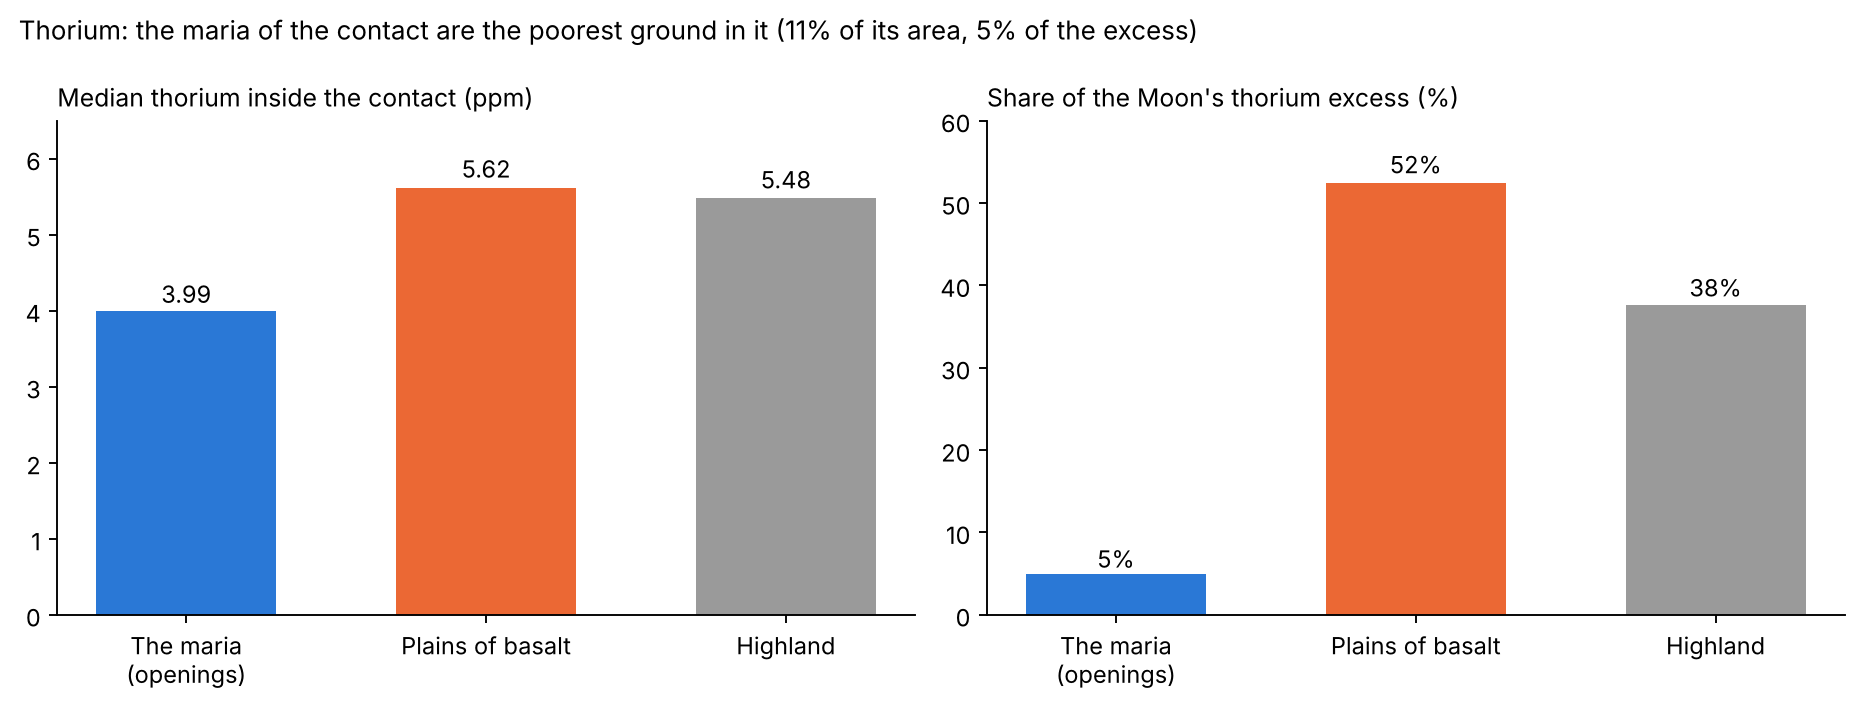
Figure 13 draws the table of terrains: the bar of the maria stands lower than those of the plains and the highland, which are nearly equal.
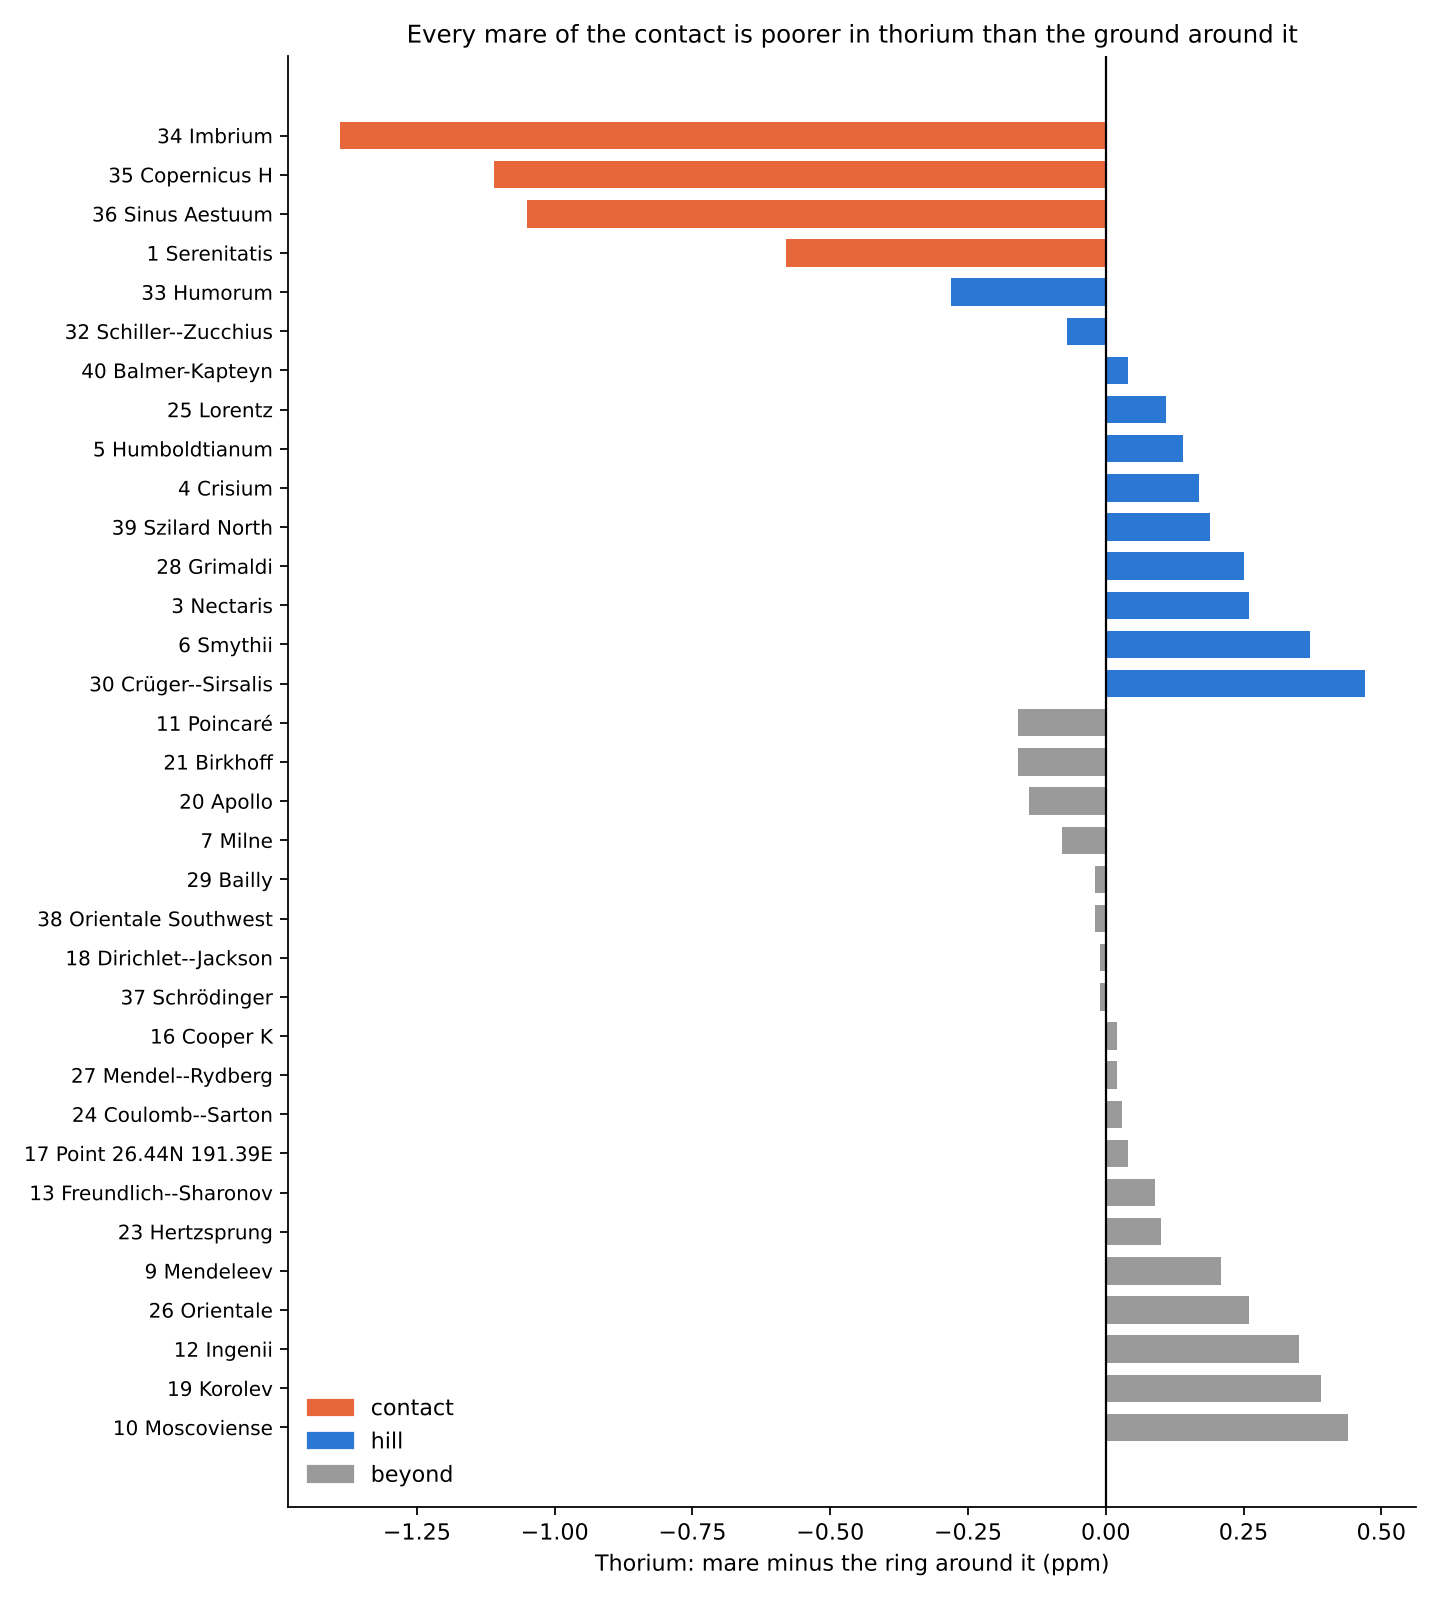
In Figure 14 each mare is one bar, its thorium minus that of its ring. The four orange bars of the contact all fall below zero; the bars of the hill and beyond are spread about zero.
Thorium and titanium together. If the last liquid of a mare drained away, it should have taken thorium with it more strongly than any element that the crystals partly hold. Titanium is such an element. Titanium also stays in the liquid as a melt cools, but less strongly than thorium: once the liquid is rich enough in it, it crystallises with iron as ilmenite and stays. Ilmenite is an oxide of iron and titanium, a common dark mineral of the mare basalts. The two were read pixel by pixel on the floors of the maria and on the plains, titanium on the Kaguya abundance map at 128 pixels per degree and thorium on the Lunar Prospector map, with intervals by resampling cells of 5° by 5°. Resampling means drawing the cells again at random, many times, and recomputing the result each time; the spread of the results gives the 95% interval, the range within which the true value lies in 95 of 100 cases. Thorium is far rarer than titanium, so each is given as a share of its value on the plains, which are the reference: on a plain nothing could leave, for there was no channel, and everything froze together.
| Floors of the maria against the plains | Thorium | TiO | Thorium/TiO, floor against plain |
|---|---|---|---|
| Within the contact | ( to ) | ( to ) | 0.74 (0.60–0.88) |
| Beyond the contact | ( to ) | (0 to ) | 0.71 (0.58–0.91) |
Floors of the contact: 3.95 ppm thorium and 3.44 wt%
TiO;
plains of the contact: 5.63 and 3.61. Floors beyond: 2.14 and 2.78;
plains beyond: 2.43 and 2.25.
Each cell gives how much the floors of the maria differ from the plains of the same zone, with its 95% interval in brackets. The last column divides the two: a ratio of 1 would mean that thorium and titanium left in the same proportion; a ratio below 1 means that thorium left more. The note beneath the table gives the medians from which the shares are computed.
Within the contact the floors of the maria lost a third of the thorium of the plains and kept their titanium: thorium left the floors more strongly than titanium. Mare by mare, the ratio of thorium to titanium against the plains of the contact is 0.56 on Serenitatis, 0.35 on the part of Humorum within the contact and 0.83 on Imbrium; it is higher on the two small maria beside Copernicus, Copernicus H (1.83) and Sinus Aestuum (1.17). Beyond the contact the floors lost an eighth of the thorium of the plains, and carry more titanium than the plains.
How the model reads it. Thorium does not enter the crystals that grow as a melt cools; it stays in the liquid and is gathered in the last of it. Sea water freezing is a fair picture: the ice that forms is nearly fresh, and the salt gathers in the brine that remains. In a mare the melt cooled from its surface inward, and the liquid that remained, carrying the thorium, sank back down the channel toward the interiors of the Moon and the Earth. The mare was left poorer than the ground around it. A plain had no channel: its melted crust froze where it lay and kept its thorium, as the highland did. So the contact as a whole holds the thorium, and within it the channels hold the least.
Titanium went down with the last liquid too, but less: much of it was held in ilmenite and stayed. Within the contact the plains are rich in titanium, and the floors that lost part of theirs equal them. Outside the contact the maria froze fast, and there was little time for the liquid to sink: they lost less thorium, an eighth against a third. The contact lay over the middle of the passage that the pear formed between the Earth’s interior and the Moon, rich in heavy material; the far maria lay at the end of that passage, where the lightest material of the differentiating Earth arrived, and the plains beyond the contact, fed with it, are poor in titanium, so the maria there carry more titanium than their plains. Differentiation is the separation of a body into layers of different composition, the heavy sinking and the light rising; the Earth was differentiating while it fed the body, so the material reaching the far end of the pipe was the lightest.
The phenomenon. The contact holds almost all the Moon’s thorium (Study 10), and within it some dark ground is rich in thorium and some poorer. The gap in knowledge. The basalt of the contact has been read as one kind. In the model it is of two kinds: the maria, channels to depth over a feed dome, and the plains, ordinary crust melted in place. Whether the two carry the same thorium has not been measured. The research question: within the contact, do the maria, the plains of basalt and the highland carry the same thorium, and is each mare richer or poorer than the ground around it; and did thorium leave the floors of the maria more strongly than titanium, which also stays in the liquid but less?
Thorium is an incompatible element: it does not enter the common minerals that crystallise from a melt, and it is concentrated in the last liquid that remains [S24]. In the literature the thorium-rich KREEP is that last liquid of the magma ocean, and the basalts of the near side are rich in it where they rose through it or melted it [S22]. What is new here: the ground of the contact is divided by what lies beneath it — a mare, identified on the gravity gradients over a feed dome, or a plain without one — and the thorium of each is compared with the highland of the same region and with its own surroundings.
In a mare the melt cooled from above, and the last liquid, which carries the thorium, sank back down the channel. So within the contact the maria are poorer in thorium than the plains and the highland, and each mare is poorer than the ground around it; the plains, which had no channel, carry the thorium of the highland. Titanium, held back in ilmenite, left less: against the plains, where nothing could leave, the ratio of thorium to titanium on the floors of the maria is lower, the most within the contact, where the maria stayed liquid the longest.
Type of research: quantitative; medians by terrain, shares of the excess, and each mare against the ground around it. The sample: every half-degree cell of the thorium map; the 34 maria of Appendix A, four of them in the contact. The tools: the Lunar Prospector thorium map [S4], the Kaguya titanium abundance map at 128 pixels per degree [S3], the LROC mare map [S1] for the plains, the feed domes of the GRAIL field (Part C), and code that classifies each cell and reads a ring around each mare. The rules of the classification, and the reason for each, are these:
| Rule | Why, in plain words |
|---|---|
| The area of a mare: the core of its feed dome | The channel lies over the dome; the dome sets its extent |
| A plain: basalt of the LROC map outside every mare | Basalt with no channel beneath it |
| The ring: from the edge of a mare to 150 km beyond, other maria removed | Each mare is compared with the ground beside it, so that the region is the same on both sides |
| Area-weighted medians | Each cell counts by its true area on the sphere |
The maria were fixed on the gravity gradients before the thorium was read. Each cell of the contact was then given its terrain — mare, plain or highland — and each mare was read inside and in its ring.
By terrain. Within the contact the maria hold 3.99 ppm, the plains 5.62 and the highland 5.48. The maria hold 5.0% of the Moon’s excess on 11.1% of the contact’s area; the plains 52.4% on 51.8%; the highland 37.6% on 37.1%. Each mare of the contact. All four are poorer than their ring: Imbrium by 1.39 ppm, Copernicus H by 1.11, Sinus Aestuum by 1.05, Serenitatis by 0.58. Outside the contact. The maria equal or exceed their ring: the median difference is ppm in the hill (11 maria) and beyond it (19 maria). Thorium and titanium. Within the contact the floors carry 30% less thorium than the plains (95% interval 20–39%) and the same titanium (, from to ); the ratio of the two, floor against plain, is 0.74 (0.60–0.88). Beyond the contact the floors carry 12% less thorium (3–19%) and 24% more titanium (0 to 53%); the ratio is 0.71 (0.58–0.91).
Result. The hypothesis is supported: within the contact the maria are the poorest ground in thorium, every mare there is poorer than the ground around it, and the plains carry the thorium of the highland. The thorium that the contact gathered was drawn back down the channels with the last of the melt, more strongly than titanium, which ilmenite held back; within the contact, where the maria stayed liquid the longest, the floors lost a third of their thorium and none of their titanium. Limitations. The contact holds four maria; the titanium map is a calibrated product with a scatter of 0.43 wt% at its calibration sites, and the two maps differ in resolution; outside the contact the ratio is lowered as much as within it, mostly by titanium richer on the floors than on the plains; the thorium map resolves about 60 km, so the edge of a mare mixes with its ring, which, if anything, reduces the measured difference. Directions for further research. The thorium on the reconstructed maps of finer resolution over each mare of the contact, and the ratio of thorium to titanium read mare by mare beyond the contact.
J.5By longitude
The same thorium can be read by the four quarters of the Moon: the near-side sector facing the Earth, the far side opposite it, the leading half, which faces the direction of the Moon’s motion in its orbit, centred at 90°W, and the trailing half, centred at 90°E (§B.2). The near-side sector holds a median of 5.12 ppm, the leading half 3.27, the far side 2.20, the trailing half 2.01; the near side as a whole 2.56 against 1.76 on the far side. The order follows the contact. Its centre, at 335.2°E, lies on the near side and in its western, leading half; the near-side sector, which holds it, is the richest, the leading half next, and the far side and trailing half, which lie away from it, the poorest. The near side as a whole carries about one and a half times the thorium of the far side.
J.6How the model reads thorium
The literature reads the thorium of Procellarum as KREEP, the last residue of a crystallising magma ocean, gathered under the near side and heating it. The model reads it as the mark of the contact: the region where the Moon last touched the Earth, through which the last material passed. Three results carry this reading. The excess is centred on the contact fixed in advance (Study 10). Within the contact the plains of melted crust and the highland carry nearly the same thorium, so the thorium belongs to the region and not to the basalt. And the maria of the contact, the channels to depth, carry the least, because the last liquid, which holds the thorium, sank back down them (Study 13).
The second and third results are those the residue reading does not foresee. In that reading the basalts of the near side are rich in thorium where they rose through the residue or melted it (Study 13, Step 2); it gives no reason for the dark ground over the channels to be the poorest of the region. Within the contact the measured order is the one the model gives: plains and highland alike, the maria lowest.
J.7 The foreign mass of the basins of the maria
The last element of this Part tests the other reading of the maria directly. In the literature the basins of the maria were dug by large bodies from outside, and such bodies leave part of their own mass behind. That mass carries siderophile elements — the iron-loving elements, such as iridium, osmium and ruthenium, which follow metal — in proportions that match a known class of meteorite. Chondrites are the commonest class, stony meteorites whose proportions of these elements are well known; a basin dug by such a body should carry its fingerprint.
Paper 6 (§L.5) asked what foreign mass the crater record requires, read as external impacting bodies, and found the crust holding less than the visible craters alone require. The basins of the maria carry the largest part of it after South Pole–Aitken.
| Test | Result | The literature reads | The model reads | Conclusion |
|---|---|---|---|---|
| Foreign mass for the basins of the maria | About kg at 18 km/s; Imbrium alone by scaling and by its proposed body of 250 km [S12] | The bodies that dug the basins | No body: the basins are openings | The mass must be found |
| Siderophile ratios of the Imbrium melts | Match no chondrite group [S13] | An unknown body, or metal of a planetesimal core | Known terrestrial material, at its stage of differentiation | Explained without a new kind of body |
| Siderophile elements added by the late basins | The bulk was in the crust before Imbrium and Serenitatis, which mostly mixed it [S13] | The late basins added little | There was nothing foreign to add | As the model predicts |
The table sets three results of the literature side by side, each with the reading of the literature and of the model. The last column is coloured by how each result stands for the model: the first is a mass the impact reading requires and must find, and the green rows are results the model explains directly, the darker green the one it predicts.
The numbers of the first row need a word. A crater of known size requires a body of a certain mass, given its speed; 18 km/s is the speed used in Paper 6 for bodies reaching the Moon. At that speed the basins of the maria together require about kg, ten billion billion kilograms. For Imbrium two estimates are given: kg from the scaling of crater size to body mass, and kg from the body of 250 km that the literature proposes for it.
A body of the size the literature gives to Imbrium would leave, at the literature’s own retention of a fifth, some kg of foreign material near the basin, and kg by the scaling estimate (an earlier version gave some kg for both); the melts of the basin carry ratios that match no known body, and the late basins added little to the crust’s siderophile elements. The retention is the share of a striking body’s mass that stays on the Moon rather than escaping as vapour and fast debris. In the model the basins of the maria are openings, and there was no body to leave its mass.
The phenomenon. The basins of the maria are read in the literature as dug by the largest bodies that struck the Moon after South Pole–Aitken. The gap in knowledge. Such bodies should have left the largest share of foreign mass near the basins; how much they require, and what the melts of the basins carry, has not been set side by side. The research question: what foreign mass do the basins of the maria require, read as dug by bodies from outside, and do the melts of the basins carry it?
The body that dug Imbrium is estimated at about 250 km [S12]; the siderophile elements of the Imbrium melts match no known group of chondrites, and the bulk of the crust’s siderophile elements was there before Imbrium and Serenitatis [S13]; the retained fraction and the budget of the crust are given in [S23]. What is new here: the mass is computed for the basins of the maria together, and the literature’s own results on their melts are set in one table against it.
The basins of the maria are openings, so no body left its mass there: the melts of the basins carry no foreign signature of the mass the literature requires, and the late basins added nothing foreign to the crust.
Type of research: quantitative by calculation, with a review of the published geochemistry. The sample: the basins of the maria; the published siderophile data of the Imbrium and Serenitatis melts. The tools: the scaling of crater size to body mass used in Paper 6 (Study 8), at 18 km/s, and the literature’s retention of a fifth [S23].
The mass was computed for each basin of the maria; the siderophile results were taken from the literature as published. The values are the table of §J.7.
The mass. The basins of the maria require about kg; Imbrium alone kg by scaling, and kg for the body of 250 km proposed for it. At a fifth retained, to kg of foreign material should lie near Imbrium. The melts. Their siderophile ratios match no chondrite group, and the late basins mixed what was already in the crust rather than adding to it.
Result. The hypothesis is supported by the literature’s own results: the melts of the basins carry no known foreign body, and the late basins added little. Limitations. The mass rests on an assumed velocity and retained fraction; the melts are sampled at few sites, mostly of Imbrium; the review relies on published analyses, not on new ones. Directions for further research. Ruthenium and osmium isotopes of the melts of each basin of the maria, against the meteoritic mass of a body of the literature’s size. Isotopes are forms of one element that differ in weight; the proportions of the isotopes of ruthenium and osmium can differ between meteoritic and terrestrial material, and so can tell foreign mass from the Earth’s own.
What we now have. The chemistry tells the same history as the craters and the gravity. The iron and titanium around each mare trace the material it threw, far and light first, near and heavy last. The thorium is gathered on the contact, fixed in advance, and within it the maria, whose last liquid drained down their channels, hold the least. And the basins of the maria do not carry the foreign mass that bodies from outside would have left.
Dating
a basalt age is not the age of an opening. The approach: the clocks of an opening are named apart, the radiometric ages read as cooling, and the relative order of the maria taken from what lies on their floors.
The previous Parts placed the openings in space and read their floors, their chemistry and their craters. This Part asks when. The question matters because the usual answer, the age of the basalt brought back by the missions, is often taken as the age of the mare itself; if it were, a basalt of 2.0 Gyr would mean an opening formed 2.0 Gyr ago, long after the Moon left the Earth. The model separates the two, and this Part states how.
K.1Five clocks
Every opening carries five times that need not agree: , when the opening formed; , when it was exposed to space; , when it began to throw; , when it sealed; and , the age of the surface seen today. An old opening can carry a young surface, and a basalt age is not the age of the opening.
The five are easiest to keep apart with a picture of a well. A well is dug at one time (); its cover is lifted later (); water first rises in it later still (); it is capped when it runs dry (); and the puddle that dries at its mouth last of all is what a visitor finds today (). A sample taken from that puddle dates the puddle, not the digging. In the model the order is fixed by the construction: an opening forms under the cover, is exposed when the contact retreats past it (Part I), throws while it is fed, and seals when the feed stops; the condition that ties two of these clocks together is eq. (4), (§H.3).
What the radiometric ages measure. The basalts of the Apollo sites date to 3.1–3.9 Gyr, those of Chang’e-5 to about 2.0 Gyr [S8] and those of Chang’e-6, on the far side, to about 2.8 Gyr [S9]. The model reads them as cooling. A radiometric clock counts the daughter atoms made by the decay of a parent atom; it starts only when the material has cooled enough to hold those daughter atoms in place. Before that, they escape or are mixed, and the clock stays at zero. This is what is meant when a sample is said to record when its system “closed”. The heat of the Moon’s interior and of its core took a long time to leave, and a sample records when its system closed, not when its opening formed. An opening formed during the construction, which took about 600 Myr and ended with release at 3.873 Ga, can therefore carry on its surface a basalt that closed hundreds of millions of years or more after release, as the heat below it slowly left. The oldest Apollo ages, near 3.9 Gyr, lie close to release; the younger ones, and the 2.8 and 2.0 Gyr of the Chinese missions, record later cooling of material that stayed hot. The samples are shallow; the identity of the deep material is erased with depth, but the geometry remains. A sample tells what the top of the opening was when it last cooled; the shape of the opening and the dome beneath it, read in gravity (Parts C–E), tell what the opening was.
A specialist may object that a basalt is an erupted lava and that its age is the age of the eruption. In the model the two coincide only for the last liquid that reached the surface and froze there; that is the age of , or at most of . It is not the age of , which is the subject of this paper.
Dating without isotopes. Two relative clocks are kept: superposition — what lies on what — which gives order without years; and the density of craters, compared between surfaces as long as it is not converted to years. Superposition is the rule that a layer lying on another is the younger of the two, as the top sheet of a pile of papers was put down last. The density of craters is the number of craters per unit area: a surface that has been exposed longer has gathered more, so two surfaces can be ranked by it. The conversion to years assumes a constant flux of bodies from outside, which is exactly what Paper 6 replaces, and it is not used. In Paper 6 almost all craters are made by returning material, whose rate rose and fell with the activity of the openings and of the Earth; a count of craters therefore orders surfaces, but a fixed rate of arrival cannot turn it into years.
K.2The relative order of the maria
The order in which the maria sealed is read from what lies on them, not from the age of their basalt. Three records give it, each from an earlier Part.
The floors of the maria of the contact are the cleanest of small craters, together: they sealed last (§F.5). A floor starts to gather craters only once it has frozen, so the floor with the fewest craters froze last. The large maria of the near side, Imbrium and Serenitatis, carry thirteen to eighteen times fewer craters of 20 km and more than the highlands (Procellarum, a plain, is not counted): they froze after most of the returning material had landed (§I.5). The buried openings of the far side are older than the cover above them, and the cover carries the craters of its time (§D.5): here superposition orders the opening before the layer that buried it.
Together these give an order without years: the buried far-side openings first, then the open maria of the belt, and the maria of the contact last. The test of a radiometric order is stated in §M.3: the youngest basalt of each mare against its distance from a centre fixed before the data, with thorium held fixed. Thorium is held fixed because it is a heat-producing element (§J.3): a mare rich in it could stay hot longer for that reason alone, and its youngest basalt would then be young for a reason unrelated to its place. Only once that effect is removed can the distance from the centre be judged.
What we now have is a way to order the openings that does not depend on the ages of their surface basalts: those ages date cooling, and the order of sealing is read from the floors.
Statistics
every comparison of the paper depends on what is compared with what. The approach: the data, the masks and the reproduction are stated, and every measured result is gathered in one table with its sample and its uncertainty.
This Part gathers, in one place, how the numbers of the paper were obtained and how far they can be trusted. A reader who doubts a result should be able to find here what was compared with what, on which sample, and how large the uncertainty is.
L.1Data and masks
The products are those of the environment table. Every comparison of the ground is like for like: the maria are removed from both sides, and the comparison says so. This rule matters because the maria are themselves poor in craters and rich in iron. If a measurement around a mare included part of a mare floor while its control did not, the mare would push the result one way for a reason that has nothing to do with the question; removing the maria from both sides, the sample and its control, makes the two sides comparable. A “mask” is this list of areas left out of a count.
Areas are computed on the sphere; craters are assigned by their centres; a unit’s floor is the area inside its polygon. Computing on the sphere avoids the stretching of flat map projections, in which an area near the poles looks larger than it is. A crater that straddles the edge of a floor is counted where its centre lies, so no crater is counted twice. The feed domes are taken from the Bouguer field at degrees 6–660, with an independent check at 6–900. The Bouguer field is the gravity field after the pull of the visible topography has been removed, so that what is left shows the dense and light bodies beneath the surface; the “degrees” set the finest detail kept, and a higher degree keeps smaller features. A dome found at both settings is not an artefact of one choice of filter.
L.2 Reproduction
The scripts that produce every table of this paper are listed in the Code availability section, with their inputs. The earlier counts of craters around the maria, made before this paper, are reproduced with new code before they are used; where a value could not be reproduced, it is not used. Any number in the paper can thus be recomputed by a reader from the deposited inputs.
L.3The measured results, in one table
The table gathers every measured result of the paper with the section that carries it. Each row gives what was measured, on how many units, the result, and its uncertainty. Read the last column as follows. A range marked “95%” is an interval that holds the true value in 95 of every 100 repetitions of the measurement; where it does not cross zero, the effect has a definite sign. A is the probability of a result at least as strong as the one measured if there were no effect at all; means 2 times in 100, and a small is what “beyond chance” means in this paper. The named tests each answer one kind of question:
the sign test asks only how many cases went one way: if centre and margin were equally likely to be the higher, 10 of 12 or more would happen about 2 times in 100, and 16 of 16 about once in 65,000 ();
the rank correlation asks whether two measures rise and fall together: it runs from to , and means that the stronger the dome, the lower the centre, fairly consistently across the 12 maria;
the Mann–Whitney test compares two groups by ranking all their values together and asking whether one group sits higher in the ranking, so a few extreme values cannot drive it;
Fisher’s exact test compares two shares, here the share of sharp craters on two sets of floors, and gives the exact probability of a split at least as uneven by chance.
The comparisons in which iron or crater density is read around the maria remove the maria from both sides, as §L.1 requires.
| Measure | Sample | Result | Uncertainty |
|---|---|---|---|
| Maria on a feed dome (§C.5) | 34 maria, 73 domes | 33 of 34 | — |
| FeO, buried dome core minus surroundings (§D.5) | 44 domes | wt% | 95%: to |
| FeO, dome under a mare (§D.5) | matched | wt% | to |
| Thorium, buried dome core minus surroundings (§D.5) | 44 domes | ppm | to |
| Centre against margin, open maria (§E.2) | 12 maria | 10 of 12 lower; median m | sign test |
| Centre height against dome strength (§E.2) | 12 open maria | ||
| One level per unit (§F.1) | 189 units | 188 | — |
| Floor below rim and land (§F.1) | 16 maria | 16 of 16; 3.4 and 1.6 km | sign test |
| Collar around the far maria (§F.3) | 27 maria, 170 controls | m against m | Mann–Whitney |
| Iron of the ground, 0–25 against 100–150 km (§J.1) | 6 maria | 6.9 against 3.1 wt% FeO; 3.4 at 300–600 km | controls 2.3 |
| Crater minus its ground, 0–50 km, maria (§C.7) | 1,059 craters, 5,922 controls | wt% FeO | 95%: to ; controls |
| Craters of 2–5 km on floors against the land (§F.5) | 10 open maria | median 8% (4–23%) | — |
| Craters of 10 km and more on floors, beyond against contact (§F.6) | 10 open maria | at least | |
| Craters of 2–5 km, mare floors against plains, contact (§G.2) | near side | 263 against 836 per million km | — |
| Sharp craters of 3–10 km, floors of the contact against beyond (§G.2) | 275 craters | 82% against 56% | Fisher |
| Rim missing toward the plain, craters of 40 km and more (§G.6) | plains of the contact against beyond | against 0% | 95%: 10 to 35; to 0 |
| Thorium above 3 ppm in the contact (§J.3) | whole Moon | 95.0% on 17.5% of the area; 78% of the area above 3 ppm | — |
| Contact centre among all centres (§J.3) | 16,200 caps of 1,500 km | 3rd; 47 km from the best | top 0.02% |
| Thorium within the contact: maria / plains / highland (§J.4) | all cells | 3.99 / 5.62 / 5.48 ppm | — |
| Maria of the contact against their ring (§J.4) | 4 maria | all poorer, by 0.58–1.39 ppm | — |
Three rows show how the table reads. In the second, the iron over the 44 buried domes differs from the surroundings by wt%, and the interval, to , contains zero: over the buried domes the surface is the same as the ground around them, as a cover laid over them requires; the third row, for domes under a mare, has an interval wholly above zero. In the row of the contact centre, “top 0.02%” follows from ranking third of 16,200: three in 16,200 is about two in ten thousand. In the row of the floors beyond against the contact, “at least ” is the lower bound, met in 97 of every 100 resamplings (§F.6), of a ratio whose measured value is .
Intervals are bootstrap intervals as stated in each source report; they resample units, craters or regions and do not model the spatial correlation between neighbours. A bootstrap interval is found by drawing the sample again many times from itself, with replacement, and recomputing the result each time; the spread of the recomputed results gives the interval. Neighbouring craters or cells on the Moon are not fully independent, and an interval that treats them as independent can be somewhat narrower than the truth; where the source used cells of 5° by 5° as the unit of resampling, clusters are allowed for. Where several candidates were tested, as for the last scatterer, the single best result is not counted as a finding. The reason is that among many candidates one will look best by chance alone, as among many coins tossed ten times one will show nine heads; a result is counted only when it was fixed before the data or holds across the candidates.
Predictions and tests
a model is defined by what it predicts and by how each prediction is measured. The approach: what the measurements changed during the work is set apart, and each claim is listed with its test.
This Part gathers the outcome of the paper’s studies and the predictions they test. It has three sections: the ideas the measurements changed along the way (§M.1), the status of each study at a glance (§M.2), and each prediction with its test (§M.3).
M.1What the measurements changed
Four ideas were held during the work and were changed by what was measured. They are set apart here so that the reader sees which readings were tested and dropped, and what replaced them. Each row gives the idea, the measurement that changed it, and the reading that took its place.
| Idea | What was measured | What it changed |
|---|---|---|
| A simple peak of craters on every rim | No general ring of small craters on the rims, maria removed on both sides | The rim ring is a property of the volatile-rich maria, not of all (§M.3) |
| A moat along the walls of the maria | The lowest part of the floor at a median of 0.57 of the radius; next to the wall in none of 16 | The floor sinks inward of the wall, over the dome (§E.2, F.1) |
| A lava flow building the margins of the far maria | Basalt on 0–7% of the ring around them | The margins were built by layers of the mare’s own returning material (§F.3) |
| Mare area as a measure of ejection | Area does not measure what was thrown | The openings are counted, not the basalt (Part C) |
The second row shows the kind of change involved: a moat would put the lowest part of the floor next to the wall, at a radius near 1; the measured median of 0.57 puts it about halfway in, over the dome, and this is what led to the reading of a centre that sank (§E.2).
M.2The studies in one table
Each study is given its light: green where the hypothesis held in full, amber where part of it held and part did not, red where it was not supported. What did not hold is stated in its own study and gathered here.
How to read the light. The light judges the hypothesis of the study as it was stated before the measurement, not the model as a whole. Green (light green in the table) means that the hypothesis held in full on the measured sample. The text beside a green light may still name a limit — a small sample, an exception with its stated cause, or a sub-test that did not separate — when that limit does not contradict the hypothesis. Amber (orange in the table) means that the hypothesis held in one part and not in another; the part that did not hold is named in the same row. Red would mean that the hypothesis was not supported; no study of this paper is red. Of the fifteen studies, thirteen are green and two are amber. The studies are numbered 1 to 16; Study 14 was cancelled, and the other numbers are kept as they are.
| Light | Study | What held, and what did not |
|---|---|---|
| 1. The maria on the feed domes | 33 of 34 on a dome, far beyond chance. Ingenii, over South Pole–Aitken, has no dome of its own | |
| 2. The source test | The craters carry the iron of their ground, falling with distance. The plains carry a halo as well, of their spilled melt, which falls to the controls far from them | |
| 3. Basin or crater: the jump of the crust | Held | |
| 4. The buried domes | Held | |
| 5. The centre sank over the dome | 10 of 12 open maria; Serenitatis and Imbrium, held up by the pull of the Earth, are the two exceptions | |
| 6. One floor | 16 of 16 one level, below rim and land; the maria of the contact at the level of their plains. Serenitatis lies below its plains | |
| 7. Clean floors | Every floor cleaner than its land at every size | |
| 8. Size and state | Craters vanished into the floors; melted share rises with size; sharp small craters on the contact. The large floors of the far maria are few | |
| 9. Rings of iron and titanium | The excess of the maria reaches 600 km. The two smaller plains lie among other basalt and stay high | |
| 10. Thorium and the contact | The contact, fixed in advance, third of 16,200 centres | |
| 11. The foreign mass | Held | |
| 12. The order of freezing | Ordered at every size; at 1–2 km only weakly; at 20–40 km the three small floors beyond carry none | |
| 13. Thorium and titanium | Thorium: every mare of the contact poorer than its ground, the floors a third poorer than their plains. Titanium: the ratio of thorium to titanium is lowered beyond the contact as much as within it, there by titanium richer on the floors; Imbrium alone does not separate, Copernicus H is the opposite | |
| 15. The plains of the contact | The rim lost, and the surviving crest blunted, on the side of the hot plain only in the contact. The floors near the ground level do not separate the plains of the contact from those beyond; the matched comparison of crest shape rests on four pairs; the craters on Imbrium are few | |
| 16. The collar of the far maria | Around the far maria, and most around the buried ones, against the control. Around the open far maria alone the collar does not separate from the control |
The two amber rows show what “part held” means. In Study 13 the thorium part held: every mare of the contact is poorer in thorium than the ground around it. The titanium part, which expected the ratio of thorium to titanium to fall more within the contact than beyond it, did not separate the two zones. In Study 16 the collar stands above the control around the far maria taken together and most clearly around the buried ones; around the open far maria alone, 10 maria with a median of 207 m (§F.3), it does not separate from the control.
M.3Predictions and tests
Each row of the table states a claim of the model and the measurement that tests it. The tests are written so that a reader with the public data can carry them out; several have been carried out in this paper (the sections are given), and the others are open.
| Prediction | Test |
|---|---|
| A mare is an opening over a feed dome | Every round gravity high of the field against the cover above it (§C.3, D.4) |
| The floor sank over the dome | Height of the centre against the strength of the dome (§E.2) |
| The maria are the source | Iron and titanium of the ground against distance from the mare (§C.7, J.1) |
| The rim ring of the volatile-rich maria | Small craters on the rim, maria removed on both sides, against a measured volatile content (§F.3) |
| The last scatterer is the Earth | Small craters on the smooth floors against distance from the contact, rays and secondaries removed (§F.6) |
| Gradual exposure within one mare | Preservation of craters, filling and structure across a large mare, in the direction of exposure (§I.3) |
| The character of an opening by its zone | Mascon with ring in the belt, mascon without ring in the contact (§D.6) |
| The order of sealing | The youngest basalt of each mare against its angular distance from a centre fixed before the data, with thorium held fixed |
| The thorium of the contact | The share of the excess in caps centred on every point of the Moon; within the contact, openings, plains and highland apart (§J.3, J.4) |
| No foreign mass in the basins | Siderophile elements of the melts of each basin, by their isotopes (§J.7) |
| The engine | Critical flux and times of sealing against the times of exposure, eq. (4) (§H.3) |
| Heat from below on the plains of the contact (§G.6) | Crest shape in a matched sample of the contact and beyond, of equal interior depth |
Discussion
the records of this paper must tell one process. The approach: they are drawn together, set against the explanations of the literature, and the contribution stated.
The Parts before this one each read one record: gravity, the height of the floors, the craters, the chemistry. This Part asks whether they tell one story, how that story compares with the explanations already in the literature, and what in it is new.
N.1 The unified picture
One feed system, seen in five records: the gravity of the domes, the shape of the floors, the craters on and around them, the iron and titanium of the ground, and the thorium. The openings were exposed in an order set by the narrowing contact; each stood over a feed dome through which the material rose. While open, most openings threw the material that made the craters around them and laid the veneer of their iron over the land, their floors standing at the height of their rims and spraying; Imbrium and Serenitatis did not eject (Serenitatis only slight popping). When the feed stopped, the floor froze as one level, and the centre sank over the dense, iron-rich dome; the candidate causes are its weight, suction and, mainly, thermal contraction, stronger the larger the mass, and they are still to be tested. Most of the far side’s openings worked early and sealed as the pear grew and less of the Earth’s heat reached them; they were then covered by the layers of sial and returning material that built the far side. On the near side the openings were open passages through which the Earth’s pressure passed, and the Earth’s heat kept them hot while the body was attached; at release the ejections stopped, and the floors froze slowly from the outside inward; the contact, the last to let go, holds the thorium.
The picture can be followed as one sequence in time. As the tip of the pear narrowed, the region still joined to the Earth shrank, and the openings outside it were exposed one band after another, the far side first and the contact last (Part I). Each was a channel over a dome: material rose and, at most openings, was thrown out and landed as the returning material. When an opening stopped being fed, its liquid froze flat, as a lake freezes, and the centre sank over the dense dome beneath, by its weight, by suction or, mainly, by thermal contraction. On the far side most openings threw early and sealed as the pear grew and less of the Earth’s heat reached them; afterwards the layers built on the far side covered them, together with the craters of their time. On the near side the openings passed the Earth’s pressure, and the Earth’s heat kept them hot until release; then they froze slowly from the outside inward, over hundreds of millions of years to 1–2 billion.
N.2Explanations of the literature
The table sets each of the main explanations in the literature against what it accounts for and what it leaves without an account. The last column is the one to read: it lists the observations of this paper that the explanation does not reach.
| Explanation | What it explains | What it leaves |
|---|---|---|
| A basin of an external impacting body, flooded later | The round basins and their mascons | The foreign mass of the bodies, which the crust does not hold; the 44 domes with no basin seen |
| The heat of KREEP under Procellarum | The thorium and the young basalts of the near side | Thorium shared by basalt and highland within the contact; a far-side basalt of 2.8 Gyr without thorium |
| Volcanism ruled by basins | Basalt in the low places | One level in every unit; centres sunk only over strong domes |
A mascon is a concentration of mass beneath a basin, seen as a gravity high. KREEP is the literature’s name for material rich in potassium (K), the rare earth elements (REE) and phosphorus (P), read as the last residue of a crystallising magma ocean and carrying most of the thorium (§J.6). The KREEP row shows how the table works: if the heat of KREEP drove the young near-side basalts, thorium should follow the basalt; within the contact it does not (§J.4), and the Chang’e-6 basalt of 2.8 Gyr on the far side formed without it.
The concentration of the maria on the near side and its thin crust are explained by both readings, and a test that shows only that the maria lie on the near side decides nothing. A test decides between two readings only where they predict different results. The tests that decide are the buried domes, the floors over them, the iron rings and the foreign mass: an external body leaves no buried dome without a basin, does not make a floor one level that sinks only over a strong dome, does not lay a ring of iron that falls with distance from the mare, and does leave its metal in the melt.
N.3What exists and what is new
Secondary craters, the transfer of material and the asymmetry of the crust are known. Secondary craters are those made by material thrown out of a larger crater and landing again; the transfer of material across the Moon’s surface, and the thinner crust of the near side, are long established. New here: the mare defined as an opening over a feed dome, and counted so; the buried openings of the far side found in gravity and read with the cover above them; the floor that sank over its dome; the mare as the measured source of the returning material; and the thorium of the contact.
Conclusions
what the paper has shown, in order. The approach: one line for each result, with the part that carries it. Each conclusion below states first what was found and then what it means for the picture of the maria; the part or section named in brackets is where the measurement and its test are given in full.
The paper set out to answer one question: what is a mare, if not a basin dug by a body from outside and flooded later by lava? Its answer is that a mare is an opening over a feed dome, and the parts of the paper have tested that answer in five independent records — gravity, the height of the floors, the craters on and around the floors, the iron and titanium of the ground, and the thorium. The eight conclusions below follow that order, from what a mare is to where its material went and what the competing reading would require.
O.1What the paper has shown
A mare is an opening over a feed dome; the basalt is what remains on its surface (Part A, C). A feed dome is the body pushed up from a subsurface focus beneath the opening; through it material rose into the mare and, at most openings, was thrown out and partly came back to the surface as returning material (Imbrium and Serenitatis did not eject; Serenitatis only slight popping). What it means: the dark basalt plain that the literature counts as “the mare” is only the last layer left on the top of the opening, not the structure itself. A mare is therefore found by what lies beneath it, not by the colour of its surface.
Counted as openings, the maria are not where the basalt is: 73 feed domes in gravity, 44 of them buried, 36 on the far side; 33 of the 34 maria identified on the gravity gradients sit on a dome (Part C, D). The feed domes are round highs of the Bouguer gravity field — the field left after the pull of the visible topography is removed, so that it shows dense material below the surface. The 34 maria are those of Appendix A; the one that does not sit on a dome is Ingenii, whose dome was cooked away under South Pole–Aitken. In 20,000 sets of 34 points placed at random, not one reached 33 (Study 1). The crustal test of §D.2 was made on the 36 points the author marked by eye; Appendix A explains how these marks relate to the 34 maria. Under the centre of an opening the crust is thinner than in the ring around it, in 29 of the 36 marked openings against 4 of 169 ordinary craters (Study 3). What it means: the basalt is a poor guide to where the openings are. Most feed domes carry no basalt, and most of these lie on the far side; the difference between the near side and the far side is a difference of what covers the openings, not of how many there are.
Over the buried domes iron and thorium equal the land around them and the crust is thicker by 8–13 km: the layers covered them, with their craters (§D.5). What it means: a buried dome carries on its surface the same layer as the land around it, and the extra crust above it is the thickness of that layer. These openings were active early, were then covered, and the craters made in their time were covered with them. The far side, rich in buried domes, records strong activity of openings in the early stages.
Every floor is one level, about 3 km below its rim (median 3.4 km) and a median 1.6 km below the land around it; the centre of an open mare sank over its dome in 10 of 12, the more the stronger the dome; the two that did not are the large maria of the contact, which froze under the Earth’s pull (Parts E, F). The floor of each mare is one surface, frozen like a lake; in all 16 floors measured it lies below its rim and below its land, which by chance would happen once in 65,000. On the open maria the centre stands lower than the margin (median m), and the rank correlation between the strength of the dome and the height of the centre is . What it means: the floor did not build up flow by flow from outside; it froze as one body over its dome, and the centre sank over the dense, iron-rich dome beneath it; the candidate causes, its weight, suction and, mainly, thermal contraction, are still to be tested. Serenitatis and Imbrium, the exceptions, lie in the contact, where the Earth’s pull held the near side outward while they froze.
The maria are the source of the returning material: the ground around each carries its iron and titanium, from 6.9 to 3.1 wt% FeO within 150 km, with an excess out to 600 km; beside the plains the excess is their spilled melt and does not reach as far (Part C, J). The ground far from any mare, the control, holds about 2.3 wt% FeO; around the six maria the iron stays above that level all the way to 600 km. Around the plain of Procellarum the iron falls back to the level of the controls by 300–600 km. What it means: material thrown out of each mare came down on the ground around it, thickest near the mare and thinning with distance — the mark of a source, not of a target. A plain, which had no channel to depth, carries only the melt that spilled from its edge, and that does not travel far.
The floors of the open maria are clean: a twelfth of the craters of 2–5 km of the land around them; the cleanest are the maria of the contact (§F.5). The comparison is like for like: the basalt is removed from the land, and the ray fields of young craters are removed from both sides. What it means: an open mare melts or holds what lands on it and keeps no craters; a floor gathers craters only after it froze. The number of craters on a floor therefore orders the floors by when they froze, and the maria of the contact, Imbrium and Serenitatis, froze last. The craters they carry were made afterwards by the last scatterer, the Earth, which after release went on throwing material toward the Moon from all sides.
The contact disc, 17.5% of the surface, holds 95% of the thorium above 3 ppm; its centre, fixed in advance, is third of 16,200 possible centres, 47 km from the best. Within it the plains and the highland carry nearly the same thorium, and the maria the least (Part J). The contact is the region where the Moon last touched the Earth; its centre was set by the geometry of Paper 3 before the thorium was read. A cap of the same size was moved over the whole Moon, and almost no other centre catches more. What it means: the thorium belongs to the region of the last contact, not to the basalt: plain and highland inside the disc carry nearly the same amount. The maria of the contact, the channels to depth, are the poorest, because the last thorium-bearing liquid sank back down them.
The basins of the maria, read as external impacting bodies, require a foreign mass their melts do not carry (§J.7). Read in the literature’s own terms, the basins of the maria require about kg of foreign material; yet the melts of Imbrium match no known group of chondrites, and the bulk of the crust’s siderophile elements was in place before Imbrium and Serenitatis. What it means: the reading of the maria as basins dug by bodies from outside leaves a mass that has to be found; in the model there is no such mass to find, because the basins are openings and no foreign body was involved.
Taken together, the eight results describe one feed system seen in five records. The openings were exposed in an order set by the narrowing contact, each over its own feed dome; each floor froze as one level and sank over its dome; most far openings sealed early and were later covered by the layers of the far side; the near-side openings passed the Earth’s pressure while the Moon was attached, their ejections stopped at release, and their floors froze slowly afterwards; and the thorium marks the place of the last contact. The deciding tests are the buried domes, the floors over them, the iron rings and the foreign mass.
Further work — openings for research
The seven items below are where the next measurement will strengthen or test the picture. Each is stated as what must be measured; the engine, the rim ring and the order of sealing are also set out as a requirement or a prediction in Part M.
The engine. The critical flux and the times of sealing of the openings, against the times of exposure. An opening seals when the flow of melt through it falls below the level at which the heat it brings no longer balances its cooling (§H.3). Computing that level, and setting the time each opening sealed against the time it was exposed, turns the condition of §I.6 into a number for each mare.
The rim ring. Small craters on the rims against a measured volatile content, for every mare. Volatiles lightened the melt and drove out of the maria the material that built their margins (§H.2). The measurements showed no ring of small craters on every rim; the ring is expected only on the volatile-rich maria (§M.1). The test is the small craters on each rim, maria removed on both sides, against a measured volatile content (§F.3, §M.3).
The last scatterer. Small craters on the smooth floors, rays and secondary fields removed, against distance from each candidate. The model names the Earth as the last scatterer (§F.6); a count by distance from each candidate source would show whether any other source left a gradient on the floors.
The isotopes of the basins. Ruthenium and osmium isotopes in the melts of each basin of the maria. These isotopes tell a foreign body from material of the Earth–Moon system; measured basin by basin, they test directly whether any foreign mass is present (§J.7).
The thorium at high resolution. The reconstructed thorium map at 26 km over the feed domes. The orbital map used here has cells of half a degree; a sharper map would show whether the thorium is lowest exactly over the channels, as §J.6 requires.
The order of sealing. The youngest basalt of each mare against a centre fixed in advance, with thorium held fixed. If the contact maria sealed last, the youngest basalt should grow younger toward the contact centre (§K.2, §M.3).
Rays and the cooling of the near-side floors (the author’s proposal). The near-side maria stayed liquid for a long time, warmed by the Moon’s internal heat and by the Earth’s heat; the basalt plains, such as Oceanus Procellarum, where Copernicus, Kepler and Aristarchus lie, were exposed to the same great heat of the Earth and are in this very similar to the mare floors. Material that landed on these floors while they were hot lost its record. The author proposes that rays form only when material lands on a floor that has already cooled; on a hot floor they do not form at all. The rays are a record within the ground beneath the surface, not material lying on it. As the floors cooled they came to carry rays: when they had cooled, Copernicus, Kepler and Aristarchus landed hard and left the spider-like rays; Diophantus and Delisle landed while the floor was not yet fully frozen and left no rays; many others landed on a hot floor and left no mark. The study: count the small and medium craters on the near side, on the maria and on the basalt plains, with and without rays. The author expects those without rays to outnumber those with rays, because the amount of material landing on the Moon fell as the Moon receded.
Code availability
All numerical results of this paper are reproduced by the scripts of the LEF reproduction package (Python 3, numpy, scipy), with their inputs. The package is attached to this preprint as supplementary material (LEF_code_and_data.zip); an earlier version is deposited at doi:10.5281/zenodo.22743615.
References
[S1] Nelson, D. M., Koeber, S. D., Daud, K., Robinson, M. S., Watters, T. R., Banks, M. E., & Williams, N. R. (2014). Mapping lunar maria extents and lobate scarps using LROC image products. 45th Lunar and Planetary Science Conference, abstract 2861.
[S2] Goossens, S., Fernández Mora, Á., Heijkoop, E., & Sabaka, T. J. (2021). Patched local lunar gravity solutions using GRAIL data. Earth and Space Science, 8, e2021EA001695. DOI: 10.1029/2021EA001695.
[S3] Otake, H., Ohtake, M., & Hirata, N. (2012). Lunar iron and titanium abundance algorithms based on SELENE (Kaguya) Multiband Imager data. 43rd Lunar and Planetary Science Conference, abstract 1905.
[S4] Lawrence, D. J., Elphic, R. C., Feldman, W. C., Prettyman, T. H., Gasnault, O., & Maurice, S. (2003). Small-area thorium features on the lunar surface. Journal of Geophysical Research: Planets, 108(E9), 5102. DOI: 10.1029/2003JE002050.
[S5] Robbins, S. J. (2019). A new global database of lunar impact craters 1–2 km: 1. Crater locations and sizes, comparisons with published databases, and global analysis. Journal of Geophysical Research: Planets, 124, 871–892. DOI: 10.1029/2018JE005592.
[S6] Wang, Y., Wu, B., Xue, H., Li, X., & Ma, J. (2021). An improved global catalog of lunar impact craters (1 km) with 3D morphometric information and updates on global crater analysis. Journal of Geophysical Research: Planets, 126, e2020JE006728. DOI: 10.1029/2020JE006728.
[S7] Barker, M. K., Mazarico, E., Neumann, G. A., Zuber, M. T., Haruyama, J., & Smith, D. E. (2016). A new lunar digital elevation model from the Lunar Orbiter Laser Altimeter and SELENE Terrain Camera. Icarus, 273, 346–355. DOI: 10.1016/j.icarus.2015.07.039.
[S8] Li, Q.-L., et al. (2021). Two-billion-year-old volcanism on the Moon from Chang’e-5 basalts. Nature, 600, 54–58. DOI: 10.1038/s41586-021-04100-2.
[S9] Zhang, Q. W. L., et al. (2025). Lunar farside volcanism 2.8 billion years ago from Chang’e-6 basalts. Nature.
[S10] Neumann, G. A., et al. (2015). Lunar impact basins revealed by Gravity Recovery and Interior Laboratory measurements. Science Advances, 1, e1500852. DOI: 10.1126/sciadv.1500852.
[S11] Andrews-Hanna, J. C., et al. (2014). Structure and evolution of the lunar Procellarum region as revealed by GRAIL gravity data. Nature, 514, 68–71. DOI: 10.1038/nature13697.
[S12] Schultz, P. H., & Crawford, D. A. (2016). Origin and implications of non-radial Imbrium Sculpture on the Moon. Nature, 535, 391–394. DOI: 10.1038/nature18278.
[S13] Liu, J., Sharp, M., Ash, R. D., Kring, D. A., & Walker, R. J. (2015). Diverse impactors in Apollo 15 and 16 impact melt rocks: evidence from osmium isotopes and highly siderophile elements. Geochimica et Cosmochimica Acta, 155, 122–153. DOI: 10.1016/j.gca.2015.02.004.
[S14] Murase, T., & McBirney, A. R. (1970). Viscosity of lunar lavas. Science, 167, 1491–1493. DOI: 10.1126/science.167.3924.1491.
[S15] Hiesinger, H., Head, J. W., Wolf, U., Jaumann, R., & Neukum, G. (2011). Ages and stratigraphy of lunar mare basalts: a synthesis. In Recent Advances and Current Research Issues in Lunar Stratigraphy, Geological Society of America Special Paper 477, 1–51.
[S16] Du, J., Fa, W., Wieczorek, M. A., et al. (2019). Thickness of lunar mare basalts: new results based on modeling the degradation of partially buried craters. Journal of Geophysical Research: Planets, 124, 2430–2459. DOI: 10.1029/2018JE005872.
[S17] Whitten, J. L., & Head, J. W. (2015). Lunar cryptomaria: physical characteristics, distribution, and implications for ancient volcanism. Icarus, 247, 150–171. DOI: 10.1016/j.icarus.2014.09.031.
[S18] Mustard, J. F., Li, L., & He, G. (1998). Nonlinear spectral mixture modeling of lunar multispectral data: implications for lateral transport. Journal of Geophysical Research, 103. DOI: 10.1029/98JE01901.
[S19] Wieczorek, M. A., et al. (2013). The crust of the Moon as seen by GRAIL. Science, 339, 671–675.
[S20] Melosh, H. J., et al. (2013). The origin of lunar mascon basins. Science, 340, 1552–1555.
[S21] Solomon, S. C., & Head, J. W. (1980). Lunar mascon basins: lava filling, tectonics, and evolution of the lithosphere. Reviews of Geophysics, 18, 107–141.
[S22] Jolliff, B. L., Gillis, J. J., Haskin, L. A., Korotev, R. L., & Wieczorek, M. A. (2000). Major lunar crustal terranes: surface expressions and crust–mantle origins. Journal of Geophysical Research, 105, 4197–4216.
[S23] Zhu, M.-H., Artemieva, N., Morbidelli, A., Yin, Q.-Z., Becker, H., & Wünnemann, K. (2019). Reconstructing the late-accretion history of the Moon. Nature, 571, 226–229. DOI: 10.1038/s41586-019-1359-0.
[S24] Shearer, C. K., et al. (2006). Thermal and magmatic evolution of the Moon. Reviews in Mineralogy and Geochemistry, 60, 365–518. DOI: 10.2138/rmg.2006.60.4.
[S25] Gong, S., Wieczorek, M. A., Nimmo, F., Kiefer, W. S., Head, J. W., Huang, C., Smith, D. E., & Zuber, M. T. (2016). Thicknesses of mare basalts on the Moon from gravity and topography. Journal of Geophysical Research: Planets, 121, 854–870. DOI: 10.1002/2016JE005008.
[S26] Barker, M. K., Mazarico, E., Neumann, G. A., Zuber, M. T., Haruyama, J., & Smith, D. E. (2016). A new lunar digital elevation model from the Lunar Orbiter Laser Altimeter and SELENE Terrain Camera. Icarus, 273, 346–355. DOI: 10.1016/j.icarus.2015.07.039.
The catalogue of openings
The 34 maria of this paper, identified by the author on the gradients of the GRAIL Bouguer gravity field, with the feed dome beneath each (§C.2). The Bouguer field is the gravity that remains once the pull of the visible topography is removed; its gradients show the edges of dense bodies below the surface, and it is on these edges that the maria were marked, not on the dark basalt. The numbers are those of the original marking; marks found not to be maria were removed, and four maria were added after the review of the strong domes left unmarked (37–40). The zone follows the geometry of Paper 3: the contact, the last 3,000 km of the tip (within 1,500 km of 24.1°N, 335.2°E), generation III; the hill, the base of the bulge, 6,000 km across (within 3,000 km of 16.6°N, 13.1°E), generation II; beyond, generation I. The generation tells when an opening was exposed: generation I, on the far side, was exposed from the start; generation II, in the belt, as the contact narrowed; generation III, in the contact disc, toward release (§I.4). The column “Sub-Earth” gives the angular distance from the sub-Earth point, the point of today’s Moon that faces the Earth.
How to read this catalogue. How the openings were marked. The author marked the openings by eye, as points on the gradients of the GRAIL Bouguer gravity field viewed in QuickMap, and numbered them 1 to 36; point 35 is Copernicus H and point 36 is Sinus Aestuum. These 36 marked points are the openings on which the statistics of the paper are made, as in the crustal test of §D.2 (Study 3). The catalogue lists the 34 maria. It keeps the numbers of the original marking, so the gaps in the sequence (2, 8, 14, 15, 22, 31) are marks found not to be maria and removed; the four maria numbered 37–40 were added later, after a review of the strong feed domes that had been left unmarked.
The columns. #: the number of the original marking. Opening: the name of the mare or basin; where there is no name, its position. Lat, Lon E: latitude and east longitude of the marked point, in degrees (south latitudes are negative; longitude is counted eastward from 0° to 360°). Sub-Earth: the angular distance from the sub-Earth point, the point of today’s Moon that faces the Earth; below 90° the opening lies on the near side, above it on the far side. Zone (gen.): the contact, the hill or beyond, with the generation of exposure, III, II or I (§I.4). Feed dome beneath: the identifier of the feed dome in the GRAIL field at degrees 6–660 and its diameter; “cooked under SPA” marks the maria over South Pole–Aitken whose dome was erased by the heat under that basin. Cover: what lies over the dome today, by colour — blue, under a mare (the dome is open, with basalt on it); amber, partial; red, buried (bright highland covers the dome); grey, over SPA.
What to look at. The blue rows gather in the contact and the hill; the red rows, the buried domes, lie mostly beyond, at sub-Earth distances above 90°. This is the result of §D.4 in one table: the far side holds openings as the near side does, but covered.
| # | Opening | Lat | Lon E | Sub-Earth | Zone (gen.) | Feed dome beneath | Cover |
|---|---|---|---|---|---|---|---|
| 1 | Serenitatis | 26 | 18 | 31° | contact (III) | M660_008, 610 km | under a mare |
| 3 | Nectaris | -16 | 33 | 36° | hill (II) | M660_006, 518 km | under a mare |
| 4 | Crisium | 18 | 60 | 62° | hill (II) | M660_003, 474 km | under a mare |
| 5 | Humboldtianum | 57 | 83 | 86° | hill (II) | M660_009, 319 km | partial |
| 6 | Smythii | -3 | 86 | 86° | hill (II) | M660_007, 450 km | under a mare |
| 7 | Milne | -31 | 113 | 110° | beyond (I) | M660_032, 149 km | buried |
| 9 | Mendeleev | 5 | 142 | 142° | beyond (I) | M660_029, 128 km | buried |
| 10 | Moscoviense | 26 | 149 | 140° | beyond (I) | M660_002, 313 km | under a mare |
| 11 | Poincaré | -58 | 163 | 120° | beyond (I) | M660_035, 209 km | under a mare |
| 12 | Ingenii | -33 | 169 | 146° | beyond (I) | — (cooked under SPA) | over SPA |
| 13 | Freundlich–Sharonov | 17 | 176 | 162° | beyond (I) | M660_005, 323 km | buried |
| 16 | Cooper K | 51 | 183 | 129° | beyond (I) | M660_021, 287 km | buried |
| 17 | — (26.4°N, 191.4°E) | 26 | 191 | 151° | beyond (I) | M660_023, 346 km | buried |
| 18 | Dirichlet–Jackson | 14 | 202 | 155° | beyond (I) | M660_027, 214 km | buried |
| 19 | Korolev | -5 | 202 | 157° | beyond (I) | M660_031, 164 km | buried |
| 20 | Apollo | -37 | 209 | 134° | beyond (I) | — (cooked under SPA) | over SPA |
| 21 | Birkhoff | 59 | 214 | 116° | beyond (I) | M660_048, 106 km | buried |
| 23 | Hertzsprung | 2 | 232 | 128° | beyond (I) | M660_012, 307 km | buried |
| 24 | Coulomb–Sarton | 50 | 239 | 109° | beyond (I) | M660_013, 313 km | buried |
| 25 | Lorentz | 34 | 265 | 94° | hill (II) | M660_022, 124 km | buried |
| 26 | Orientale | -19 | 265 | 95° | beyond (I) | M660_001, 435 km | under a mare |
| 27 | Mendel–Rydberg | -49 | 266 | 93° | beyond (I) | M660_004, 286 km | buried |
| 28 | Grimaldi | -5 | 292 | 68° | hill (II) | M660_011, 182 km | under a mare |
| 29 | Bailly | -68 | 293 | 82° | beyond (I) | — (cooked under SPA) | over SPA |
| 30 | Crüger–Sirsalis | -16 | 294 | 67° | hill (II) | M660_016, 255 km | partial |
| 32 | Schiller–Zucchius | -57 | 316 | 67° | hill (II) | M660_014, 909 km | buried |
| 33 | Humorum | -25 | 320 | 46° | hill (II) | M660_010, 375 km | under a mare |
| 34 | Imbrium | 38 | 341 | 42° | contact (III) | M660_015, 671 km | under a mare |
| 35 | Copernicus H | 6 | 342 | 19° | contact (III) | M660_042, 170 km | under a mare |
| 36 | Sinus Aestuum | 10 | 352 | 13° | contact (III) | M660_020, 235 km | under a mare |
| 37 | Schrödinger | -75 | 132 | 100° | beyond (I) | M660_024, 153 km | buried |
| 38 | Orientale Southwest | -28 | 251 | 106° | beyond (I) | M660_026, 239 km | buried |
| 39 | Szilard North | 34 | 107 | 104° | hill (II) | M660_025, 185 km | buried |
| 40 | Balmer-Kapteyn | -16 | 70 | 70° | hill (II) | M660_030, 108 km | buried |
Use of AI tools: The author used AI assistants (Claude, Anthropic; ChatGPT, OpenAI; Google’s AI search assistant) to write and run the computation scripts, to analyse the catalogues and maps, to prepare figures and tables, to discuss the scenarios, and for language editing and translation. The model and its conclusions are the author’s. The author checked the content and takes full responsibility for it.