The Craters
Craters Without Asteroids
The computational environment
This paper asks whether material thrown out of the forming body and falling back on it could land hard enough to make craters. The answer depends on a handful of quantities — the mass that pulls the material back, the radius it is thrown from, the spin of the surface, the speed of the throw — and on what each of them is taken to mean. The table fixes them once. Its upper rows set the stage and the source of the thrown material; its middle rows give the numbers of the worked example used throughout Parts J and K; its lower rows say what the target is, how the shock is computed, and which numbers of the series are not used here.
|
Quantity or condition |
Definition in this paper |
|---|---|
| Stage of construction | The outer shell still exposed — flat over the feed, or on the flank of the rising dome; ejection and the rise overlap |
| Source of the ejection | The interior of the Earth, whose pressure and material passed through the pear to the openings in the shell (Paper 3); the material is not defined as material torn from the shell |
| Early parent mass | kg, including the future lunar mass |
| Gravitational constant | |
| Ejection radius in the example | km; radial ejection from the equator of the rotating surface |
| Rotation in the example | 5.5 hours, constant during a single flight; no assumption that it remained constant throughout the construction |
| Field model | A terrestrial monopole frozen in time, ; not the field solution of a developed connected body |
| Thermal state and volatiles | A hot, volatile-rich source in the scenario; the atmosphere and the phase state are not measured here |
| Ejection velocity | A test parameter, not a proven output of the source pressure; 2–8 km/s are examined |
| Target surface | A relatively strong outer part over a mobile base; the full preservation conditions are in Paper 3 |
| Shock input | Dense basalt at a reference density of 2,700 kg/m³, for a reference landing; not identified with foamed magma |
| Rate and duration | No measured ejection duration; the 600 Myr window of the series is not the flight time and is not dated from crater counting |
| Later stages | Centre distances of about 17,570/17,631 km belong to the coupled states of Paper 2; they are not the radius of the surface receiving landings |
Several rows need a word of explanation. The stage and the source. In the LEF model the Moon was not thrown off finished: it was built as a body standing on the Earth, on the tip of a long extension of the Earth’s own material, the pear, and fed from within through openings in its shell (Paper 3). Before the body rose, its future outer shell lay on the parent as part of the parent’s surface; as the feed beneath it pushed up, the shell became the surface of a rising dome. The craters of this paper were made on that shell, while it was still open to the sky — first while it lay flat over the feed, then on the flanks of the dome — and the shell carried them up with it. The material that made them came from below, from the interior of the Earth, whose pressure and material passed through the pear to the openings; it did not come from pieces broken off the shell itself.
The mass, the radius and the spin. is the mass of the Earth and the future Moon together, since at this stage the Moon’s material had not yet left. The ejection radius of 6,721 km, a little larger than the radius of today’s Earth (6,371 km), is the distance from the centre at which the example is thrown, and the day of the example is 5.5 hours long. A spinning surface throws everything on it a little outward, so the pull a thrown body feels at that radius is somewhat less than the pull of the mass alone; with these values it is 8.25 m/s² (§J.3). The spin is held constant only for the minutes or hours of one flight; nothing is assumed about how it changed over the whole construction.
The field. A monopole field is the pull of a mass concentrated at a point: it depends only on the distance from the centre. is the strength of that pull. The real parent was neither a point nor unchanging, and once the body stood on it the field was that of two connected masses; the monopole is the simplest field in which the flight can be followed exactly, and Parts J and K say where it ceases to apply.
The ejection velocity. The speed at which the material leaves the opening is treated as a dial, set in turn to 2, 3, 5 and 8 km/s, and each setting is followed to its landing. The paper does not claim to have derived it from the pressure of the source; what the source must supply to reach it is stated as a requirement (§J.1).
The target and the shock. The surface that receives the landings is a strong outer layer over a softer, mobile base — strong enough to hold a crater, and carried up by what lies beneath. For the pressure at the moment of landing, both the arriving material and the target are taken as dense basalt of 2,700 kg/m³, a reference case with well-measured shock properties; it is not a claim that the arriving material was dense basalt rather than a foam of melt and gas.
The times and the distances. The whole construction, from the start of the bulge to release at 3.873 Ga, spans about 600 Myr: roughly 400 for the bulge and the pear, about 100 for the flattening and about 100 to release. That window is the time in which most of the craters were made; after release the Earth added small and middle craters from the drops it threw (Part M). The window is not the time a single flight took, and it is not read from crater counts. The Moon at release was round, its outer shell rigid. The distances of about 17,570 and 17,631 km belong to later stages, when the body stood on the Earth at a distance; they are the centre distances of those coupled states, not the radius of the surface on which the craters of the example land.
Contents
| The computational environment; Abstract; Introduction — the literature and the model; What this paper proposes | |
| PART A | Terms and definitions |
| A.1 | The terms of the model |
| A.2 | The three heights |
| PART B | What the series has fixed |
| B.1 | The three stages of Paper 3 |
| PART C | The craters: what a crater is, how many there are, and the crater as a record of the returning material |
| C.1 | The maria: where the returning material came from |
| C.2 | What the crater takes from the mare |
| C.3 | How many craters |
| C.4 | The crater record is the record of the maria |
| C.5 | The source test |
| C.6 | Crater size and mass of the returning body |
| PART D | The craters, visible and buried |
| D.1 | Craters buried with the sources of the far side |
| D.2 | Craters melted into the floors of the maria |
| D.3 | The mass under the melted craters of the maria |
| PART E | Size and state: the maria and the craters in time |
| E.1 | Three states on one floor |
| E.2 | The state of the craters by size |
| E.3 | The maria: temperature, viscosity and time |
| E.4 | The arriving material: temperature, size and distance |
| E.5 | The chain in time |
| E.6 | The rim: worn by heat or flooded |
| E.7 | What this shows |
| PART F | The rim |
| F.1 | The rim at four longitudes |
| PART G | The bottom of the crater below the ground |
| G.1 | The floor below the land |
| G.2 | The floors of the large craters on the basalt |
| G.3 | Iron in the high floors and in the low |
| PART H | The floor of the crater |
| H.1 | Flatness and roughness |
| PART I | The central peak |
| I.1 | The peak at four longitudes |
| PART J | The engine |
| J.1 | Energy available at the opening |
| J.2 | Velocity and shock pressure |
| J.3 | The vapour atmosphere is part of the test |
| J.4 | A landing lump, a cloud of material and a preserving surface |
| J.5 | Gravitational binding and a velocity ceiling |
| PART K | The geometry |
| K.1 | Return to the shell at the same altitude |
| K.2 | Landing on a higher target |
| K.3 | The shock trend is path-conditional |
| K.4 | Where the body’s own ejecta land |
| PART L | The chemistry |
| L.1 | Mare material in rings around the mare |
| L.2 | The crater and its ground |
| L.3 | Thorium and the returning material |
| L.4 | The inside of the crater |
| L.5 | The foreign mass that is not there |
| L.6 | The terrestrial material after release |
| L.7 | The near side keeps more of the last small craters |
| L.8 | A record kept whole: the Moon never passed through a ring |
| PART M | Dating |
| M.1 | Captured ejecta after release |
| PART N | Statistics |
| N.1 | How the craters were compared |
| N.2 | What is measured and what is assumed |
| PART O | Predictions and tests |
| O.1 | Fourteen focused tests |
| O.2 | The studies in one table |
| PART P | Discussion |
| P.1 | What the two halves record |
| P.2 | What remains outside the paper |
| P.3 | The novelty and the contribution to the series |
| PART Q | Conclusions |
| Q.1 | What the paper has shown |
| Appendix — reproduction and the novelty map; Further work; Code availability; References |
The question. In the LEF model, deep material was ejected through openings in the Earth’s envelope, and part of it returned to the outer shell that later rose with the forming Moon as the surface of its dome. This paper examines a question separate from the transport of mass: can such returning material arrive at a velocity sufficient for cratering and for shock in the target?
The flight. In a central-gravity approximation without drag, the return velocity, the energy requirement and the velocity relative to a rotating surface are derived. Material ejected radially and returning to the same radius lands at a relative velocity equal to the ejection velocity. In the 5 km/s example a flight of about 28 minutes and a landing about 1,032 km west of the ejection site are obtained; for an ideal head-on basalt landing an estimated contact pressure of 45.6 GPa results. Gravitational return therefore does not require a slow landing, but the ejection velocity itself still requires an energy source. The derivation also shows that the dependence of landing velocity on target altitude does not imply a universal trend with time.
The conditions. The paper links the tests of ejection, flight, encounter and shock, with constraints placed on drag, break-up, mass of the returning body and preservation of the record: a kilometre-sized body crossing a vapour atmosphere of 100 bar keeps about half its speed, and material thrown faster than the escape speed does not come back. Nearly all the Moon’s craters, some 99%, are of returned terrestrial material. Read as external impacting bodies, the craters seen today would leave 2–6% of foreign material in the upper 5 km of the crust; the crust’s siderophile elements amount to 0.9–2%, and where their ruthenium isotopes have been measured they are the Earth’s.
The source. The source of the returning material is the maria, the 34 openings over feed domes of Paper 5 — most of them; Imbrium and Serenitatis, the maria of the contact, passed the Earth’s pressure and material into the Moon and did not eject (Serenitatis only slight popping). The ground around each carries its iron and titanium, falling off with distance: iron from 6.9 wt% within 25 km of the edge to 3.1 at 100–150 km, with an excess out to 600 km. Not every crater is seen: on the far side craters were buried together with the sources that made them, and on the floors of the maria three of every five craters of 10 km and more melted into the floor, while of 20 km and more only one is sharp, some two hundred times fewer than on the highlands; on the maria of the contact the large craters vanished altogether.
The longitudes. The longitudes add a record of how the craters fell (Parts F–I). Material ejected by the body itself lands toward its trailing half, 90°E, the more crowded (about 250 against 140–175 craters of 20 km and more per million km², maria and South Pole–Aitken removed); the leading half, 90°W, meets it head-on, and its craters carry more central peaks, jagged and lower rims and the roughest floors. Each part of a crater keeps a record of its own: the centre the energy of the landing; the rim the forces at that moment, highest on the far side and lowest on the leading half; the floor the ground beneath, lowest on the layered far side and highest on the near side. Inside the crater one composition runs from the centre to the rim at every longitude: the crater is filled with the returning material that made it. The attribution of a lunar crater population to this mechanism is tested by the criteria of §O.1.
What the abstract means, in plain words. The literature holds that the Moon’s craters were dug by bodies from space — asteroids and comets — striking at 15–20 km/s. This paper proposes a source much closer to home. While the Moon was being built on the Earth, material from deep inside was thrown up through openings in the shell, flew a few hundred or a few thousand kilometres up, and fell back on that same shell. The question is whether material falling back in this way can land hard enough to dig a crater and to leave the marks of shock in the ground. The paper answers it in two halves: first by following the flight itself, then by reading the craters of today’s Moon as the record such landings would leave.
Why the material comes back as fast as it left. A ball thrown straight up, with no air to slow it, comes back to the hand at the speed it was thrown: on the way up it trades speed for height, and on the way down it trades the height back for the same speed. Material thrown up from the parent does the same — 5 km/s out, 5 km/s back. The spin adds one thing. A point on a spinning surface already moves sideways, and material thrown straight up from it carries that sideways motion with it; when the material comes back down to the same distance from the centre, it again has exactly that sideways motion, because the turning motion of a body flying freely about the centre is conserved, as a skater keeps her spin when her arms come back to where they started. The ground it lands on moves sideways at the same rate, so sideways the two are at rest with respect to each other, and the whole of the 5 km/s is a straight-down blow. Up high, however, the same turning motion is spread over a larger circle, so the material turns more slowly than the ground beneath, as the skater turns more slowly with her arms out; the ground runs ahead, and the material comes down behind its starting point, to the west. At 5 km/s the flight rises 1,932 km, lasts 28 minutes and lands 1,032 km west (§K.1).
Why 5 km/s into basalt gives 46 GPa. When two pieces of the same material meet head-on, each slows the other equally, so the material just behind the front of the shock moves at half the landing speed: 2.5 km/s at a landing of 5 km/s. The front itself runs through basalt faster than that; measured on basalt, its speed is 3.5 km/s plus 1.3 times the speed of the material behind it, here 6.75 km/s. The pressure behind the front is the density times the two speeds: 2,700 kg/m³ 6,750 m/s 2,500 m/s, which is 45.6 GPa (§J.2). That is well above the pressures at which the minerals of basalt begin to record shock and change their structure [S4]; at 2 km/s the same calculation still gives about 13 GPa. A landing of a few km/s is therefore not a soft fall: it is a shock event, of the same kind as the literature reads in lunar craters, though below the speeds of a body from space.
What it costs. To be thrown at 5 km/s, each kilogram must be given 12.5 MJ of energy at the opening. This energy is supplied by the pressure from the Earth: the spin and the sorting, one mechanism, create the pressure in the Earth, and it passes through the pear to the openings and sprays the material out of them. The volatiles the material carries, expanding as it rises, assist. On the way back the material may cross a dense atmosphere of vapour; a body a kilometre across, crossing a vapour column with 100 bar at its base, keeps about half its speed (§J.3). Material thrown faster than the escape speed — the speed at which the pull of the parent can no longer bring it back — leaves and does not return. These are the conditions the mechanism must meet; Part O states each of them as a test.
What “nearly all the craters are of returned terrestrial material” means. It means that the matter which dug the craters was the Earth’s own: deep material that left through the openings and came back, not bodies arriving from outside the Earth–Moon system. Some 99% of the craters are of this kind; foreign material, if it is found at all, will be in very small amounts, apart from the fine dust that space delivers to every airless surface. This has a test that does not depend on the flight. A body from space brings its own mass, and part of it stays in the ground; such bodies are rich in the siderophile (“iron-loving”) elements — iridium, osmium, platinum, ruthenium — which the Moon’s own crust almost lacks, so a small addition stands out at once. Had the visible craters been dug from outside, they would have left 2–6% of foreign material in the upper 5 km of the crust. The whole of the crust’s siderophile elements, counted as if all of them lay in that layer, comes to 0.9–2%; and where the isotopes of ruthenium, which tell one source in the solar system from another, have been measured in lunar crater melts, they are those of the Earth (§L.5).
Where the material came from. The openings that threw it are the maria: in Paper 5 a mare is an opening over a feed dome, the body pushed up from beneath through which the material rose; its dark plain is only the last layer that froze in it. Most of the maria threw material; Imbrium and Serenitatis, the maria of the contact, passed the Earth’s pressure and material into the Moon and did not eject (Serenitatis only slight popping). If the maria threw the material, the ground around each must carry the mare’s iron and titanium, the most near the edge and less farther out — and it does. Not every crater survived to be counted. On the far side, the layers that later built its thick crust covered the old openings and the craters around them together. On the floors of the maria, which were still hot and soft when much material landed, three of every five craters of 10 km and more melted into the floor and lost their depth. The maria of the contact — the patch of the near side that still touched the Earth while attached, and that froze late, Serenitatis first, very close to the Earth, Imbrium after detachment — keep no large crater at all.
What the longitudes add. The Moon keeps one face toward the Earth, so one half always faces forward along its orbit (the leading half, centred on 90°W) and the other faces back (the trailing half, centred on 90°E). Once risen, the body threw material from its own openings as well, slowly — at most about its own escape speed — and its turning decided where that material fell back. On the trailing half the ground moved away from the falling material, which caught up with it from behind and landed gently; on the leading half the ground moved on into the falling material and met it head-on. The trailing half therefore collected more craters, and the leading half the harder landings, which show in the shape of its craters: more central peaks, rougher floors, more jagged and lower rims. Each part of a crater keeps a different record: the central peak, the rebound of the landing, records how hard it was; the rim records the forces of that moment; the floor records the ground beneath. And the composition of the crater changes in the same way from centre to rim at every longitude, because the crater is filled with the material that made it.
Introduction — the literature and the model
Paper 3 deals with feeding the body from within and with the rise of the outer shell as the surface of the dome, and proposes that the craters formed on the shell travelled with it. Here the process that runs during feed and rise is treated: what happens to material that left the ejection opening, returned and landed on the surface. The physics of the dome and of the connection is not derived again.
A crater and shock features record a landing, but the source of the returning body requires further evidence. Secondary craters — craters dug by material thrown out of a larger crater and falling back — are already known [S1], and the study of transfer of material from the Earth to the Moon preceded this model [S2]. Returning material making craters is therefore not new in itself. The novelty examined here is an internal ejection source at the construction stage, and landing on the shell before it became part of the lunar surface. The title of the paper is not a claim that all craters formed without asteroids.
The table sets the literature’s reading and the model’s side by side, question by question. Each row is a place where the same craters are given a different origin, and each is taken up in the Part that measures it: the speeds in Parts J and K, the source in Parts C and D, the two halves in Parts F–I, the foreign mass in §L.5, the ages in Part M.
| Question | The literature | The model |
|---|---|---|
| What made the craters | External impacting bodies, asteroids and comets, at 15–20 km/s | Returning terrestrial material, thrown from the openings and landing at 2–8 km/s |
| Where | On the Moon, through its history | On the shell while it lay on the Earth, and on the body; the shell rose with them |
| The source | Outside the Earth–Moon system | The maria and the feed domes, visible and buried |
| The leading and trailing halves | More craters on the leading half | More on the trailing half, the harder landings on the leading half |
| The foreign mass | Retained in part, the rest lost | None to find: the material is terrestrial |
| The ages | Crater density converted to years by a constant flux | Not converted: the flux was not constant |
The last row needs a word. The literature turns the number of craters per area into an age by assuming that bodies from space arrived at a known, steady rate. If the craters were thrown by the maria while the Moon was being built, they arrived as fast as the openings threw them, which was not steady; a count of craters then measures how much a surface received, not how long it stood open.
How the paper is built. The paper first fixes its words (Part A) — returning material, landing, crater, and the three different heights hidden in the word “depth” — and recalls the stages of construction in which the craters were made (Part B). It then turns to the craters of today’s Moon: how many there are and where, and the maria as their source (Part C); the craters that are not seen, covered on the far side or melted into the floors of the maria (Part D); and the order in time of the maria and the craters, read from the state each crater is in (Part E). Parts F, G, H and I read the four parts of a crater — the rim, the bottom below the ground, the floor and the central peak — at four longitudes, as the record of how hard the material landed. Part J gives the engine: the energy needed at the opening, the pressure of the landing, the vapour atmosphere, and the speed above which the material does not return. Part K gives the geometry of the flight: the return to the same radius, the landing on a higher target, and where the body’s own ejecta fell. Part L reads the chemistry, from the rings of mare material around each mare to the foreign mass that is not there. Part M treats the terrestrial material captured by the Moon after release; Part N says how the craters were compared and what is measured as against assumed; Part O gathers the tests and the studies; Parts P and Q discuss and conclude.
The oldest craters on the Moon were made in it on the Earth. While the shell of Paper 3 still lay on the parent, deep material ejected through its openings rose, turned, and came back down on it. Gravity does not slow a returning body: material thrown radially from a rotating surface returns to the same radius at the speed it left — 5 km/s out, 5 km/s back, 28 minutes in the air, a thousand kilometres to the west. Five kilometres per second into basalt is 46 GPa at the contact, above every shock-metamorphism threshold. The craters so made rose with the shell onto the Moon and kept their size (Paper 3, §B.6; Paper 7, §D.5). Nearly all the Moon’s craters — some 99% — are of returned terrestrial material; foreign material, if it is found at all, will be in very small amounts, space dust apart.
What the mechanism must supply is stated as three numbers. The ejection energy — , 12.5 MJ/kg at 5 km/s — is supplied at the openings by the pressure from the Earth, created by the spin and the sorting and passing through the pear; the volatiles in the material assist. A concentrated returning body must cross the vapour atmosphere: a kilometre-sized body through 100 bar keeps half its speed. And the shell must be strong enough to hold a crater kilometres across until it rises. Each is listed in §O.1 with its test; a shock trend with altitude and a shock ceiling are properties of one path, not of the mechanism, and are not claimed.
The maria are the source. The openings that threw the returning material are the maria, most of them; Imbrium and Serenitatis, the maria of the contact, did not eject, Serenitatis only slight popping (§C.1; Paper 5). The ground around every mare carries its iron, fading with distance. Not every crater is seen: on the far side the craters were covered by its layers together with the sources that made them (§D.1), and on the near side the floors of the maria melted about three in five (62%) of the craters counted on them (§D.2).
The longitudes record how hard the craters fell. The body threw material from its own openings, not far and not fast — at most about 2 km/s, its own escape speed. What it threw from the far side fell a little behind, toward 90°E; what it threw from 90°E fell back on 90°E; what it threw from 90°W fell back and was met head-on. The trailing half, 90°E, is therefore the more crowded, and the leading half, 90°W, the one landed on hardest: its craters carry more central peaks and more jagged rims (Parts F–I).
How the box reads. The first paragraph is the proposal and its physics in one line each. The craters were made on the shell while it was still part of the parent’s surface; the shell then rose, as the surface of the dome, and became the outside of the Moon, carrying its craters with it without changing their size. Gravity takes back on the way down exactly the speed it took on the way up, so a throw of 5 km/s is a landing of 5 km/s; a landing at that speed on basalt produces a pressure of 46 GPa at the point of contact, enough to leave the marks of shock that the literature reads as the signature of a crater made by a body from space. “Space dust apart” means that the fine dust every airless surface collects is not counted among the craters.
The second paragraph turns the open points into requirements. The energy needed to throw a kilogram at speed is : 12.5 MJ at 5 km/s, which the pressure from the Earth supplies at the opening, with the expanding gas of the material assisting. A body falling back through a dense vapour is slowed by it, and a kilometre-sized body through a column of 100 bar keeps about half its speed — still a few km/s. And the shell must be firm enough that a crater made in it is not smoothed away before it rises. A higher target or a different path changes the speed of a single landing, but that does not make the shock rise or fall in a fixed way with time, and no such trend is claimed (§K.3).
The third paragraph names the source and says why the record is incomplete. The maria, most of them, are the openings; the ground around them carries what they threw. Two processes hid craters: on the far side, the layers that later thickened its crust covered the old openings together with the craters around them; on the near side, a mare floor still soft with heat took the craters that landed on it and melted them into itself, so that of the craters counted on the floors about three in five lost their form.
The fourth paragraph describes the second stage of cratering, after the body had risen and turned with the Earth. It threw material from its own openings, slowly. Where the ground moved away from the falling material the landing was gentle and the craters many; where the ground moved into it the landing was hard, and the craters there carry the marks of a hard landing.
Terms and definitions
the same words, crater, impact and depth, carry the literature’s reading. The approach: the terms of the model are fixed in one place, and the word depth is split into the three heights that are measured.
This Part fixes the words before the paper uses them. The reason is practical. In the literature the word crater already carries a story — a body from outside struck the Moon and dug a hole — and the word depth is used for several different measurements at once. A reader who brings those meanings into this paper would read a different paper. Part A therefore does three things: it names the parts of a crater and the instruments and catalogues through which craters are read; §A.1 sets the terms of the model; and §A.2 splits the word depth into the three heights that are actually measured, because the leading and trailing halves of the Moon differ in one of them and not in another.
The parts of a crater and the words of measurement. Each term is named once here, in plain words, so that the later Parts can use it without stopping. The table can be read now or consulted when the term first appears.
| Term | What it is | How this paper uses it |
|---|---|---|
| The parts of a crater | ||
| Simple crater | A small crater shaped as a plain bowl: smooth walls curving down to a rounded bottom | The craters of a few km; below 5 km they are not compared here (§B.1) |
| Complex crater | A larger crater whose walls have slumped inward in steps (terraces), leaving a flat floor and, often, a peak at the centre | Most of the craters of 20 km and more compared in Parts F–I |
| Rim | The raised ring around a crater; its highest line is the rim crest | Its height, its jaggedness and how well it is kept (§A.2, Part F) |
| Floor | The bottom of the crater inside the walls | Its height below the land around and its roughness (Parts G–H) |
| Central peak | A hill standing at the centre of the floor of a complex crater | A record of the energy of the landing (Part I) |
| Ejecta | The material a forming crater throws out and lays around itself, thinning outward | Kept apart from the returning material that made the crater |
| Secondary craters | Small craters made by the lumps of ejecta thrown from a larger crater when they come down again | With spray, they dominate the craters of 5 km and less, which are not compared (§B.1) |
| Spray | Fine, fast material thrown from an active opening, which lands close to it and makes small craters | The ring of small craters on a mare rim (§C.2) |
| Shock metamorphism | Changes in minerals that only a sudden pressure of many GPa can make — deformed and high-pressure minerals, melted glass; 1 GPa is about ten thousand times the air pressure at sea level | The model’s landings must reach it: 5 km/s into basalt gives 46 GPa (§J.2) |
| Counting craters | ||
| Robbins catalogue | A global catalogue of lunar craters down to 1–2 km across, each with its position and diameter [S6] | The craters of 20 km and more counted in §C.3 |
| Crater density | The number of craters per million km² of surface counted; a million km² is a square 1,000 km on a side | Makes regions of different area comparable (§C.3) |
| Size bin | A range of diameters within which craters are compared, e.g. 20–30 km | Only craters of the same bin are compared, so that size does not pass for difference |
| Cap | A round region of the surface of a given angular radius around a centre | Four caps of 30° radius on the equator (§C.3) |
| SPA, large basins | South Pole–Aitken, the largest basin of the Moon, on the far side; and the 20 large basins, hundreds of km across | Removed from the counts, because each erased the craters within it |
| Chemistry | ||
| FeO, wt% | Iron oxide, in percent of the weight of the surface material; read from the colour of the reflected sunlight by the Kaguya Multiband Imager [S10] | The mark of a mare’s material on the ground around it (§C.5) |
| Thorium, ppm | A radioactive element mapped by Lunar Prospector from the gamma rays of its decay, in broad cells; ppm is parts per million | A second mark, read as a regional value (§C.5) |
| Places on the Moon | ||
| Leading and trailing halves | The Moon keeps one face to the Earth; the half that faces the direction of its motion along the orbit is the leading half, centred on 90°W, and the half behind it is the trailing half, centred on 90°E | Where the returning material landed hard and where it landed soft (§K.4) |
A.1The terms of the model
The second table sets the words that carry the model. Each row names a thing that the literature also names, but gives it the meaning it has in the pages that follow. The rows that matter most are the first three: the craters of this paper are not dug by bodies from outside but are the places where material thrown from the openings of the forming body came back down.
| Term | In this paper |
|---|---|
| Returning material | Material thrown from an opening that came back to the surface, of the parent or of the body |
| Landing | The arrival of returning material on the surface; the word impact is kept for external impacting bodies of the literature |
| Crater | The place where returning material landed |
| Opening, mare | An opening over a feed dome; the maria are the openings (Paper 5) |
| Feed dome | The dome raised from a subsurface focus beneath an opening, through which the material rose |
| Leading, trailing | The halves of the Moon centred on 90°W and 90°E, by the standard convention |
| Erosion | The wearing of a rim with time; the share of well-kept rims is read as erosion, not as age |
Two words need a sentence more. The parent is the Earth, on whose surface the shell of the future Moon lay while it was built; the body is the Moon while it was still attached to it (Paper 3). A feed dome is not a body of melt that came to rest in the crust: it is the shape the upward flow itself built as it passed through, as the water of a strong spring raises a mound over its outlet while it runs (Paper 5). The last row matters for the reading of the counts: when the rims of one half are less well kept than those of another, this paper reads the difference as wear, not as a younger or older surface.
A.2 The three heights
The three heights. The word depth hides three different heights, and the halves differ in one and not in another, so they are kept apart (Figure 1). Each is measured against a level of its own: (1) the rim above the land — how high the rim crest stands above the land around the crater; (2) the floor below the land — how far the floor lies below that same land; (3) the rim to the floor — how far the floor lies below its own rim, which is the same height whether read from the floor up or from the rim down. The third is the sum of the first two. A picture helps: a bowl set into a table with its lip standing above the tabletop. The lip above the table is the first height, the bottom of the bowl below the table the second, and the lip to the bottom the third. Two craters can have the same third height and differ entirely in how it is divided between the first two — one with a high rim and a shallow floor, the other with a low rim and a deep floor — and that division is what the longitudes record.
Each height is defined so that it can be measured on an elevation map without judgement. The rim crest is the highest point at each of 72 azimuths, between 0.85 and 1.15 of the radius; the land around is a plane fitted to the ring between 1.5 and 2 radii; the floor is the central part of the crater, out to 0.4 of the radius, with the central peak left out (§G.1). An azimuth is a compass direction from the centre of the crater; 72 of them are one every 5°, so the rim is traced all the way round. The land is read well outside the rim, at 1.5 to 2 radii, so that the rim and its nearest ejecta do not raise it. The central peak is left out of the floor, because a peak standing on the floor would otherwise make the floor look higher than it is. All three are divided by the diameter, so that a crater of 20 km and a crater of 80 km can be set side by side: what is compared is the shape, not the size.
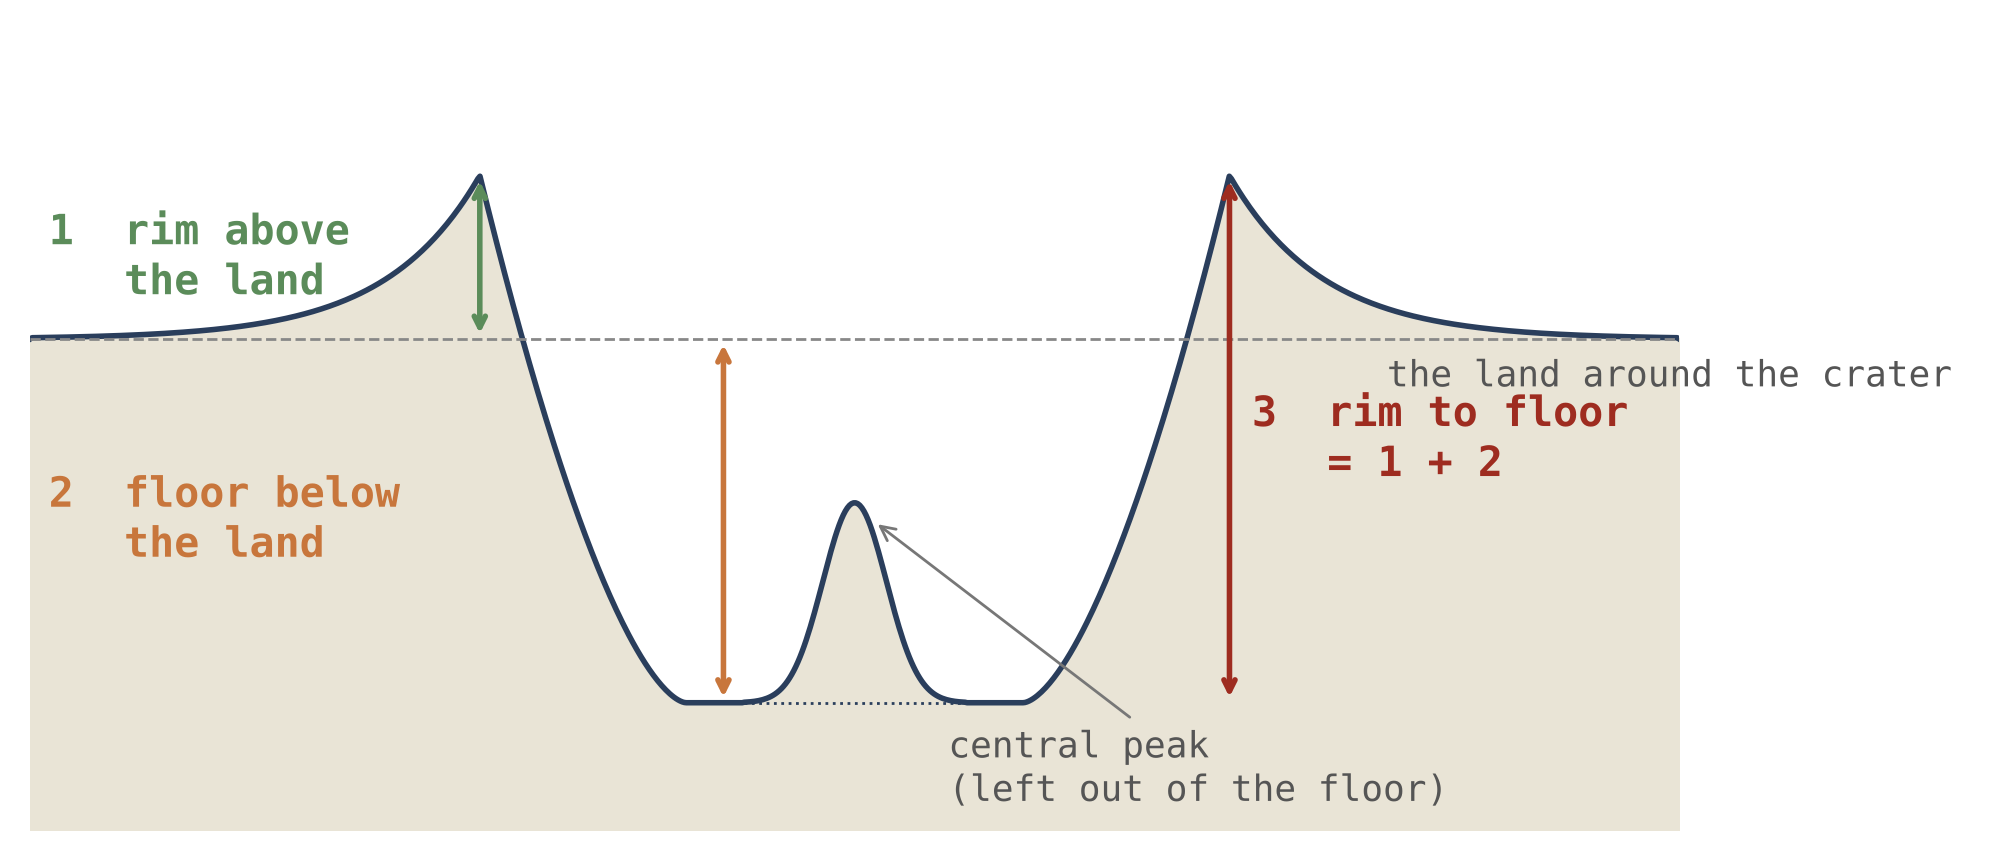
Figure 1 shows a crater in cross-section: the dashed line is the level of the land around it, the short green arrow on the left the rim standing above that level, the orange arrow the floor lying below it, and the long red arrow on the right the whole drop from rim crest to floor. The central peak rises from the floor and is left out when the floor is read.
Craters were compared only within the same size bin — 20–30, 30–50 and 50–100 km. The irregularity of the rim and the roughness of the floor were compared within the deeper half of each bin, so that a rim softened or a floor filled would not pass for landing strength; the three heights were compared over all the craters. The reason for the deeper half is this: a crater that has been worn or partly filled looks smoother than it was made, and if such craters were mixed in, a half of the Moon with more worn craters would look as though it had been landed on more gently. Restricting the comparison to the deeper, better-kept craters removes that confusion.
The rims are not equally kept. By how well the rim is preserved, 43% of the 90°W craters fall in the better-preserved half, 50% at 90°E, 57% at 180° and 46% at 0°. If the rims were equally kept everywhere, each longitude would have 50%; the leading half, 90°W, lies below that and the far side, 180°, above it. This is erosion, not age. The trailing half is sheltered from the direction of the Moon’s motion, and over the years its rims were kept; the leading half faces that direction, and its rims were worn down. It is the reason the rim and floor measures above are read in the deeper half of each bin.
What we now have: the terms of the model, a vocabulary for the parts of a crater, and three heights, each with its own reference level, that are read separately in Parts F–I.
What the series has fixed
the craters are read through the construction of Paper 3. The approach: the stages in which the craters were made are stated once, and not derived again.
This paper builds on the papers before it and does not repeat their arguments. From Paper 3, LEF Mechanism in Practice, it takes the way the body was built on the Earth and the order of its stages; from Paper 5, The Maria, it takes the openings that threw the returning material; from Paper 7, The Poles, it takes what became of the craters as the body rounded. This Part states what is taken and where each item is derived, so that a reader who wishes to check one of them is sent to its source.
B.1The three stages of Paper 3
In the model the Earth, spinning fast, raised a bulge that was drawn out into a pear shape, and the body that became the Moon was built on its tip, its outer shell standing on the Earth as the surface of a dome (Paper 3). The construction ran through three stages, named by the change in the body’s shape.
The craters were made in the three stages of Paper 3. In the outward rounding, as the body seated on the tip of the pear became a ball, the craters already on the shell changed with the surface, alike everywhere, and new ones kept arriving. In the flattening that followed, most of the craters formed, and the largest: the differentiation had advanced, and the material ejected was light and rich in water. Differentiation is the separation of a melt into heavier and lighter parts, as cream rises on standing milk; by the flattening it had gone far enough that what reached the openings was the light, water-rich part. The force that threw it was the pressure from the Earth, created by the spin and the sorting and passing through the pear to the openings; its volatiles — water and the other substances that turn to gas easily — assisted, and the light material was thrown far and fast. In the inward rounding, as the flattening relaxed and the body densified, the craters kept their size and the poles gathered them (Paper 7).
| Stage | What happened to the craters | Where it is derived |
|---|---|---|
| Outward rounding | The craters on the shell changed with the surface, alike everywhere; new ones kept arriving | Paper 3 |
| Flattening | Most craters formed, and the largest, from light, water-rich material | Paper 3 (§B.6–B.7) |
| Inward rounding | The craters kept their size; the poles gathered them | Paper 3; Paper 7 (§D.5) |
The colour of the rows marks how many craters each stage made: the flattening, the darkest, made most of them. The point that matters for everything that follows is the last column of the third row. A crater made on the shell while it lay on the Earth rode on the shell and kept its size as the body rounded (Paper 3, §B.6; Paper 7, §D.5); it is not to be recomputed as though it had formed in today’s lunar gravity (§C.6). The openings that threw the material are the maria of Paper 5 (§C.1).
Craters of 5 km and less are dominated by spray and secondary craters and are not compared in this paper. They are left out because they cannot be traced to a single landing: a small crater may be a primary landing, a lump of ejecta from a neighbouring crater, or a drop of spray from a nearby opening, and a count of them mixes the three.
The craters: what a crater is, how many there are, and the crater as a record of the returning material
a crater is read in the literature as the mark of a body from outside. The approach: the source of the returning material is named, the craters are counted, and the craters around each source are tested for its material.
This Part answers three questions in turn. Where did the material that made the craters come from (§§C.1–C.2)? How many craters are there, and where are they densest (§C.3, Study 1)? And does a crater carry the material of its source (§§C.4–C.5)? The last section, §C.6, asks how large a returning body had to be to make a given crater on the parent, where gravity was stronger and the landing slower than for a body from outside on the Moon today.
C.1 The maria: where the returning material came from
The openings from which the returning material was thrown (Part J) are the maria (Paper 5). At the flat stage they are the openings of the shell on the parent, and the material they throw lands on it at the speeds of §K.1; later they are the openings of the body itself, and what they throw falls back on it at the body’s escape speed or less (§K.4). The two speeds are very different. On the parent, material thrown up at a given speed comes back to the same height at that same speed — 5 km/s out, 5 km/s back (§K.1) — as a stone thrown straight up returns to the hand at the speed it left. On the body, which is far smaller, the ejection was weaker: the escape speed, the speed above which thrown material does not come back, was about 2.0 km/s at 1,300 kg/m³ and 2.3 km/s at release (§K.4), and everything slower than that fell back.
One mechanism behind the throwing (the author’s insight). The spin, the sorting and the pressure are one mechanism: the spin creates centrifugal pressure and drives the sorting; the sorting concentrates heavy material and presses the rest outward. This is what throws material out of a young, fast, still-unsorted body — and most of it keeps returning. A body already sorted and slow can no longer form a pear or throw out a moon.
Most of the craters near a mare were made by that mare; where two maria lie close together, the returning material of one lands in the region of the other. A large part of what a mare throws falls back into its own mouth and is melted again; a landing outside the mare takes the material out of the cycle, and where it lands it makes a crater. The picture is that of a pot boiling over: most of the drops fall back into the pot, and only those that fall on the stove stay where they land. The material leaving a mare at any moment carries the mare’s concentration at that moment, so that the chemistry of a mare and of the craters beside it are expected to correspond. This last sentence is the basis of the source test of §C.5.
How the literature reads a crater. A crater is a hole dug by a body from outside — an asteroid or a comet — and a mare is a giant basin of the same kind, filled hundreds of millions of years later by basalt risen from the mantle. Some 170 floor-fractured craters, with shallow, cracked floors carrying mare patches and pyroclastic vents [S9], are read as ordinary craters lifted from below by an intrusion that spread as a sill beneath the floor. A pyroclastic vent is a place where gas-rich melt erupted as a spray of glassy beads; a sill is a flat sheet of melt that forced its way sideways between layers, lifting what lay above it.
How the model reads it. A crater is the place where returning material landed. There is no blow from outside and no intrusion: what lies beneath a crater is the layers it landed on, and what stands at its centre is the energy of the landing. The two readings agree on what is seen and differ on what made it. The difference can be tested, because the model ties each crater to a nearby source whose material it should carry; the reading of a body from outside ties it to no particular place on the Moon.
C.2What the crater takes from the mare
The floor of a mare, its feed dome and its rim are the subject of Paper 5 (Parts D–F), and are not repeated here. Two things are taken from it. A mare floor froze after most of the returning material had landed, so that it is the last record of the craters (§D.2). And the rim of a mare was built by spray: the maria that carry many small craters on their rims are likely the maria rich in volatiles, whose active spray landed on the rim and made small craters there (§O.1). The first point explains why mare floors carry few craters: they were still liquid, or melted again, while most of the craters were being made, and kept only what landed after they froze. The second gives a test that is listed with the others in §O.1: the small craters on the rim of a mare should be more numerous where the mare was richer in volatiles.
C.3How many craters
The question this section answers is where on the Moon the large craters are densest, and whether that place is the one the model predicts or the one the literature predicts. The two predictions point in opposite directions (Study 1, Step 1), so a clean count decides between them.
The first prediction is a count. The Robbins catalogue [S6] was counted in four caps of 30° radius on the equator, centred on the four longitudes: craters of 20 km and more per million km², with the maria and South Pole–Aitken removed, and in the second column the 20 large basins as well.
| Cap centre | Maria and SPA removed | Also basins removed |
|---|---|---|
| 90°E — trailing | 249 | 252 |
| 180° — far side | 203 | 221 |
| 90°W — leading | 139 | 175 |
| 0° — near side | 135 | 148 |
The table is read from top to bottom: the rows are ordered from the densest cap to the sparsest, and the colour fades with the density. The trailing half, 90°E, holds about 250 craters of 20 km and more on every million km² of land; the leading half, 90°W, and the near side, 0°, hold 135–175. The second column removes the large basins as well; it raises the poorer caps more than the trailing one, because the basins had erased more of their craters, but it does not change the order.
The trailing half is the densest and the leading half among the sparsest, in the order the table of §K.4 predicts. The prediction runs as follows. The attached body turned with the Earth. Material it threw up from its trailing half came down while that half moved away from it, and so caught up with the ground gently, and stayed; material thrown from the far side lagged a little behind the turn and drifted toward 90°E as well. The trailing half therefore collected its own ejecta and those of the far side. The leading half moved on into what it had thrown, as a runner moves into rain, and was struck harder but not more often.
The difference lies in the small and middle craters: below about 70 km the trailing half holds 1.2 to 2.4 times the leading half’s population per size bin, while above it the two are alike or the leading half the richer. This is what the model expects: the body’s own ejecta were weak, and made the small and middle craters; the largest craters formed in the flattening, from the strong ejections of that stage, and are spread more evenly. The size distribution points the same way: the population at 90°E is displaced toward smaller craters, by a factor of 0.75–0.81 against 90°W, as softer landings of the same mass would make it, though the interval of that factor still includes one. A factor below one means that the same population of landings made somewhat smaller craters on the trailing half; because its interval still includes one, this measure supports the reading but does not yet decide it alone. The crowding of 90°E is also read through the maria of that half (Paper 5); the two readings are one, since the maria are openings and the openings eject.
Behind the scenes. An earlier version of this count called 90°E the leading face, and had the attached body overtake material lagging behind it. Under the convention of the series 90°E is the trailing half, and the excess counted there had been given the wrong name. Reading the flights from the body’s own openings, rather than from the parent, put the excess where it is and added the second prediction, of landing strength.
The phenomenon. The Moon’s large craters are not spread evenly in longitude. The gap in knowledge. The literature expects an excess on the leading half, 90°W, because the Moon runs into the bodies in its path; the model expects an excess on the trailing half, 90°E, because the body’s own ejecta fell back toward it (§K.4). A clean count that removes the maria, which erase craters, has to decide between them. The research question: with the maria and South Pole–Aitken removed from every region, which of the four longitudes holds the most craters of 20 km and more, and does the difference lie in the small craters or in the large?
For bodies arriving from outside, a synchronously rotating Moon meets more of them on its leading side; models of the present bombardment predict a leading-side excess of some tens of per cent [S22, S23]. A synchronously rotating Moon is one that turns once on its axis in each orbit and so keeps the same face to the Earth; its leading side then always meets the oncoming bodies first, as the windscreen of a moving car collects more rain than its rear window. The excess is used to correct the crater chronology of the Moon [S22]. Counting in equal caps on a global catalogue [S6] is the standard method. What is new here: the four longitudes are counted side by side, the maria and SPA removed from each cap, and with the large basins removed as well, so that no region is favoured by what was erased in it.
The trailing half, 90°E, holds more craters of 20 km and more than the leading half, 90°W; the excess lies in the small and middle sizes, made by the body’s own ejecta, and not in the largest craters.
Type of research: quantitative; craters counted per area and compared between regions. The sample: the craters of 20 km and more of the Robbins catalogue [S6] in four caps of 30° radius on the equator, centred on 0°, 90°E, 180° and 90°W. The tools: the catalogue, the LROC mare map, a mask of SPA and of the 20 large basins, and code that counts craters and areas on the sphere. A mask is a map of the areas to be left out: every crater and every piece of area that falls inside it is removed from the count before the density is computed. The table gives the reason for each choice.
| Choice | Why, in plain words |
|---|---|
| Caps of equal size on the equator | So that latitude, which crowds craters toward the poles, is the same for all four |
| Maria removed from every cap | The maria covered the craters beneath them; a cap with more mare would look poorer for that reason alone |
| SPA and the large basins removed | A giant basin erased the craters within it; removing them keeps the comparison like for like |
| Density per million km of land left | The caps keep different areas after the masks; density makes them comparable |
In the cap of 90°E, 582 craters on 2.34 million km of land; at 90°W, 316 on 2.27; at 180°, 424 on 2.09; at 0°, 193 on 1.43. With the basins removed as well: 370 on 1.47, 308 on 1.76, 368 on 1.67 and 154 on 1.04. The densities are the table at the head of this section. Each density is the count divided by the area: 582 craters on 2.34 million km give 249 per million km. The near-side cap keeps the least land, 1.43 million km, because most of it is mare and was masked.
Is the difference larger than chance? A count of craters scatters by about its square root; the interval of a ratio of two densities follows from the two counts. A count of 316 craters, for example, would be expected to vary by about 18 from one equally likely sample to the next; the 95% interval is the range within which the true ratio lies with that confidence. The trailing half against the leading half: 1.79 (95% interval 1.56–2.05) with the maria and SPA removed, and 1.44 (1.24–1.67) with the basins removed as well. Neither interval reaches one. A ratio of one would mean no difference; an interval that stays above one means that the excess of the trailing half is not an accident of counting. Because craters cluster around their sources, the interval was found again by resampling whole cells of 5° by 5° rather than single craters: 1.48–2.19, still far from one. Resampling draws the cells again and again at random, with repeats, and recomputes the ratio each time; drawing whole cells keeps each cluster together, so that a cluster is not counted as many independent craters, which would make the interval too narrow. Where the difference lies. Dividing the craters into size bins, the trailing half holds 1.2 to 2.4 times the leading half’s craters in each bin below about 70 km; above it the two are alike. The shape of the size distribution. The population at 90°E is shifted toward smaller craters by a factor of 0.75–0.81 against 90°W; the interval of that factor still includes one.
Result. The hypothesis is supported: the trailing half holds the most craters, by a margin that chance does not explain, and the excess lies in the small and middle sizes. The literature’s leading-half excess is not found. Limitations. The caps are four samples of the surface and do not map the whole longitude curve; the shift of the size distribution is not yet significant. Directions for further research. A count in narrow longitude strips at every latitude, with intervals that allow for clustering, and the same count for craters of 5–20 km.
C.4 The crater record is the record of the maria
The crater record is the record of the maria. If the maria made the craters, the density of craters is a map of where the maria worked — the visible maria and the buried feed domes of §D.1 alike — and the last craters to form are those of the last active maria; older craters beneath them were erased by the same heat. An active mare scatters its own craters around it — the rim of Crisium is ringed by them — and where there are no maria and only heat, craters were erased and none were made. Material thrown by a mare can also land far from it: a crater far from any mare may belong to a visible mare or to a buried feed dome. A buried feed dome is a source that worked early and was later covered by the layers of the far side, together with the craters it had made; it is seen today only in the gravity field (Paper 5; §D.1).
The record is the last one written, not the first. A surface keeps the craters that landed on it after it last froze; what landed before was melted or covered. The large maria of the near side are the last of all: at release they were cut off from the Earth’s pressure; they were then hot and of low viscosity, and froze slowly, from the outside inward, over hundreds of millions of years — after most of the returning material had landed. Their surfaces are smooth and carry few craters, at most remnants here and there: Mare Imbrium holds 10 craters of 20 km and more on 871,000 km² of floor, 11 per million km², against 205 on the highlands (Paper 5, §I.5; credited in an earlier version to Paper 3, §C.10). The floor of Imbrium thus carries about one crater for every eighteen that the same area of highland carries: it froze after most of the craters had fallen.
C.5The source test
The question this section answers is whether a crater carries the material of the mare that made it. If it does, the maria are not only where the craters lie but where their material came from.
The source test. Material thrown by a mare carries its chemistry. A crater near a mare that carries that mare’s signature — iron, titanium, thorium — was made by it; a crater without it came from farther away. The test is stated in §O.1: the craters around each mare are chosen before their chemistry is read, and the fraction carrying the mare’s signature is measured against distance from it. Choosing the craters first, and only then reading their chemistry, keeps the choice from being steered, even unknowingly, by the answer.
One caution is built into the test, and it concerns how hard the returning material landed. A hard landing digs out and exposes the ground beneath, and the crater then shows mostly the chemistry of that ground; a soft landing may hardly expose the ground, and more of the returning material stays on the surface. How hard it landed depends on where: the leading half, 90°W, takes the hard landings, the trailing half, 90°E, the soft ones. It was measured by longitude, and the inside of the crater holds the same material on both halves (§L.4). The caution therefore does not divide the result: the material inside the crater is the same whether the landing was hard or soft.
The source test, measured. The maria are the 34 openings of Paper 5, identified on the gravity gradients, each over a feed dome (34 in Paper 5, Appendix A; the crust test there used the 36 original marks); the dark plains without a feed dome — Procellarum, Tranquillitatis, Fecunditatis and the like — are not maria but crust melted in place (Paper 5, §C.2), and they are read apart. A gravity gradient is how fast the gravity changes from one place to the next; it is strongest at the edge of a dense body beneath the surface, and so draws its outline. The test was run on 11,574 craters of 5–60 km outside the basalt, around six maria (Crisium, Imbrium, Moscoviense, Nectaris, Serenitatis, Smythii) and three plains (Procellarum, Tranquillitatis, Fecunditatis), chosen and frozen before any chemistry was read, with 5,922 matched control craters more than 600 km from any basalt [S10]. The controls are craters of the same sizes, far from any mare, where no mare’s material can be expected; they give the level of the ground that owes nothing to a mare. Iron and titanium are from the Kaguya Multiband Imager maps, thorium from Lunar Prospector:
| Distance from the edge | 0–50 km | 50–150 | 150–300 | 300–600 | Controls (600) |
|---|---|---|---|---|---|
| Around the six maria | |||||
| FeO of the ground, 3–4 radii (wt%) | 5.96 | 3.54 | 3.28 | 3.40 | 2.30 |
| FeO inside the crater (wt%) | 5.88 | 3.33 | 3.17 | 3.30 | 2.37 |
| Crater minus its ground, FeO | |||||
| Th of the ejecta (ppm; a regional value) | 2.16 | 1.66 | 1.36 | 1.39 | 1.02 |
| Around the three plains | |||||
| FeO of the ground (wt%) | 9.41 | 6.10 | 4.24 | 2.60 | 2.30 |
| Crater minus its ground, FeO | |||||
| Th of the ejecta (ppm) | 3.13 | 2.65 | 1.99 | 1.61 | 1.02 |
How to read the table. The columns are distance from the edge of the mare or plain, growing to the right, with the far controls in the last column; the strength of the orange shows how much mare material each cell holds, and it fades to the right. The ground is read in a ring at 3–4 crater radii around each crater, with the mapped basalt removed, so that it is the land beside the crater and not the mare itself. The inside of the crater is read within its rim. The row crater minus its ground is read crater by crater, each crater against its own ground; it is therefore not simply the difference of the two rows above it, which are values of whole rings. Thorium is read on the ejecta, and is a regional value because the Lunar Prospector cells are broad, wider than most of the craters.
Around the maria the ground carries the mare’s iron, two and a half times the controls within 50 km, and still half as much again at 300–600 km; the crater is a little poorer than its ground at every distance. In numbers: 5.96 wt% FeO within 50 km against 2.30 in the controls, and 3.40 at 300–600 km. Thorium follows the same course, from 2.16 ppm near the edge to 1.02 in the controls. The difference of the crater from its ground is small but has the same sign at every distance near a mare, and almost vanishes in the controls (). It does not change the main result, the fall-off of the mare’s signature with distance; what the difference measures, and how the model reads it, is set out in §L.2.
Around the plains the ground is richer near the edge and falls to the level of the controls far from them: the plains threw nothing and spilled nothing, and the excess beside them does not reach far. Their iron starts higher, 9.41 wt% within 50 km, and falls to 2.60 at 300–600 km, almost the 2.30 of the controls; around the maria an excess remains at that distance. The difference in reach is the difference between an opening and a plain: an opening threw its material hundreds of kilometres, and the maria, apart from those of the contact, also spilled their melt over their margins; a plain of crust melted in place threw and spilled nothing.
The research. The research behind the source test, Study 2, is set out step by step in §L.1.
C.6 Crater size and mass of the returning body
The question this section answers is how large a returning body had to be to make a crater of a given size on the parent. It matters because the parent differs from the Moon of today in two ways that pull in opposite directions: its gravity was stronger, which makes a crater smaller for the same blow, and the landing was slower than an asteroid’s, which also makes it smaller. A crater of the same size therefore needed a heavier returning body. The tool is a scaling law: a rule, fitted to experiments, that connects the size of a crater to the size and speed of what made it and to the gravity of the target.
In an ideal gravity-regime scaling law, with the other material properties fixed:
Here is the diameter of the excavation cavity — the hole dug out before the walls slump — the diameter of the returning body, its landing speed and the gravity of the target. The term says that a faster landing digs wider and a stronger gravity holds the crater back. The exponent is a property of the target material, measured in experiments: higher for a solid, non-porous target and lower for a loose or porous one; this paper examines 0.35 and 0.55, and is derived from it. Gravity regime means that the size of the crater is limited by the weight of the material that must be lifted out, not by its strength, which is the case for craters kilometres across.
Hence, for the same excavation diameter:
Equation (2) follows from (1) by holding fixed and writing the mass of the returning body as its volume, which grows as . It says that the mass needed grows with the gravity of the target and falls with the landing speed: a heavier blow is needed where gravity is stronger and where the landing is slower.
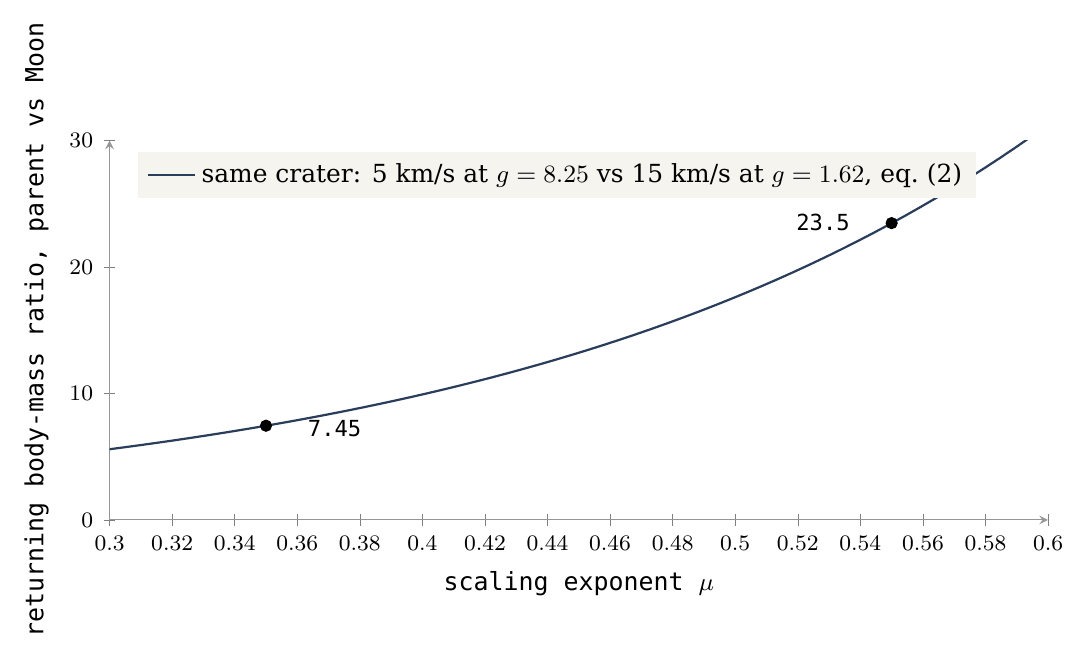
Comparing an external impacting body at 15 km/s in gravity 1.62 with a landing at 5 km/s in gravity 8.25, a mass ratio of about 7.45 is obtained for , and about 23.47 for . The first case is the reading of the literature: a body from outside landing on today’s Moon, whose gravity is 1.62 m/s². The second is the model’s: returning material landing at 5 km/s on the parent at the ejection radius, where the gravity was 8.25 m/s². The gravity is about five times larger and the speed three times smaller, and both raise the mass needed; the ratio is therefore between about 7 and about 23, depending on . These are sensitivity tests of the scaling law [S5], not a mass reconstruction of particular craters. The target coefficient, density of the returning body, strength, layering and the transition from excavation cavity to final crater require calibration.
This test matters because the proposed crater formed on the parent body before being transported. It must not be computed automatically in the present lunar gravity; once made, it rode on the shell and kept its size (Paper 3, §B.6; Paper 7, §D.5). A low magma density does not fix the porosity of the crustal surface or its . The density of the body as a whole says nothing direct about how loose the uppermost layer was where the crater formed, and it is that layer that sets . How much of the crust the returning bodies built is therefore not fixed here: a reconstructed catalogue, a calibration for each target and a fraction of retained mass are missing. Each of the three is a requirement for turning the sensitivity into a mass budget, and they are listed with the further work.
Figure 2 draws equation (2) as a curve: the horizontal axis is the scaling exponent , the vertical the mass ratio, and the two dots mark the values computed above. Its message is the steepness of the curve: across the plausible range of the ratio changes by a factor of three, which is why the target must be calibrated before a mass is assigned to any crater.
What we now have: the source of the craters named (the maria and the buried feed domes), their count by longitude with the trailing half the densest, the mare’s iron found in the ground around every mare and fading with distance, and the scale of the returning body bounded by a sensitivity, not yet by a calibration.
The craters, visible and buried
not every crater that was made is seen today. The approach: the craters are counted where they lie on the ground, where they were buried with the sources of the far side, and where the floors of the maria covered them, each against the land around it with the maria removed from both sides.
Part C showed that the maria are the source of the returning material, so that the density of craters is a map of where the maria worked. A map of that kind can be read only if one knows which craters it has lost. This Part counts the missing craters. A crater can disappear from view in two different ways, and the model keeps two different words for them.
Buried is used here only for the far side, and only together with the source. A feed dome that worked early and then stopped was covered, with everything around it, by the layers that later built the far side; the craters it had made lay on the same ground and went under with it. Nothing of them is seen; the dome beneath is found by its gravity alone (§D.1).
Melted is used for the floors of the maria. A mare is an opening over a feed dome, and while it was active its floor was liquid or soft. Returning material that landed on it made a crater in ground that had not yet frozen: the crater sank into the floor and closed, and at most its ring is seen today, standing almost at the level of the mare (§D.2). The literature knows these rings too, but calls them buried or flooded craters: in its reading a crater was dug into an older, solid surface, and basalt that rose much later filled it. The two readings differ in what came first. In the literature the crater is older than the basalt; in the model the crater was made while the basalt was still active. For that reason this paper does not call a ring on a mare floor “buried”; the word appears below only where the literature’s reading is described. The two readings also leave different traces — in the mass beneath the crater (§D.3) and in its rim (§E.6) — and these are tested.
D.1 Craters buried with the sources of the far side
The question of this section is whether the craters made by the hidden sources of the far side went under together with them, and whether the large craters seen today depend on the visible maria alone.
The sources that are no longer seen. The visible maria are not the only sources. Paper 5 (§D.4–D.5) finds 73 feed domes in the gravity field: dense round bodies, each the frozen remainder of the material that rose beneath an opening. Of the 40 on the far side, 36 are buried under bright highland, with the same iron and thorium above them as around them and a crust thicker by 8–13 km. Both facts say the same thing: the surface over these domes is the ordinary cover of the far side, laid over them after they stopped working, and the extra crust is the thickness of that cover. A source that worked early, through the flattening, and stopped, was covered by the layers that built the far side — the parent’s sial and returning material, laid down layer upon layer (Paper 3, §B.7) — and the craters it had made were covered with it. This has a consequence that can be measured. A source scatters craters around itself, so an active source that stayed in view would be surrounded by a crowd of craters. Around the buried domes the craters do not gather: their density on the dome and around it is the same as or lower than farther out (0.48–0.95 of the ground at 3–5 radii), because the craters made in their time were buried with them. A ratio of one would mean “as many as on the ground farther out”; every value here is at or below it.
The large craters. The large craters, of 20 km and more, were mapped by their density over the whole Moon, with the mare ground removed, and the visible maria and the feed domes laid over the map (Figure 3). The mare ground is removed because a mare floor has lost its craters for its own reason (§D.2); keeping it would make every region with maria look poor in craters and would mix the two questions. Their densest ground lies in the north of the far side, between 140°W and 180° and between 120°E and 150°E, in the south of the near side below Nectaris and Nubium, and in the southeast of the far side; the sparsest lies around the large maria of the near side and around Orientale. Away from today’s maria the large craters are denser, not sparser: for 10–50 km, 467 per million km within 150 km of a mare edge against 1,040 beyond 1,000 km — more than twice as many far from the maria as next to them. That does not make them foreign to the visible maria: what a mare throws can land far from it, as a stone thrown hard lands far from the hand. The large craters seen today come from the feed domes of both kinds — the buried domes of the far side and today’s visible maria.
Why some sources made the largest craters is part of the same history. The water came late: differentiation — the sorting of the parent’s material by density and by what it carries — advanced through the construction, and the later outflows were the richer in volatiles (Paper 3, §B.7); a mare rich in volatiles threw the water-laden material that made the largest craters of the flattening (Paper 3, §B.6). The other side of the same sorting is the iron: the deeper the layer, the more iron in it, and as the volatiles left, the heavy material stayed — the frozen feed dome is the densest and most iron-rich body of all. That is why the domes can be found in the gravity field even where nothing on the surface shows them.
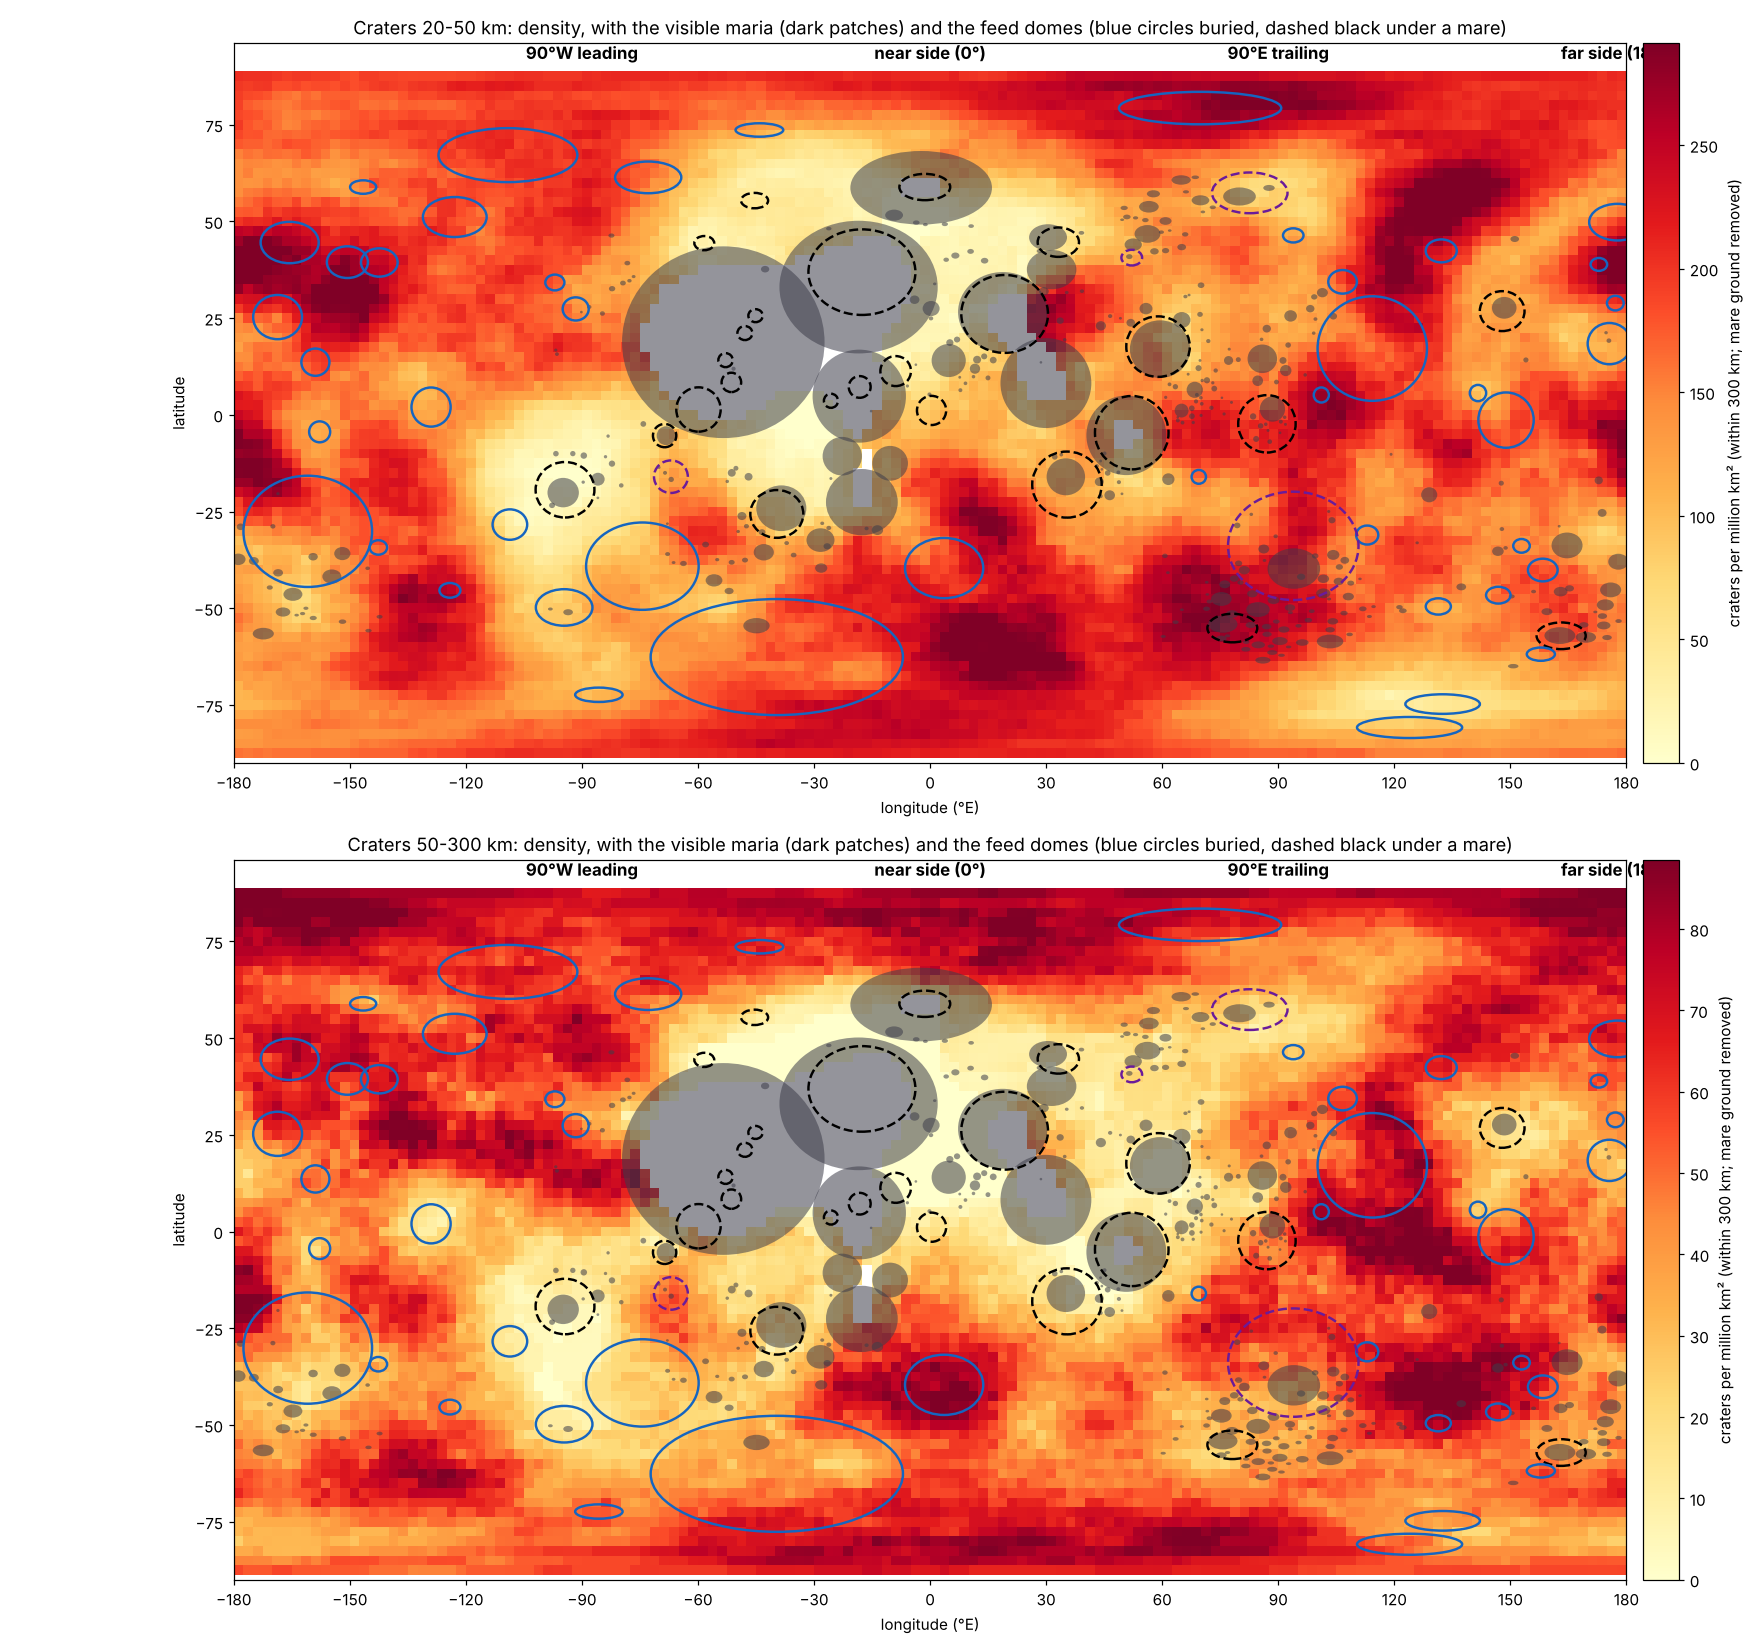
How to read Figure 3: each point of the map is coloured by how many large craters lie within 300 km of it, so dense ground stands out as broad bright patches and sparse ground as dark ones. Compare the patches with the overlays. The densest patches fall in the north of the far side and below Nectaris and Nubium, among the blue outlines of the buried domes; the darkest ground surrounds the grey discs of the large near-side maria. The two panels, for two size ranges, show the same pattern.
The phenomenon. The gravity field shows dense round bodies under bright highland, where no mare is seen, most of them on the far side (Paper 5, §D.4). The gap in knowledge. If these are sources that worked early and were then covered, the craters they made must have been covered with them; and the large craters seen today must not depend on the visible maria alone. The research question: do the craters gather around the buried feed domes, and where on the Moon do the large craters lie relative to the visible maria and the buried domes?
Buried maria, “cryptomaria”, are known from dark-halo craters that dug up basalt from under a highland cover, and from their gravity and composition [S24]; the literature reads them as early lava flows covered by the ejecta of later basins. The global density of large craters is the standard measure of the age of a surface: the longer a surface has been exposed, the more craters it has collected. What is new here: the crater density is read on and around every buried dome against the ground farther out, and the global map of large craters is read against both the visible maria and the buried domes together.
The craters made by a buried source in its time were buried with it, so the craters do not gather on and around the buried domes; and the large craters seen today come from both kinds of source, so they are not sparsest far from the visible maria.
Type of research: quantitative, comparing densities in rings and in distance bands. The sample: the 44 buried feed domes of Paper 5 (§D.4) — the 36 of the far side and 8 at the margins of the near side — and all craters of 20 km and more of the Wang & Wu catalogue [S16], the mare ground removed. The tools: the GRAIL gravity field for the domes, the LROC mare map, and code that maps the crater density within 300 km of every point. The table gives each comparison and the reason for it.
| Comparison | Why, in plain words |
|---|---|
| On the dome against 3–5 dome radii | If the dome had scattered craters that survive, they would crowd near it |
| Within 150 km of a mare edge against beyond 1,000 km | If only the visible maria made the large craters, the craters would be densest near them |
| Mare ground removed everywhere | The maria covered craters; the comparison reads only the land |
For each buried dome the craters on it and in the ring of 3–5 radii were counted on the land. For the map, the craters of 10–50 km and of 50–300 km were counted within 300 km of every point of a global grid, and their distance from the nearest mare edge recorded.
Around the buried domes. The density of craters on the domes is 0.48–0.95 of that on the ground at 3–5 radii: never higher. Pooled over the 44 buried domes and read against the ring at their edge, with intervals found by resampling the domes: 0.93 (0.84–1.01) for craters of 2–10 km, 1.00 (0.92–1.08) for 10–50 km and 1.02 (0.81–1.29) for 50–100 km. What the intervals mean. Resampling asks how much the result would change if a different set of domes had happened to be measured: the domes are drawn again at random many times, the ratio is recomputed each time, and the range in brackets holds the middle 95 of every 100 results. Each range contains the value one — “as many craters on the dome as around it” — and none lies above it. No size shows an excess on the domes. Against the visible maria. For craters of 10–50 km, 467 per million km within 150 km of a mare edge against 1,040 beyond 1,000 km: the large craters are denser away from the visible maria, not near them. The map. The densest ground lies in the north of the far side and in the south of the near side below Nectaris and Nubium, among the buried domes; the sparsest around the large near-side maria and Orientale (Figure 3).
Result. Both parts are supported: no crater excess gathers on the buried domes, and the large craters are not tied to the visible maria alone; they come from both kinds of source. Limitations. The ground near a visible mare is partly covered by its own material, which lowers the count there for a reason of its own; and a buried dome is identified by gravity alone. A specialist may object that the low count near the maria is only this cover. The objection does not reverse the result: the craters are not merely fewer at the mare edge but more than twice as dense beyond 1,000 km, far outside the reach of any cover, and the densest ground lies among the buried domes. Directions for further research. The ratio on each dome with its interval, and a test of whether the craters of a given size gather around the domes of the far side when the domes are sorted by strength.
What we now have: on the far side, craters were lost together with the sources that made them, and the large craters that remain come from the buried domes and the visible maria alike.
D.2 Craters melted into the floors of the maria
The second way a crater is lost is on the floor of a mare. This section asks how many of the craters on the mare floors landed while the floor was still active and melted into it, and how many were made after it froze.
The test. Every crater of 10 km and more whose centre lies on basalt was taken from the catalogue of Wang & Wu [S16], which gives the depth of each crater from the global elevation models, and assigned to the floor of a mare — within the core of the feed dome beneath one of the 34 maria of Paper 5 — or to a plain, the basalt outside every mare. The difference matters: the floor of a mare is the surface of the opening itself, over its feed dome; a plain is crust melted in place, without a channel from below. Its depth-to-diameter ratio was compared with that of the highland craters of the same size, the basalt removed from the highland sample. The highland craters serve as the measure of a normal crater, one made on firm ground and left as it was made. A crater shallower than 95% of the highland craters of its size is counted melted: it landed on the active ground, melted into it, and is seen only as a ring. One shallower than 75% of them is smeared: its form survives, but its floor has filled and its walls have slumped. The rest are sharp, made after the ground froze. Put the other way round, the rule would call only 5 of every 100 ordinary highland craters melted; a share far above that on the mare floors cannot be the ordinary spread of crater depths. A crater that melted and vanished into an active mare is in no catalogue; it is seen only as the absence of craters on the floor (Paper 5, §G.2).
The table below gives the result by zone. The zones are those of Paper 3, which divide today’s Moon by where each part stood on the body while it was attached. The contact is the region still attached to the Earth at release, the last to separate and the last to cool; the hill is the wider region around it, which sat over the wide tip when the rounding began; beyond is the rest of the Moon. The contact lies inside the hill, so moving from “beyond” to “the hill” to “the contact” is moving toward the ground that stayed hot longest. The shading follows that direction: the deeper the blue (floors of the maria) or orange (plains), the nearer the contact. Read the melted share down each block, and compare the last column — the sharp craters, made after the ground froze — with the 207 per million km of the highlands at the foot of the table.
| Area (km) | Craters 10 km | Melted | 20 km per million km | Sharp 20 km per million km | |
|---|---|---|---|---|---|
| Floors of the maria | |||||
| The contact | 702,717 | 3 | 0 | 0 | 0 |
| The hill | 363,245 | 48 | 34 (71%) | 71.6 | 0 |
| Beyond | 115,838 | 28 | 15 (54%) | 51.8 | 8.6 |
| All floors | 1,181,800 | 79 | 49 (62%) | 27.1 | 0.8 |
| The plains | |||||
| The contact | 3,429,919 | 233 | 135 (58%) | 33.2 | 2.3 |
| The hill | 1,317,550 | 424 | 187 (44%) | 171.5 | 42.5 |
| Beyond | 218,655 | 118 | 33 (28%) | 329.3 | 123.5 |
| All plains | 4,966,124 | 775 | 355 (46%) | 83.0 | 18.3 |
| The highlands, basalt removed | 207 | ||||
Zones of Paper 3: the contact within 1,500 km of 24.1°N 335.2°E;
the hill within 3,000 km of 16.6°N 13.1°E; beyond, the rest.
The floors froze last. On the floors of the maria three of every five craters counted are melted (62%), and of the craters of 20 km and more only one, on all 1.2 million km of floor, is sharp: 0.8 per million km, against 18 on the plains and 207 on the highlands (205 in §C.4 and in Paper 5, where the openings rather than the mapped basalt are removed from the highland: a slightly different highland area). The share of 62% is the central number of this section. It says that most of the craters the floors still show were made while the floors were active: the returning material was still landing when the maria were liquid, and the floors froze only after most of it had come down. The craters were made while the maria were active, and melted into the floors before they froze. The sharp count says the same from the other side: if the floors had frozen early and then waited, they would have collected sharp craters at something like the rate of the highlands; they collected almost none. On the floors of the maria of the contact, 703,000 km, not one crater of 20 km and more remains, melted or sharp: they vanished into the active mare, and the three craters of 10–20 km that remain are sharp, late arrivals after the floor froze. Toward the contact the craters melt more: on the plains the melted share rises from 28% beyond the hill to 44% on the hill and 58% within the contact; on the floors of the maria from 54% beyond to 71% on the hill, and within the contact the craters are gone. The order follows the heat: the nearer the ground stood to the contact, the longer it stayed liquid, and the more of the craters that landed on it melted. The floors of the maria are therefore the last record of the craters, and what lies on them is read in Part M.
The phenomenon. Many craters on the floors of the maria are seen only as rings: their floors stand almost at the level of the mare. Others stand on the floor whole and deep. The gap in knowledge. How many of the craters on a mare floor melted into it, and how many were made on it after it froze, has not been counted against a control of the same size, with the floors of the maria apart from the plains. A plain picture helps: a pond that is freezing. Stones of wax that fall into the warm water melt and leave a ring on the surface, or vanish altogether; stones that fall after the ice has formed lie on top, whole. Counting them tells when the ice formed relative to the falling stones. The research question: of the craters of 10 km and more on the floors of the maria and on the plains, what share melted, how many were made after the ground froze, and does the share change toward the contact?
What is known. Craters seen on the maria only as rings, “ghost craters”, have been known since the first lunar maps, and craters under the near-side maria described in the literature as buried [S21] have since been found in the gravity field. The literature reads them as craters dug by external impacting bodies on an older surface and then flooded by basalt that rose later. The density of the craters counted on top of a mare is used to date its surface [S20]. What is new here. The floors of the maria — the basalt over the feed domes — are set apart from the plains, every crater is measured by its depth against highland craters of its own size, and melted and sharp craters are counted in one sample, by one rule.
In the model the floors of the maria froze after most of the returning material had landed (§C.2). The hypothesis has three parts. (a) Most of the craters counted on the floors of the maria are melted. (b) The craters made on the floors after they froze are few, far fewer than on the plains and the highlands. (c) Toward the contact, where the ground stayed liquid the longest, the craters melt more, and on the maria of the contact the large ones vanish altogether.
Type of research: quantitative; craters are counted and measured on maps made by spacecraft, and the counts compared statistically. The sample: the 854 craters of 10 km and more whose centre lies on basalt, 79 on the floors of the maria and 775 on the plains; the control: highland craters of the same size, basalt removed. The tools: a crater catalogue with depths, the LROC mare map, the feed domes of Paper 5, and code that assigns and classifies the craters. The table sets out each choice and the reason for it.
| Element | What was chosen | Why, in plain words |
|---|---|---|
| The floor of a mare | Basalt within the core of the feed dome beneath one of the 34 maria | The surface of the opening itself |
| A plain | Basalt outside every mare | Crust melted in place, without a channel |
| The control | Highland craters of the same size, basalt removed (24,080 craters) | To know what a normal crater of that size looks like |
| The crater catalogue | Wang & Wu (2021) [S16]: position, diameter and depth | It gives the depth of every crater |
| The measure | Depth divided by diameter | A melted crater is shallow for its width: only its ring is left |
How “melted” is decided. Every crater is compared only with highland craters of its own size, because a large crater is naturally shallower for its width than a small one. The rule: a crater shallower than 95 of every 100 highland craters of its size is melted; shallower than 75 of every 100, smeared; otherwise sharp. The table below turns the rule into depths. For each size class it gives how many highland craters set the standard, the typical depth-to-diameter ratio of a highland crater, and the ratio below which a crater is counted melted. The last column gives a worked example. Look at how wide the gap is: a 15 km crater, typically 1.2 km deep, is counted melted only if it is shallower than 0.4 km — a third of the normal depth. A crater counted melted is not slightly shallow; it has lost most of its depth, and what is left of it is the ring.
| Size | Highland craters | Typical depth / diameter | Melted below | Example: counted as melted if shallower than |
|---|---|---|---|---|
| 10–20 km | 17,509 | 0.077 | 0.028 | 0.4 km for a 15 km crater (typical depth 1.2 km) |
| 20–40 km | 4,331 | 0.065 | 0.023 | 0.7 km for a 30 km crater (typical 2.0 km) |
| 40–80 km | 1,707 | 0.051 | 0.016 | 1.0 km for a 60 km crater (typical 3.1 km) |
| 80 km and more | 533 | 0.034 | 0.012 | 1.4 km for a 120 km crater (typical 4.1 km) |
The rule was set on the highland craters alone, before any crater on the basalt was classified. This order matters: the thresholds could not be tuned, even unknowingly, to give the expected answer on the maria. Then every crater was assigned by its centre to the floor of a mare or to a plain, given its zone, and classified; the area of the floors and of the plains in each zone was summed on the sphere. The counts are the table at the head of this section.
How many are melted. Of the 79 craters on the floors of the maria, 49 are melted (62%), 18 smeared and 12 sharp; of the 775 on the plains, 355 are melted (46%). By the rule, an ordinary highland crater would be counted melted 5 times in 100; on the mare floors it is 62 times in 100, and on the plains 46. How few are sharp. Of the craters of 20 km and more, one is sharp on all the floors of the maria, 0.8 per million km (allowing for chance in a count of one, at most 4); on the plains 18; on the highlands 207 craters of that size. The bracket answers the obvious question about a count of one: a single crater could have come out of a somewhat higher true rate by luck, but not out of a rate above 4 per million km — still far below the plains and the highlands. The contact. On the 703,000 km of the floors of the maria of the contact no crater of 20 km and more remains, against 33 per million km on the plains of the contact; the three of 10–20 km are sharp. The change toward the contact. On the plains the melted share rises from 28% beyond the hill to 44% on the hill and 58% in the contact (chi-square test of the table of counts, probability about 3 in a million); on the floors of the maria from 54% beyond to 71% on the hill (probability 0.0003 with the contact included). What the tests mean. The chi-square test asks: if the melted share were in truth the same in every zone, how often would chance alone spread the counts as unevenly as they are? For the plains the answer is about 3 times in a million trials; for the floors of the maria, 3 times in 10,000. The rise toward the contact is therefore not an accident of small numbers.
Result. All three parts of the hypothesis are supported. Most craters on the floors of the maria are melted; the sharp ones are some two hundred times fewer than on the highlands and twenty times fewer than on the plains; and toward the contact the craters melt more, until on the maria of the contact the large ones vanished altogether. The floors froze after most of the returning material had landed, and froze late near the contact. Limitations. The craters on the floors of the maria are few, and on the contact only three; the depth of a crater is read from elevation maps, and a small crater is less well measured than a large one; a crater is assigned to the floor by its centre; and a ring crater tells that it landed before the ground froze, not by itself whether it melted or was covered. This last point is the one on which the model and the literature part: a ring is what both readings predict, and the depth alone cannot choose between them. Directions for further research. Whether the craters were covered by a later flow or melted where they landed is decided by their rims (§E.6); whether the vanished craters left their mass is read in §D.3.
What we now have: about three in five craters on the mare floors melted into them, almost none were made after they froze, and the share rises toward the contact. The next section asks what the melted craters left beneath them.
D.3 The mass under the melted craters of the maria
A crater that landed on an active mare entered it and vanished; what is seen of it on the floor is a ring. Whether the material that vanished left its mass behind was read in the gravity field, under each crater, against the ground around it. This is the test that can separate the two readings of a ring. If the crater was dug into solid ground and later filled with basalt, as the literature holds, the basalt in it forms a body with the shape of the crater, and a body with a shape has an edge. If the returning material sank into a liquid mare and mixed, as the model holds, it left extra mass with no shape and no edge.
The measurement. Under every crater of 20 km and more on the near side, the height of the base of the crust was read from the GRAIL crustal model [S31]. The base of the crust is the boundary between the light crust and the denser mantle beneath it; the crustal model places it from the measured gravity. Where the base stands higher than around, the dense mantle comes closer to the surface, and there is more mass. A plane was fitted to the ground at 1.5–3 radii and removed, and the centre (within 0.3 radius) was read against it; removing the plane takes away any broad regional tilt, so that only what lies under the crater itself remains. The maria are the 34 openings of Paper 5, each with the core of its feed dome; the plains are the basalt outside them.
The table gives the median raise of the base of the crust under each group, in km. Read it from top to bottom, and note the third row: it is the melted craters measured against their own floor, with the dome beneath already removed. The shading marks the rows that belong to the mare floors.
| Under the centre (km of raised base of the crust) | Craters | Median |
|---|---|---|
| Melted craters on the floors of the maria | 17 | |
| Random points on the same floors, same sizes | 50 per crater | |
| The craters above their own floor | 16 | , in 13 of 16 |
| Melted craters on the plains, 20–40 km | 83 | |
| Highland craters, 20–40 km | 2,636 |
A feed dome is dense, so every point on a mare floor stands over more mass than the ground around it: random points on the same floors show . That is why the melted craters cannot be read against the open land; they must be read against their own floor. The melted craters carry more than their own floor, by a median of . Under the melted craters of the plains there is neither excess nor deficit; under the highland craters, broken light material leaves a deficit. The three groups line up as the model requires: extra mass where the material landed on an active mare, none where it landed on a plain that had no mare beneath it, and the ordinary small deficit of a crater on firm ground.
No body with an edge. A dense body with a sharp edge under a crater would lay a ring of steep gravity at its edge. The test uses the GRAIL Bouguer field [S31]: the measured gravity after the pull of the visible relief has been computed and removed, so that what remains shows denser or lighter material below the surface. On it the steepness of the gravity at the edge of each crater, against inside and outside it, is the same under the melted craters of the maria (median 1.04), under random points on the same floors (1.00), under the melted craters of the plains (1.04) and under the highland craters (1.02). A value of one means that the gravity changes no more steeply at the edge than inside and outside it; all four groups lie within a few hundredths of one. Three large craters stand apart — of 68, 122 and 159 km — where the edge of the crater still stands out on the floor.
The phenomenon. On the floors of the maria many craters are seen only as rings (§D.2). The gap in knowledge. In the literature a ring on a mare is a crater flooded by basalt, and the basalt that fills it should weigh as a body shaped like the crater. In the model the crater entered the active mare and vanished in it. Whether the vanished material left mass, and whether that mass has the shape of a body, has not been measured against the floor around each crater. The research question: under the melted craters of the maria, is there more mass than under the floor around them, and does it have the edge of a body?
Craters under the near-side maria described in the literature as buried [S21] were found in the GRAIL field as rings of gravity, and read as craters flooded by basalt. The crustal model and the Bouguer field are those of the GRAIL mission [S31]. What is new here: each crater is read against random points on its own floor, so that the dome beneath the mare is removed, and the edge of the mass is read in the steepness of the gravity.
The returning material that landed on an active mare entered it and vanished, and left its mass in the mare without the shape of a body. Hence: under the melted craters of the maria there is more mass than under their own floor; under the melted craters of the plains, where there was no active mare, there is none; and the mass has no sharp edge.
Type of research: quantitative, with two control groups. The sample: the 17 melted craters of 20 km and more on the floors of the maria; the controls: 50 random points on the same floor for each crater, of the same size, and the melted craters of the plains and the highland craters of the same sizes. The random points answer the question “what does any spot on this floor show?”; the plains and highland craters answer “what does a crater show where there was no active mare?”. The tools: the GRAIL crustal model and Bouguer field [S31], the elevation models [S7], the catalogue of Wang & Wu [S16], the feed domes of Paper 5, and code that reads each crater in rings of its own radius.
The craters were classified by depth before the gravity was read (§D.2), so the choice of craters could not lean toward the gravity result. For each crater the centre was read against the ring at 1.5–3 radii, and the same was read at 50 random points on basalt within the same dome core. The steepness of the Bouguer gravity was read at 0.8–1.2 radii against 0.3–0.6 and 1.5–2.0 radii — that is, in a band around the edge of the crater, against a band inside it and a band outside it. The values are the table of §D.3.
More mass. The melted craters of the maria stand above their own floor by a median of km, in 13 of 16 (Wilcoxon test, probability 0.04); the excess does not grow with the size of the crater once the floor is removed (rank correlation 0.18). The Wilcoxon test asks whether the 16 differences, crater minus own floor, lean to one side more than chance would allow if the true difference were zero; a probability of 0.04 means that chance would produce so one-sided a result about 4 times in 100. A rank correlation of 0.18 is weak: larger craters do not carry clearly more excess. Not on the plains. The melted craters of the plains carry , against in the highland. No edge. The steepness at the edge is 1.04 under the melted craters of the maria against 1.00 under their floors (probability 0.09), as under every other group. Here a high probability is the expected result: chance alone would give a difference as large as 0.04 about 9 times in 100, so the edges of the melted craters are not steeper than the floor around them.
Result. The hypothesis is supported: the material that landed on the active maria vanished into them and left its mass there, without the shape of a body; on the plains it left none. Limitations. The craters are few and lie on seven maria, most on Smythii; the excess is small against the dome beneath; the gravity resolves some 8 km, so a thin edge could escape it. Directions for further research. The same reading on the far-side maria, and on the craters of 10–20 km with a field of higher degree.
What this Part has shown: the craters that are not seen were lost in two ways. On the far side they were buried together with the sources that made them; on the floors of the maria they melted into the active ground, about three in five of those still counted there, and left their mass beneath without the shape of a body.
Size and state: the maria and the craters in time
the craters on the floors of the maria are not all in one state: some are melted, some smeared, some sharp, and the state follows the size. The approach: the state of every crater on the near-side mare floors is measured against its size, and read through the temperature and viscosity of the maria and of the arriving material, and through time. This part is shared by Papers 5 and 6: it belongs to the maria and to the craters alike. The same text stands as Part G of Paper 5, and the study numbering is joint with Paper 5: the main study of this part is Study 5 in this paper and Study 8 in Paper 5.
The previous parts named the maria as the source of the returning material (Part C) and counted the craters that are no longer seen, among them those that melted into the floors of the maria (Part D). This part looks at those floors directly. In the model a mare is an opening over a feed dome (Paper 5), and its floor is the frozen surface of the melt that stood in that opening. A frozen floor is also a surface that receives craters, and the craters it carries tell how soft it was when they arrived. This part reads that record. By size and state we mean two properties of each crater set side by side: its diameter, and how well it has kept its form. A crater is sharp when it is as deep as, or deeper than, a fresh highland crater of the same diameter, with a standing rim and an open bowl; smeared when its rim still stands but its floor is partly filled and its walls are softened, so that it is noticeably shallower than a highland crater of its size; and melted when little more than its ring is left, the floor filled up to nearly the level of the surrounding plain. The question is simple: does the state of a crater depend on its size, and if so, what does that say about when the floors of the maria were still soft?
The part runs in seven steps. Section E.1 shows the three states side by side on one mare. Section E.2 measures the state of every crater of 3 km and more on the near-side basalt against its size (Study 5). Sections E.3 and E.4 give the two causes the model reads in the result: the cooling of the maria, and the change of the material that kept arriving from the Earth after release. Section E.5 joins the two into one sequence in time. Section E.6 turns to the large craters of the plains of the contact, whose rims were worn from below (Study 15), and E.7 states what the part shows.
Throughout, the contact is the last 3,000 km of the Moon’s base on the Earth, the disc where the Moon last touched the Earth, centred today at 24.1°N 335.2°E (Paper 3, §B.4); beyond the contact is the rest of the near-side basalt. A floor of a mare is the basalt over the core of a feed dome (Paper 5, Appendix A); a plain is basalt without a feed dome beneath it, such as Procellarum or Tranquillitatis.
E.1Three states on one floor
Before measuring thousands of craters it helps to see the three states on one surface. The yardstick is the depth-to-diameter ratio, the depth of a crater divided by its width. Fresh craters of a given size have a typical ratio, so a crater much shallower than its highland neighbours of the same size has been filled or worn, and one as deep or deeper has kept its form.
Within Mare Imbrium three craters show three states. Sinus Iridum, 246 km, is melted in half: its northern rim stands as the Jura Mountains, its southern half is gone, and its floor is the floor of the mare; its depth is a quarter of that of a highland crater of its size (depth-to-diameter 0.008 against 0.034). Seen from above it is a bay: an arc of mountains open toward the mare, with the mare’s own smooth surface running in where the southern rim would have been. Plato, 101 km, on the northern shore, kept its rim, but its floor is filled and smooth: it is smeared, at 0.020 against 0.034, a little more than half the depth of a highland crater of its size. Its ring of walls is complete, but inside it lies a flat, dark floor instead of a bowl. Kirch, 11 km, on the floor of the mare, is sharp, deeper than the highland craters of its size (0.166 against 0.078): a clean bowl with a crisp rim. The large crater is melted, the middle one smeared, the small one sharp.
The three stand on or beside the same mare, so differences of place, latitude or of the ground beneath cannot explain them. What differs is the size, and with it, as the following sections show, the time at which each arrived.
E.2The state of the craters by size
Two kinds of melting. A crater that landed on an active mare could be melted in two ways. Melted and vanished: it landed, melted, spread and disappeared while the mare was active, merging with the material of the mare; no body is left beneath the surface, at most remnants, and no ring; it is absent from every catalogue, and is seen only as the deficit of craters on the floors. Melted to a ring: it lost depth, its floor filled, and only its ring is seen; it is in the catalogue as a crater far shallower than a highland crater of its size. In this part melted alone means a crater melted to a ring, still seen; vanished means a crater melted and vanished. The distinction matters because the two are counted in different ways: a melted crater is counted by its state, a vanished one only by its absence, as a shortfall against a surface that kept its craters.
The measurement. Every crater of 3 km and more on the near side whose centre lies on basalt was taken from the catalogue of Wang & Wu [S16], with its depth from the global elevation models, and assigned to the floor of a mare — within the core of the feed dome beneath one of the 34 maria of Paper 5 (Appendix A there) — or to a plain. Its depth-to-diameter ratio was compared with that of the highland craters of the same size, latitude within 60°, basalt removed from the highland sample. Shallower than 95% of the highland craters of its size, a crater is melted: only its ring is seen. Shallower than 75% of them, it is smeared. The rest are sharp. Of the 3,478 craters, 324 lie on the floors of the maria and 3,154 on the plains.
The comparison is made size by size for a reason. Large craters are naturally shallower for their width than small ones, so a single depth threshold would call every large crater filled. Comparing each crater only with highland craters of its own size removes that effect: a crater is called melted only if it is shallower than almost every highland crater of the same diameter. The highland craters are the control because the highland was solid when they formed and has no basalt in it.
The craters that vanished. Like for like, within the contact and beyond it, the floors of the maria carry fewer craters than the plains at every size:
| Where | Surface | 2–5 km | 5–10 km | 10–20 km | 20–40 km | 40+ km |
|---|---|---|---|---|---|---|
| Contact | floors of the maria | 263 | 44 | 4.6 | 0 | 0 |
| Contact | plains | 836 | 129 | 37 | 23 | 14 |
| Beyond the contact | floors of the maria | 983 | 119 | 65 | 34 | 28 |
| Beyond the contact | plains | 2,107 | 293 | 145 | 90 | 68 |
Craters per million
km,
near side, ray fields of young craters removed. Basins of 300 km and
more, which the catalogue lists as craters with their centres on their
own floors (Serenitatis, Nectaris, Humorum and others), are left out of
the 40+ km column; with them the column read 1.5, 14, 40 and 69 in an
earlier version.
The table is read in pairs of rows: each floor row (blue) against the plain row beneath it, in the same zone. The numbers are densities, craters per million km, so surfaces of different area can be compared directly; the bright rays of young craters were removed so that their secondary craters do not inflate any count. The darker blue marks the floors of the contact, where the shortfall is deepest. Within the contact the floors carry about a third of the small craters of the plains beside them (263 against 836 at 2–5 km), and the shortfall grows with size, to none at 20–40 km against 23 on the plains. Beyond the contact the floors carry about half of what the plains carry, at every size. Both surfaces are basalt on the same side of the Moon, exposed to the same arriving material; the floors lost craters that the plains kept. These are the vanished craters.
The state follows the size. On the floors of the maria, the craters that remain:
| Size | Craters | Sharp | Smeared | Melted |
|---|---|---|---|---|
| 3–5 km | 201 | 71% | 12% | 17% |
| 5–10 km | 74 | 57% | 14% | 30% |
| 10–20 km | 26 | 35% | 12% | 54% |
| 20–40 km | 13 | 0% | 15% | 85% |
| 40–80 km | 7 | 14% | 43% | 43% |
| 80 km and more | 3 | 0% | 0% | 100% |
The colours show the direction. Read down the table, from small craters to large: the blue of the sharp column fades, from 71% of the craters of 3–5 km to none of 20–40 km, and the red of the melted column deepens, from 17% to 85% and to all three craters of 80 km and more. The smeared share stays near one in eight until the large sizes. The row of 40–80 km, with only seven craters, breaks the trend slightly; the last two rows rest on ten craters together and are shown for completeness.
Why does a melted share that rises with size tell when the floor was still soft? A crater’s final state is set by the floor it lands on, not by its size alone: the size effect has already been removed by comparing each crater with highland craters of its own size. If all sizes had arrived on the floors at the same time, they would have met the same floor and would show the same mix of states. They do not: the large are mostly melted, the small mostly sharp. The large therefore met a softer floor than the small, which means they arrived earlier, while the mare was still liquid or mushy, and the small arrived later, when it had frozen. The size of a crater on a mare floor thus acts as a clock of the floor’s state; Sections E.3–E.5 explain why the two run together.
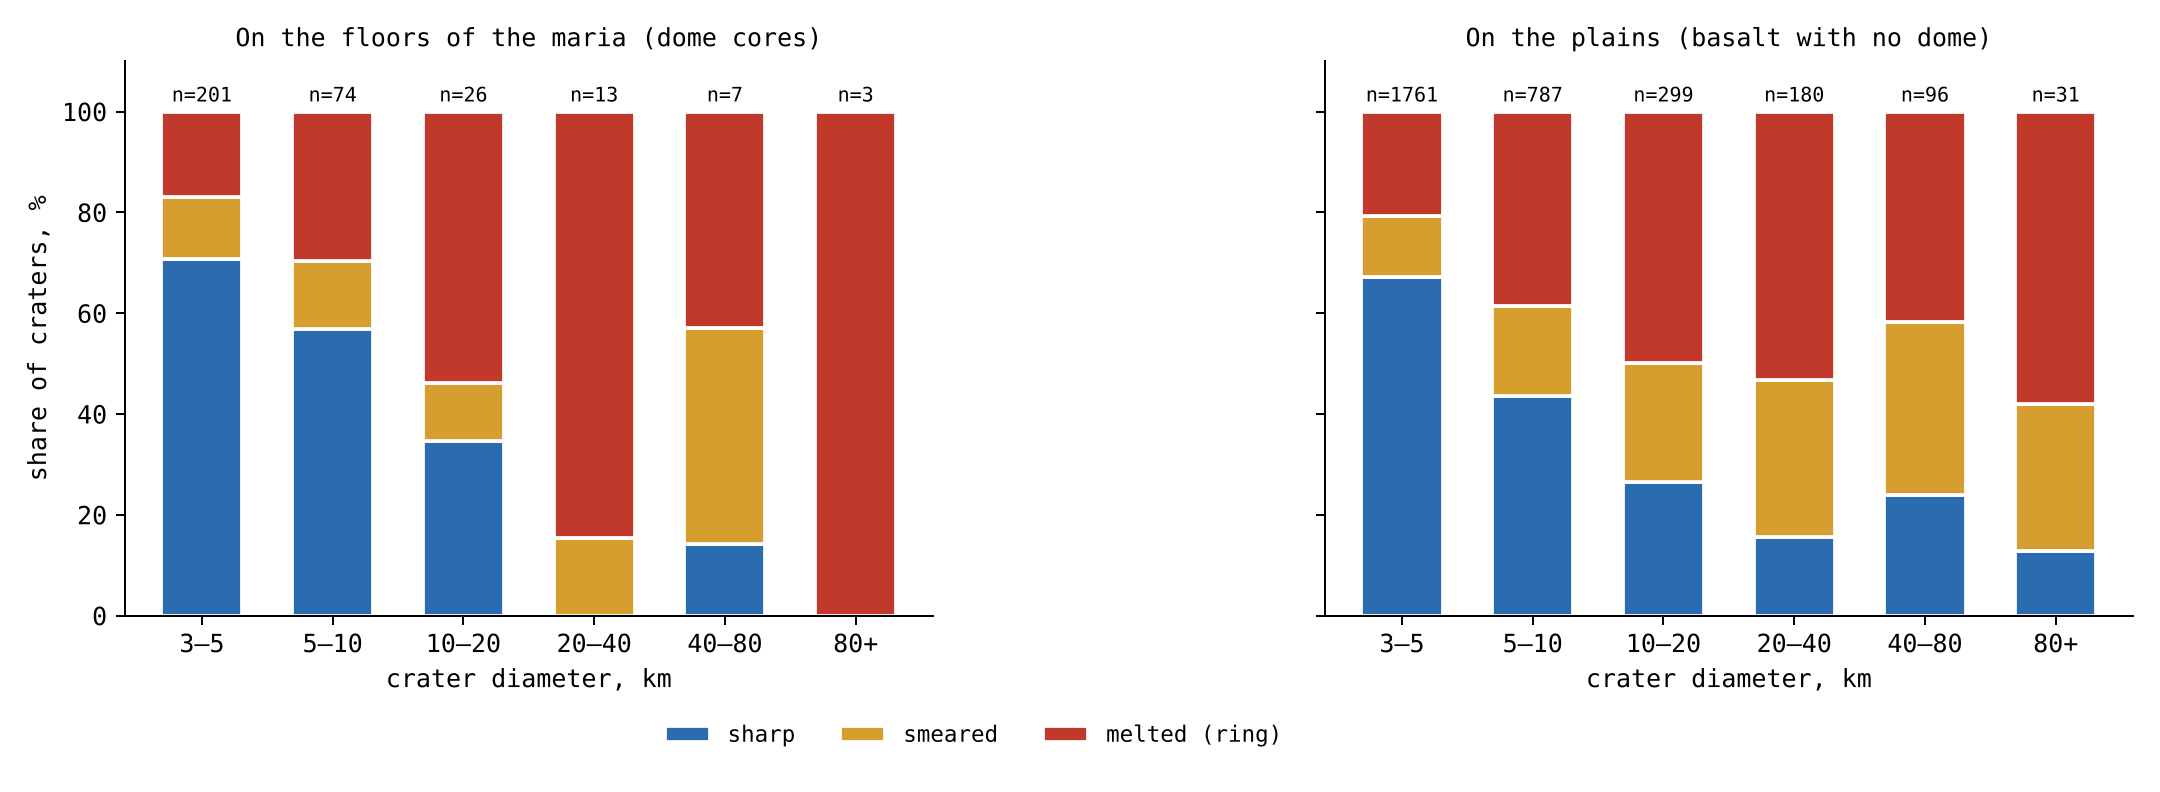
Figure 4 shows the same classification for each size bin, on the floors of the maria and on the plains, with the three states in the colours of the table. On the floors the red of the melted craters grows toward the large sizes, while the blue of the sharp craters shrinks. The plains are shown beside the floors so that the two surfaces can be compared at a glance; the difference between them in the number of craters is the subject of the density table above.
The small craters on the contact. On the floors of the maria of the contact, 82% of the craters of 3–10 km are sharp and 9% melted; on the maria beyond the contact, 56% and 28%. On the floors of the maria of the contact there is no crater of 40 km and more, and only three of 10–40 km, all sharp.
The maria of the contact were the last to freeze (§E.3): they lay where the Moon last touched the Earth, were fed the longest and are the deepest — deepest in the body of the mare itself, inward, not in the height of its floor (§E.3). Any large crater that landed on them while they were liquid melted and vanished, and so did most small ones of that time. What is left on their floors is what arrived after they froze: small pieces, which made sharp craters on solid ground. The contact maria therefore carry fewer craters than the others, and a larger share of those they carry is sharp. Their sharp small craters are not a sign that they are old and untouched; they are the late arrivals from the Earth, landing on a floor that had only just become hard.
The phenomenon. On the floors of the maria some craters are melted to a ring, some are smeared, and some are sharp (§E.1); and the floors carry few craters. The gap in knowledge. Whether the state of a crater on a mare floor follows its size, and whether craters vanished into the floors of the maria while the plains kept theirs, has not been measured on all the craters against a control of the same size. The research question: do the floors of the maria carry fewer craters than the plains, like for like; does the share of melted, smeared and sharp craters on the floors change with size; and how do the craters on the floors of the contact differ from those beyond?
Craters on the maria that the literature describes as partly buried by later basalt have long been used to measure the thickness of the basalt: a crater whose rim still stands above the flow tells how deep the flow is [S25]. The flows are dated by crater counts on top of them [S20]. The viscosity of the mare basalts was measured on returned samples [S19]. In that reading, the state of a crater follows the thickness of the later flows, and the maria and the plains are one kind of surface. What is new here: the floors over the feed domes are set apart from the plains, and all the craters of 3 km and more are classified by one rule against highland craters of their own size.
The large pieces arrived in the time when the maria were active; on an active mare they melted, many of them spreading and merging with the material of the mare until they vanished, others left as rings. The small pieces arrived at the end of the storm of the melt, when most maria had frozen, and stayed sharp. Hence: the floors of the maria carry fewer craters than the plains at every size, within the contact and beyond it; on the floors the share of melted craters rises with size and the share of sharp craters falls; and on the maria of the contact, the last to freeze, the large craters are gone and the few craters that remain are sharp, late arrivals from the Earth.
Type of research: quantitative; densities and states compared across surfaces, sizes and zones. The sample: the 3,478 craters of 3 km and more on the near-side basalt, 324 on the floors of the maria and 3,154 on the plains; for the densities, all the craters of 2 km and more on the same surfaces, ray fields removed; the control: highland craters of the same sizes, latitude within 60°, basalt removed. The tools: the Wang & Wu catalogue [S16] with its depths, the LROC mare map, the feed domes of Paper 5, Appendix A, and code that classifies each crater by the rule of §E.2.
The rule was set on the highland craters alone, size bin by size bin, before any crater on the basalt was classified, so that the lines between the classes could not be tuned to the result. Each crater was then classified, assigned to a mare floor or a plain, and its distance from the centre of the contact (24.1°N, 335.2°E) recorded. The counts are the tables of §E.2.
Vanished. Within the contact the floors of the maria carry a third of the craters of 2–5 km of the plains, an eighth of those of 10–20 km, and none of 20–40 km against 23 per million km; beyond the contact, about half at every size. The change with size. A test for a steady trend across ordered groups (the Cochran–Armitage test, which asks whether a share rises or falls steadily from one size bin to the next rather than wandering at random) gives, on the floors of the maria, a rise of the melted share and a fall of the sharp share with size, each with a probability below one in ten billion of arising by chance; crater by crater, the larger the crater, the shallower it is against the highlands (rank correlation ; a rank correlation measures whether one quantity tends to fall as the other rises, from for a perfect fall to for a perfect rise). The contact. Of the craters of 3–10 km, 93 of 113 on the floors of the contact are sharp against 91 of 162 beyond (Fisher’s exact test, which gives the exact probability of so uneven a split between two groups if both had the same true share: about 5 in a million); no crater of 40 km and more lies on the floors of the contact, and the three of 10–40 km are sharp.
Result. The hypothesis is supported: on the floors of the maria craters melted and vanished, merging with the material of the active mare, while the plains kept theirs; the state of the craters that remain follows the size, melted for the large and sharp for the small; and on the maria of the contact, the last to freeze, the large craters are gone and the craters that remain are sharp. Limitations. The depth of a small crater is less well measured than that of a large one; the classes rest on a rule that sets the lines at 95 and 75 of every 100 highland craters; the large craters on the floors are few; and the state alone does not tell whether a crater was melted or covered by a later flow. Directions for further research. Remnants of the vanished craters in the gravity field beneath the floors of the maria of the contact; the large craters of the plains of the contact (Study 15).
E.3 The maria: temperature, viscosity and time
Study 5 established the pattern. This section and the next give its causes: here, the floor that receives the crater; in §E.4, the material that makes it. The key property of the floor is its viscosity, its resistance to flow: water has a low viscosity, honey a higher one, cold tar a very high one. A floor of low viscosity closes over a crater; a floor of very high viscosity keeps it.
The viscosity. A mare basalt melt is fluid: the lavas returned by Apollo have a viscosity of the order of 1 Pa s near their liquidus [S19], about 1,200 °C. The liquidus is the temperature above which the melt is wholly liquid; 1 Pa s is about a thousand times the viscosity of water, close to that of glycerine. As the melt cools below the liquidus, crystals grow in it; as they approach half of its volume the melt stops flowing, and its viscosity rises by many orders of magnitude before it freezes at the solidus, about 1,050 °C. The solidus is the temperature below which no liquid is left. A mare passes through three states as it cools — liquid, mush, solid — and the material that lands on it meets each in turn. The mush is the middle state, a crowd of crystals with melt between them, like wet sand or setting plaster: it holds a shape for a time but slowly yields.
What a landing does in each state. On a liquid mare the returning material sinks and mixes, the crater closes behind it, and at most a part of the rim that stood on firm ground remains: the crater is melted. On a mush the crater holds its shape for a while; its walls slump, its floor fills, its rim survives: the crater is smeared. On a frozen floor the crater keeps its full form: it is sharp. The picture is that of a spoon pressed into a pot of cooling porridge: in the hot pot the hollow closes at once, in the thickening pot it slowly fills and its edges sag, and in the cold, set pot it stays. Sinus Iridum is the first case — its southern rim, standing on the liquid mare, is gone, its northern rim, on the firm shore, remains as the Jura Mountains; Plato is the second; Kirch the third.
Time. A mare freezes from above. The frozen lid thickens as the square root of time, where m s is the thermal diffusivity, a constant of order one set by the latent heat, and the depth of the melt. In words: heat leaves the melt through the lid already frozen above it, and the thicker the lid, the slower the heat escapes, so each further metre of lid takes longer than the last; the thickness grows as the square root of the time . The thermal diffusivity measures how fast heat spreads through the material; the latent heat is the heat a melt must give up to freeze, beyond what it gives up in cooling. The second relation follows: the time to freeze the whole depth grows as the square of the depth. A mare ten times deeper stays liquid a hundred times longer. The maria of the contact were fed the longest and are the deepest. Deepest here is the depth of the body of the mare itself, measured inward, not the height of its floor: the centres of their floors stand slightly raised, Serenitatis by m and Imbrium by m (Paper 5, §G.3). The material at that depth was hot, so they stayed liquid the longest; and they lay closest to the Moon’s own heat source, a second reason they were the last to freeze. The large craters that landed on them while they were liquid melted and vanished into the mare: not one of 20 km and more remains on their floors. The maria of the limbs, cut off earlier and shallower, froze first, and some of the large craters on them survive as rings.
E.4 The arriving material: temperature, size and distance
The second clock is in the material that lands. In the model about 99% of the craters are made by returning material from the Earth (Part B), and the Earth’s output did not stay the same after release.
The Earth went on throwing. At release the Earth did not stop. Its openings went on throwing material; most of it fell back to the Earth, and part reached the Moon and landed on it. To reach the Moon at a distance from the Earth’s centre, the material must leave the Earth’s surface at 8.8 km s for a Moon at 17,000 km, 9.9 at 30,000 km and 10.6 at 60,000 km ( km). Here is the gravitational constant, the Earth’s mass and its radius. The equation is the balance of energy: a piece leaving the surface must carry enough energy of motion to climb out of the Earth’s gravity from the surface to the Moon’s distance. As the Moon receded, the speed needed rose toward the Earth’s escape speed, the speed at which a piece leaves the Earth altogether. At 17,000 km, close to the distance of release, a piece that the Earth could throw at 8.8 km s reached the Moon; once the Moon stood at 60,000 km, the same piece fell back, and only those thrown at 10.6 km s or more arrived.
The large first, the small later. As the Moon receded, a piece needed a higher speed to reach it (equation 4). The Earth’s gravity brought the large pieces back, while the small ones, which the Moon draws easily, still arrived. The large pieces came out first; as the storm of magma on the Earth calmed, smaller pieces, still hot, were thrown. While the Moon was close, large pieces reached it; as it receded, only smaller ones did. The size of the largest crater made on the maria falls with time.
All hot; the floors cooled. The material left a hot Earth with a low viscosity, in the state of the returning material that built the craters of the shell (Part J), and it stayed hot to the end: the large pieces first, then, as the storm of magma calmed, smaller pieces, still hot. What changed was the floor that received them. A small piece landing on a floor that had already frozen makes the sharpest crater: Kirch. Its ratio of 0.166, more than twice that of a highland crater of its size, is what a small piece on a frozen floor leaves.
E.5 The chain in time
Two clocks run together: the maria cool, and the material arriving from the Earth, hot throughout, grows smaller. Because both run the same way, a large crater is almost always an early crater, and an early crater almost always met a soft floor. This is why size and state are tied on the floors of the maria.
| Stage | The Earth | The maria | The crater | Example |
|---|---|---|---|---|
| Early | close; large, hot pieces reach the Moon | liquid, low viscosity | melted | Sinus Iridum |
| Middle | receding; middle-sized pieces | mush, viscosity rising | smeared | Plato |
| Late | far; only small pieces, still hot | frozen | sharp | Kirch |
The table is read from top to bottom as time runs, and the row colours follow the temperature of the maria: red for the early stage, when the floors were liquid, amber for the middle, blue for the late stage, when they had frozen. Each row joins the state of the Earth, the state of the maria, and the crater the two together leave, with the example of §E.1.
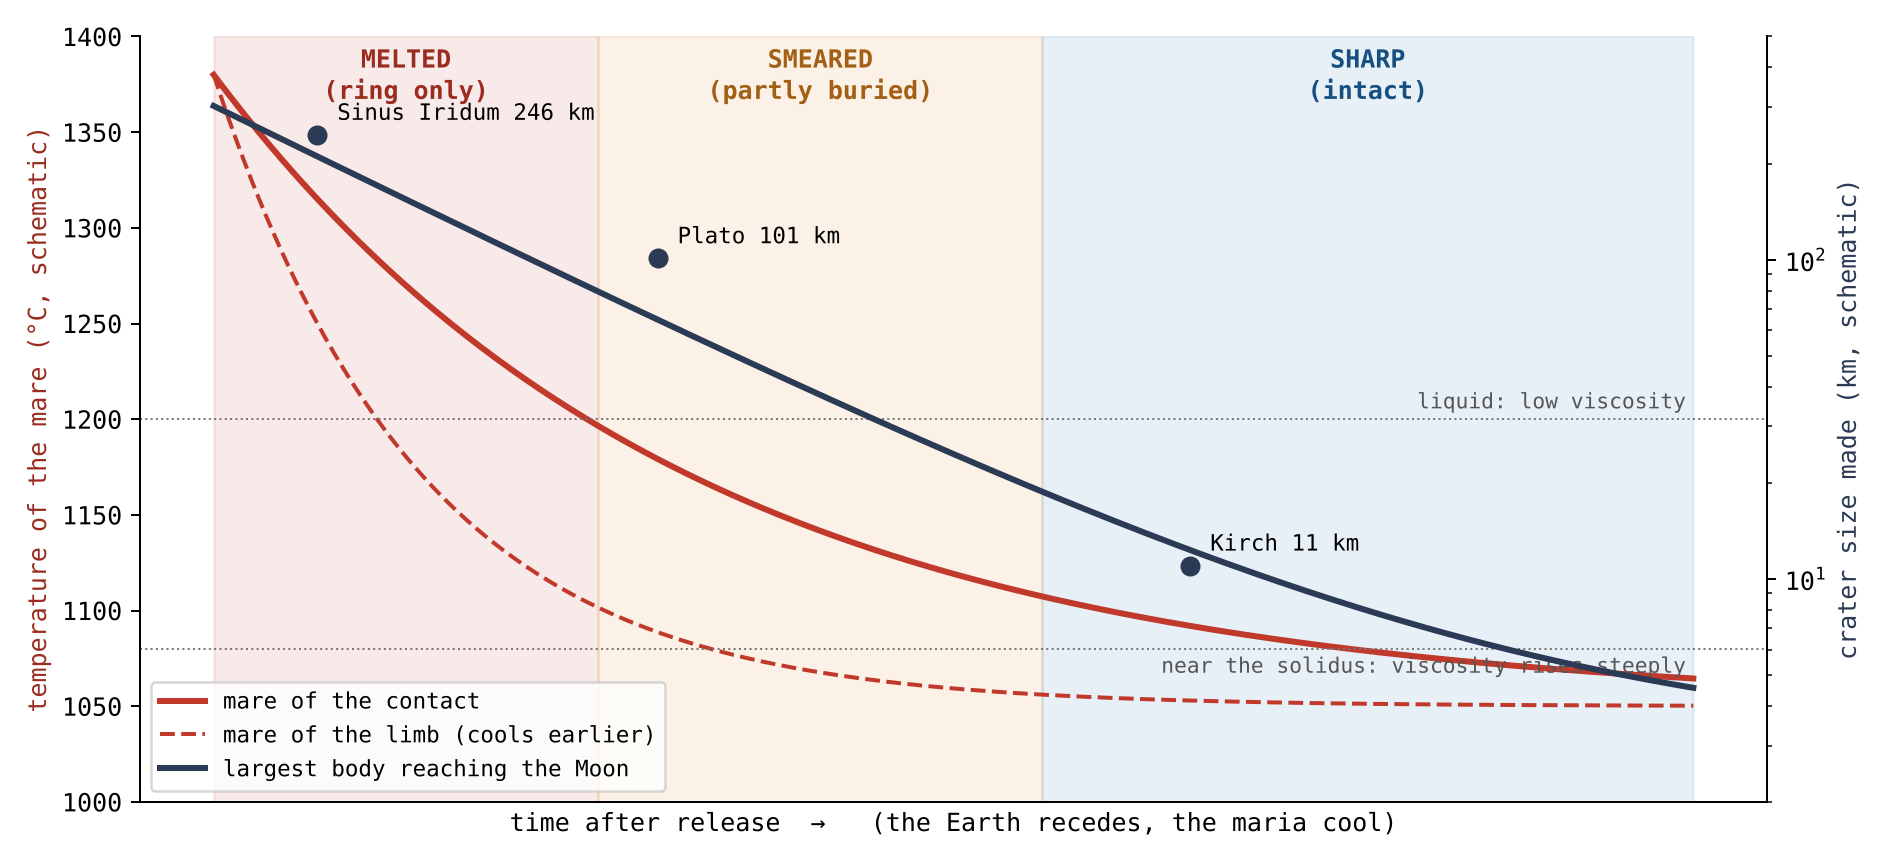
Figure 5 draws the same chain as curves. Time runs to the right. The red curves fall as the maria cool, the dashed curve of the limb earlier than the solid curve of the contact; the navy curve falls as the largest piece that can reach the Moon grows smaller. The shaded background shows which state a landing leaves at each moment. A crater’s place in the figure is fixed by when it arrived and on which mare: a large crater can only lie at the left, where the background is melted, and a crater on the contact stays in the melted band longer than one on the limb.
The order is read without years. On the maria of the limb the same chain ran earlier, because they froze first: a large crater that would have been melted on the contact could stay sharp on the limb.
E.6The rim: worn by heat or flooded
The floors of the maria of the contact carry no large crater. The large craters of the contact are not missing, however: they lie on its plains, and their rims carry a second kind of wear. This section asks what wore them.
The large craters of the contact are on its plains. Of the 41 craters of 40 km and more on the basalt within the contact, not one lies on the floor of a mare: 37 lie on the plains, 22 of them on Procellarum, and 4 on the basalt of Imbrium and Serenitatis outside the cores of their domes. None is sharp, 33 are melted and 8 smeared. Beyond the contact, on the plains, 27 of 85 are sharp and 25 melted (an earlier version gave 27 of 86, counting with them a crater of 64 km on the basalt of Serenitatis that lies 1,507 km from the contact centre, just outside the disc). Most are of middle size: half are of 40–60 km, and four exceed 120 km.
The literature. The craters on the maria were made by bodies from outside; the basalt that came after them flooded the land around them. Flooding raises the ground outside a crater, so the rim that remains exposed stands lower above it, though the crest itself is not lowered [S25, S32]; a crater deeper than the flow keeps its rim as a ring above it. In that reading a low rim on a mare plain measures the thickness of the basalt laid around it. The picture is of a sandcastle with water rising around it: the water hides the lower slopes and the castle looks lower, but its top is untouched.
The model. The plains of the contact lay over the Earth: the heat that reached them came from below, from the Earth beneath them. A crater that landed on them after the middle of the storm, a piece of middle size thrown from the Earth, met a hot plain; the plain wore the rim away where it touched it, on the side that faces it. The crest itself was lowered and blunted. In the picture above, this is not water rising around the castle but warm ground beneath it softening one side, so that the top itself slumps. On Imbrium the heat came from below the crater, from the Moon, through the opening: the crater was melted from its floor upward, and its rim, standing on firmer ground, was kept.
The separating test. The two readings predict different things, and the test is built on the difference. Flooding raises the ground on the side of a crater that faces the basalt, on every plain alike. Heat from below wears the rim on the side that faces the hot plain, where the plain was hot: on the plains of the contact, not on the plains beyond it. For every crater of 40 km and more on the near-side basalt the rim crest was traced on 36 radial profiles of the elevation model of 64 pixels per degree, against a plane fitted to the ground at 1.6–2.4 radii; each direction was classed as facing a plain or facing the highland by the ground beyond the rim. A radial profile is a line of heights drawn outward from the crater’s centre, one every 10° around it; in each the crest is found as a peak, and its height measured above the surrounding ground.
| Craters of 40 km and more | Craters | Crest above the ground (m) | Rim missing, plain side minus highland side |
|---|---|---|---|
| Plains of the contact | 29–33 | 393–590 | (10 to 35) |
| Plains beyond the contact | 34–39 | 627–960 | 0% ( to 0) |
| Basalt of Imbrium and Serenitatis | 4 | 148–1,721 | ( to ) |
| Highland, near side | 590 | 616–1,006 | — |
Crest: medians by size bin, 40–60, 60–100 and 100 km and more.
Missing: the share of directions on which no crest of 50 m prominence is
found, plain-facing minus highland-facing, crater by crater; 95%
intervals by resampling.
The red row is the plains of the contact, the one group the model sets apart; the rows beneath it are the comparisons. The third column gives the height of the crest above the ground, as a range over the three size bins; the fourth asks, for each crater, on how many more of the plain-facing directions than of the highland-facing ones the rim cannot be found at all. A crest of 50 m prominence is a peak standing at least 50 m above the dips on either side of it. The figures in brackets are 95% intervals obtained by resampling: the craters are drawn again at random many times, and the range covering 95 of every 100 redrawn results shows how firm the value is. Only the red row stands apart in both columns: lower crests, and rims missing on the plain side.
On the plains of the contact the crest stands 345–375 m lower than on the plains beyond and in the highland, and the rim is missing on a quarter more of the directions that face the plain than of those that face the highland. On the plains beyond the contact, where the same basalt lies around the craters, the rim is missing no more toward the plain than toward the highland. On both kinds of plain the crest that remains stands lower on the side of the plain, by about 220–270 m, as flooding predicts on every plain. Both effects are therefore present: flooding, seen on every plain, and a loss of rim on the plain side seen only on the contact.
The shape of the crest. A flood rises along the outer flank and does not reach the crest, so a flooded crest keeps its shape; a crest worn by heat is blunt. Where a crest survives, its shape was read on the elevation model of 512 pixels per degree (SLDEM2015, 60 m) [S7], profile by profile: the sharpness (the curvature at the top), the width of the crest 50 m below its top, and the angle between the inner and outer slopes. A knife edge has high curvature, a narrow width below its top and a small angle; a rounded loaf has low curvature, a wide top and a wide angle.
| Plain side minus highland side, crater by crater | Sharpness (m/km) | Crest width, 50 m below (km) | Angle at the crest |
|---|---|---|---|
| Plains of the contact (29) | ( to ) | (0.03 to 0.31) | (2.0 to 7.0) |
| Plains beyond the contact (34) | ( to ) | no difference | (0.3 to 2.8) |
| Highland, near side (77) | ( to ) | no difference | (0.2 to 3.3) |
95% intervals by resampling cells of 5° by 5°. The highland side
of each crater is its own control.
Each value is a difference within one crater: the crest on its plain side minus the crest on its highland side. A negative sharpness and a positive width and angle mean a blunter crest on the plain side. Because each crater is compared with itself, differences of size, age and latitude between craters cancel. Here the resampling draws whole cells of 5° by 5° rather than single craters, so that neighbouring craters, which are not independent, are drawn together. The red row of the contact is the only one in which all three measures point the same way with intervals that exclude zero.
On the plains of the contact the crest that survives on the side of the plain is blunter than on the side of the highland: less sharp, wider, and with a wider angle. On the plains beyond the contact and in the highland the two sides differ by little, and the difference in angle disappears when only the finest elevation model is used. Against the plains beyond, the angle of the contact is wider by (0.4 to 6.3). A flood cannot blunt a crest it does not reach; a hot plain beneath the rim can.
The phenomenon. The large craters on the basalt of the contact are melted, none sharp, and not one lies on the floor of a mare (Study 5). The gap in knowledge. A low rim on a plain of basalt is read as the rim exposed above a flood; whether the rims of the plains of the contact were lost in another way has not been tested. The research question: are the rims of the large craters on the plains of the contact lower and more broken than elsewhere, and are they lost on the side that faces the plain only where the plain was hot?
Craters on the maria that the literature describes as partly buried by later basalt are used to measure the thickness of the basalt: the flood raises the ground outside the crater and the exposed rim stands lower above it [S25, S32]. Du et al. found 262 fully exposed, 360 partly exposed and 39 wholly concealed rims, and basalt thicknesses of 33–455 m around 41 of them [S25]. What is new here: the rim crest is traced in 36 directions, each classed by the ground it faces, and the plains of the contact are compared with the plains beyond it, where the same flooding would act.
The plains of the contact were heated from below by the Earth beneath them; the hot plain wore away the rims of the craters that landed on it, where it touched them. Hence: on the plains of the contact the crests are lower than on the plains beyond and in the highland, and the rim is lost more on the side that faces the plain; on the plains beyond the contact, which were not heated from below, no such loss on the side of the plain.
Type of research: quantitative; crests and floors by group, and the plain-facing against the highland-facing directions crater by crater. The sample: the 137 craters of 40 km and more on the near-side basalt (37 on the plains of the contact, 85 on the plains beyond, 5 on the basalt of Imbrium and Serenitatis outside the cores of their domes, one of them, on Serenitatis, just outside the contact disc, and 4 of them with a measurable crest; 10 on the floors of the maria) and 592 highland craters of the same sizes, near side, latitude within 60°. The tools: the Wang & Wu catalogue [S16], the LOLA elevation model at 64 pixels per degree, the LROC mare map, and code that traces the crest on 36 radial profiles.
The three rules of the tracing, and why each was chosen:
| Rule | Why, in plain words |
|---|---|
| The ground: a plane fitted to 1.6–2.4 radii | The present level around the crater, the same rule for every group |
| The crest: the highest peak of 50 m prominence at 0.8–1.2 radii, profile by profile | A rim seen as a ridge, not as an average over a ring |
| A direction faces a plain when half of the ground at 1.2–1.6 radii is basalt | To tell the side that touched the plain from the side that touched the highland |
For each crater the ground plane was fitted, the crest was traced on each of the 36 profiles, and each profile was classed as facing a plain or the highland. Craters without enough ground for a plane were kept in the output; alternative ground planes, of the highland only and of all the ground, were read as checks. The values are the table of §E.6.
The crest. On the plains of the contact the crests stand 375 m lower than on the plains beyond (95% interval 44–615 m) and 345 m lower than in the highland (167–450 m); with either alternative ground plane the difference remains, 219–422 m. The side that faces the plain. On the plains of the contact the rim is missing on 24% more of the plain-facing directions than of the highland-facing ones (10–35%), and the same holds among the craters smaller than 100 km alone; on the plains beyond the contact the difference is 0 ( to 0). On both, the crest that remains is lower on the side of the plain, by 265 and 217 m. The floor. The floors lie near the level of the ground on the plains of the contact and on the plains beyond alike; they do not separate the two. The shape of the crest. On the plains of the contact the surviving crest is blunter on the side of the plain: sharpness lower by 35 m/km (18–46), width 50 m below the top larger by 0.14 km (0.03–0.31), angle wider by (2.0–7.0); beyond the contact the sharpness and width do not differ, and the angle differs by , which vanishes on the finest model alone. Matched crater against crater, at the same diameter, latitude and interior depth, only four pairs of the contact and beyond could be formed, too few to compare the two groups directly. Imbrium. The four craters on the basalt of Imbrium and Serenitatis lose their rim no more toward the plain than toward the highland (); the crest of Sinus Iridum stands 1,721 m above the ground.
Result. The hypothesis is supported: on the plains of the contact the rims are lower and are lost on the side that faces the plain, and on the plains beyond the contact, flooded alike, they are not; the lowering of the remaining crest on the side of the plain, common to both, is the work of flooding, while the loss of the rim, and the blunting of the crest that survives on the side of the plain, are the work of the hot plain of the contact. Limitations. The ground plane is the present level, not the ground the crater landed on; a crest not found by the tracing is not proof that no rim is there; the craters on Imbrium are few; the heat from the Earth beneath the contact is inferred, not measured. Only the crests that survive can be measured for their shape, and the matched comparison between the contact and beyond rests on four pairs. Directions for further research. A larger matched sample of craters of the contact and beyond, of equal interior depth, on the finest elevation model.
E.7What this shows
The craters on the maria record the Earth after release. Material kept arriving from it — large at first, smaller with time, hot throughout — while the maria cooled beneath it. The large craters that landed on liquid floors vanished or were melted to rings; the middle ones that met a mush were smeared; the small ones that came last, onto frozen floors, stayed sharp; and on the plains of the contact, heated from the Earth beneath, the rims of the large craters were worn on the side of the hot plain. The activity of the Earth waned with time, but it went on after release, and the size and state of the craters on the maria are its record.
The rim
the rim of a crater records the forces at the moment of landing. The approach: the rims of 1,457 craters were measured along 72 azimuths at four longitudes, in craters of the same size, maria and South Pole–Aitken removed.
Parts C–E counted the craters and read their state on the maria. Parts F–I now read the shape of a single crater, part by part, and compare it between four regions of the Moon. The principle that guides the reading is the one fixed in §C.1: a crater is the place where returning material landed, and each part of it keeps a record of its own. The floor records the ground the material landed on — the layers beneath it, and what later filled it (Parts G and H). The centre, where the central peak stands, records the energy of the landing (Part I). The rim records the forces that acted on the thrown-up material at the moment of landing (this Part). Read together, the three tell how hard the material came down and on what kind of ground.
The four regions. The craters were taken in four caps of 30° radius, centred on 90°W, 180°, 90°E and 0°. By the standard convention (§A.1) the half of the Moon centred on 90°W is the leading half, the one that faces forward in the Moon’s motion, and the half centred on 90°E is the trailing half; 180° is the centre of the far side and 0° the centre of the near side, the side that faces the Earth. In the model the craters were made while the body still turned with the Earth, and the material that the body itself threw out came down toward its trailing half, which is the more crowded (§C.3); the leading half met that material head-on, as a person walking into slanting rain is struck hardest on the side that faces it. If this is right, the leading half was landed on hardest, and that must show in the shape of its craters.
How the rim is compared. A rim is traced as the highest point along each of 72 directions from the centre (one every 5°), between 0.85 and 1.15 of the radius (§A.2). Two craters can be compared only if they are of the same size, since a large crater has a different shape from a small one; the craters are therefore compared within three size bins, 20–30, 30–50 and 50–100 km, and every height is divided by the diameter , so that a value of means 9.2 thousandths of the diameter — 230 m on a crater of 25 km. The rims are not equally well kept: the leading half, facing the direction of motion, is the most worn (§A.2). So that a worn, softened rim does not pass for a weak landing, the irregularity of the rim is read only in the deeper half of each size bin, the better-kept craters.
F.1The rim at four longitudes
The table gives, for each of the four regions, three signs of a hard landing on the rim. The last column, Reads, sets the leading half against the trailing half: “W/E 1.25” means that the leading half’s value is 1.25 times the trailing half’s, and the range in brackets is its 95% interval, found by drawing the craters again at random many times and recomputing the ratio (Study 6, step 6; §N.2). A ratio whose interval does not include 1 is not explained by chance. The green cells mark the region where each sign is strongest, the orange cells the trailing half it is compared with.
| Measure | 90°W leading | 180° far | 90°E trailing | 0° near | Reads |
|---|---|---|---|---|---|
| Signs of a hard landing on the rim | |||||
| Rim irregularity, harmonics removed, deeper half, 20–30 km () | 9.2 | 7.5 | 7.4 | 7.1 | W/E 1.25 (1.00–1.48) |
| Rim jump between azimuths, deeper half, 20–30 km () | 3.9 | 3.5 | 3.5 | 3.4 | W/E 1.14 (1.03–1.39) |
| Strongly elongated rims, , km | 17% | — | 12% | — | W higher |
| (1) The rim above the land (), all craters | |||||
| 20–30 km | 12.7 | 15.8 | 17.2 | 15.2 | WE ( to ) |
| 30–50 km | 14.4 | 18.7 | 13.1 | 13.6 | 180°E ( to ) |
| 50–100 km | 12.5 | 17.4 | 14.3 | 10.3 | 180°E ( to ) |
The three rows measure three different things. The rim irregularity is how much the height of the rim varies around the circle, after the smooth, large-scale undulations of the rim (its low harmonics, the slow rise and fall that any rim on uneven ground has) are removed; what remains is the small-scale breakage. The rim jump is how much the height changes from one direction to the next, 5° apart: a broken, toothed rim jumps more. The elongation is the ratio of the longest to the shortest width of the rim; a rim with is more than a fifth longer one way than the other. The lower block gives the rim above the land, height (1) of §A.2, by size bin, over all the craters: grey marks the highest rim in each row and blue the lowest, and the Reads column gives the difference between two regions in thousandths of the diameter, with its 95% interval.
The signs of a hard landing on the rim point to 90°W. In the small craters its rims are the more irregular, around the circle and from one azimuth to the next, and its rims are the more often elongated. A toothed rim is a rim broken by the landing; an elongated rim is the trace of material that arrived at a slant, as material met head-on by a moving ground does. The rim differences are confined to the craters of 20–30 km, where the late, hard landings would weigh most; above 30 km the regions do not differ. All three signs point the same way: the leading half’s rims are irregular by a quarter more than the trailing half’s (9.2 against 7.4), they jump more between neighbouring directions (3.9 against 3.5, an interval wholly above 1), and 17% of its rims are strongly elongated against 12%. The far and near sides, where the ground neither ran into the falling material nor away from it, lie close to the trailing half.
The rim stands highest on the far side and lowest on the leading half. The height of the rim crest above the land around the crater is measured outside the floor, and the central peak does not enter it; it is compared over all the craters. Above 30 km the far side’s rims stand a fifth to two fifths higher than the trailing half’s. In the craters of 20–30 km the leading half’s rims are the lowest, a quarter below the trailing half’s; the trailing half’s stand the highest of the four. The near side’s largest craters have the lowest rims of all (10 thousandths of the diameter).
Between the two halves it is the rim that differs. Of the three heights, the rim above the land (1) is the one that separates the leading half from the trailing half: in the craters of 20–30 km the leading half’s rims stand 4.5 thousandths of the diameter lower, and the interval excludes zero. The floor below the land (2) and the rim to the floor (3) do not separate them: their differences between the halves, at every size, lie within their intervals (§G.1). This matters for the reading. A difference in landing strength between the two halves changed what was thrown up around the crater, not how deep the crater reached; the depth, as Part G shows, is set by the ground beneath, and the two halves stand on ground of the same kind.
How the model reads the rims. The craters were made while the body still turned with the Earth, and the same rotation that sorted the landings acted on the material thrown up by each landing. On the far side, facing away from the Earth, the centrifugal force of the shared rotation lifted the thrown-up material outward, and the rims stand high. On the leading half the material came down with gravity and with the forward motion of the ground meeting it, and the rim was pressed low. On the trailing half the landing was ordinary, and the ground moving away from the falling material drew the floor a little with it, so that the rim stands a little higher than on the leading half. The near side, facing the Earth, was pressed by the same centrifugal force against its own ground, and its rims were compressed.
The picture is that of a body turning about a common centre with the Earth, the near side innermost and the far side outermost. On the outer, far side the outward push of the rotation acted against the body’s own gravity and let the thrown-up material rise and stay high, as water flung from the outer rim of a spinning wheel; on the inner, near side the same push pointed into the ground and pressed the thrown-up material down. The four rims thus give four forces at the moment of landing: an outward pull on the far side, a head-on meeting on the leading half, an ordinary landing on the trailing half, and a pressing on the near side (§P.1). What we now have: the rim records the forces at landing; it marks the leading half as the one landed on hardest and the far side as the one where the thrown-up material was lifted.
The research. The rim, the floor, the roughness and the peak are one research, Study 6, set out step by step in §I.1.
The bottom of the crater below the ground
how far a crater reaches below the land around it records the ground it landed on. The approach: the floor below the land and the rim to the floor were measured with the central peak masked out.
Part F read the top of the crater, its rim. This Part reads its bottom. The question it answers is the second part of the principle of §C.1: what lies beneath a crater is the layers it landed on. If the ground differed from one side of the Moon to the other, the floors must lie at different depths below the land around them, whatever the strength of the landing. The Part has three steps: the floor at the four longitudes (§G.1); the floors of the large craters on the basalt of the near side, some of which stand higher than the basalt around them (§G.2); and the iron in those high floors and in the low ones (§G.3).
G.1The floor below the land
The table gives two of the three heights of §A.2 at each of the four longitudes and in each of the three size bins. Height (2) is how far the floor lies below the land around the crater; height (3) is how far it lies below its own rim, and is the sum of the rim above the land (1) and the floor below the land (2). The Reads column gives the difference between two regions in thousandths of the diameter, with its 95% interval: “180°E ( to )” means that the far side’s floors lie 16 thousandths deeper than the trailing half’s, and that the difference lies between 11 and 22 thousandths; “N” is the near side and “W” the leading half. Grey marks the deepest region in each row, blue the shallowest where it stands out.
| Measure | 90°W leading | 180° far | 90°E trailing | 0° near | Reads |
|---|---|---|---|---|---|
| (2) The floor below the land (), central peak masked out | |||||
| 20–30 km | 41 | 54 | 38 | 27 | 180°E ( to ); NE ( to ) |
| 30–50 km | 24 | 47 | 29 | 25 | 180°E ( to ); WE ( to ) |
| 50–100 km | 22 | 36 | 27 | 17 | 180°E ( to ); WE ( to ) |
| (3) The rim to the floor, = (1) + (2) (), central peak masked out | |||||
| 20–30 km | 50 | 69 | 51 | 38 | 180°E ( to ); WE ( to ) |
| 30–50 km | 37 | 64 | 42 | 38 | 180°E ( to ); WE ( to ) |
| 50–100 km | 36 | 53 | 42 | 26 | 180°E ( to ); NE ( to ) |
Read the grey column first: in all six rows the far side is the deepest, and every far-side interval lies wholly above zero. Then the blue cells: the near side is the shallowest, its floors in the smallest craters 27 thousandths below the land against the far side’s 54. The leading and trailing halves stand close to each other, and the intervals of their differences ( to , to , to , to ) all include zero.
The floor lies lowest on the far side and highest on the near side. At every size the far side’s floors lie the deepest below the land around them, by 9 to 18 thousandths of the diameter more than the trailing half’s; the near side’s lie the highest, at about half the far side’s depth; and the floors of the leading and trailing halves are alike within their intervals. The rim to the floor (3) follows both parts: the far side’s craters are the deepest, their floor low and, above 30 km, their rim high, by 11 to 22 thousandths more than the trailing half’s; the near side’s the shallowest, the floor high and the rim low. The near side’s floors lie the highest for two reasons. There the returning material did not land on layers that could be crushed beneath it; and every layer or floor added afterwards, the maria’s among them, raised the floor against the land around it, as the flatness of those floors shows. The far side is built of layers, the parent’s sial and returning material laid down layer upon layer (Paper 3, §B.7). Hot material landing on them from above crushed the layers beneath the crater and melted them, and the floor sank into them; so the far side’s floors lie the lowest. Between the leading and the trailing halves the landing changed the rim of the crater, not the level of its floor.
The picture is the difference between pressing a hot iron into a stack of loosely laid sheets and pressing it onto a board: the stack gives way beneath it and the iron sinks; the board holds, and anything later spread over it only raises the surface. The far side is the stack, the near side the board. A specialist will object that a deeper crater is often an older crater less filled, or a younger one less worn. The comparison answers this where it can: the leading and trailing halves differ in wear (43% against 50% of their rims in the better-kept half, §A.2), yet their floors do not differ at all, so wear alone does not move the floor by the amounts in the table. Shape alone does not fully separate age from landing, and this is stated among the limitations of Study 6 (§I.1).
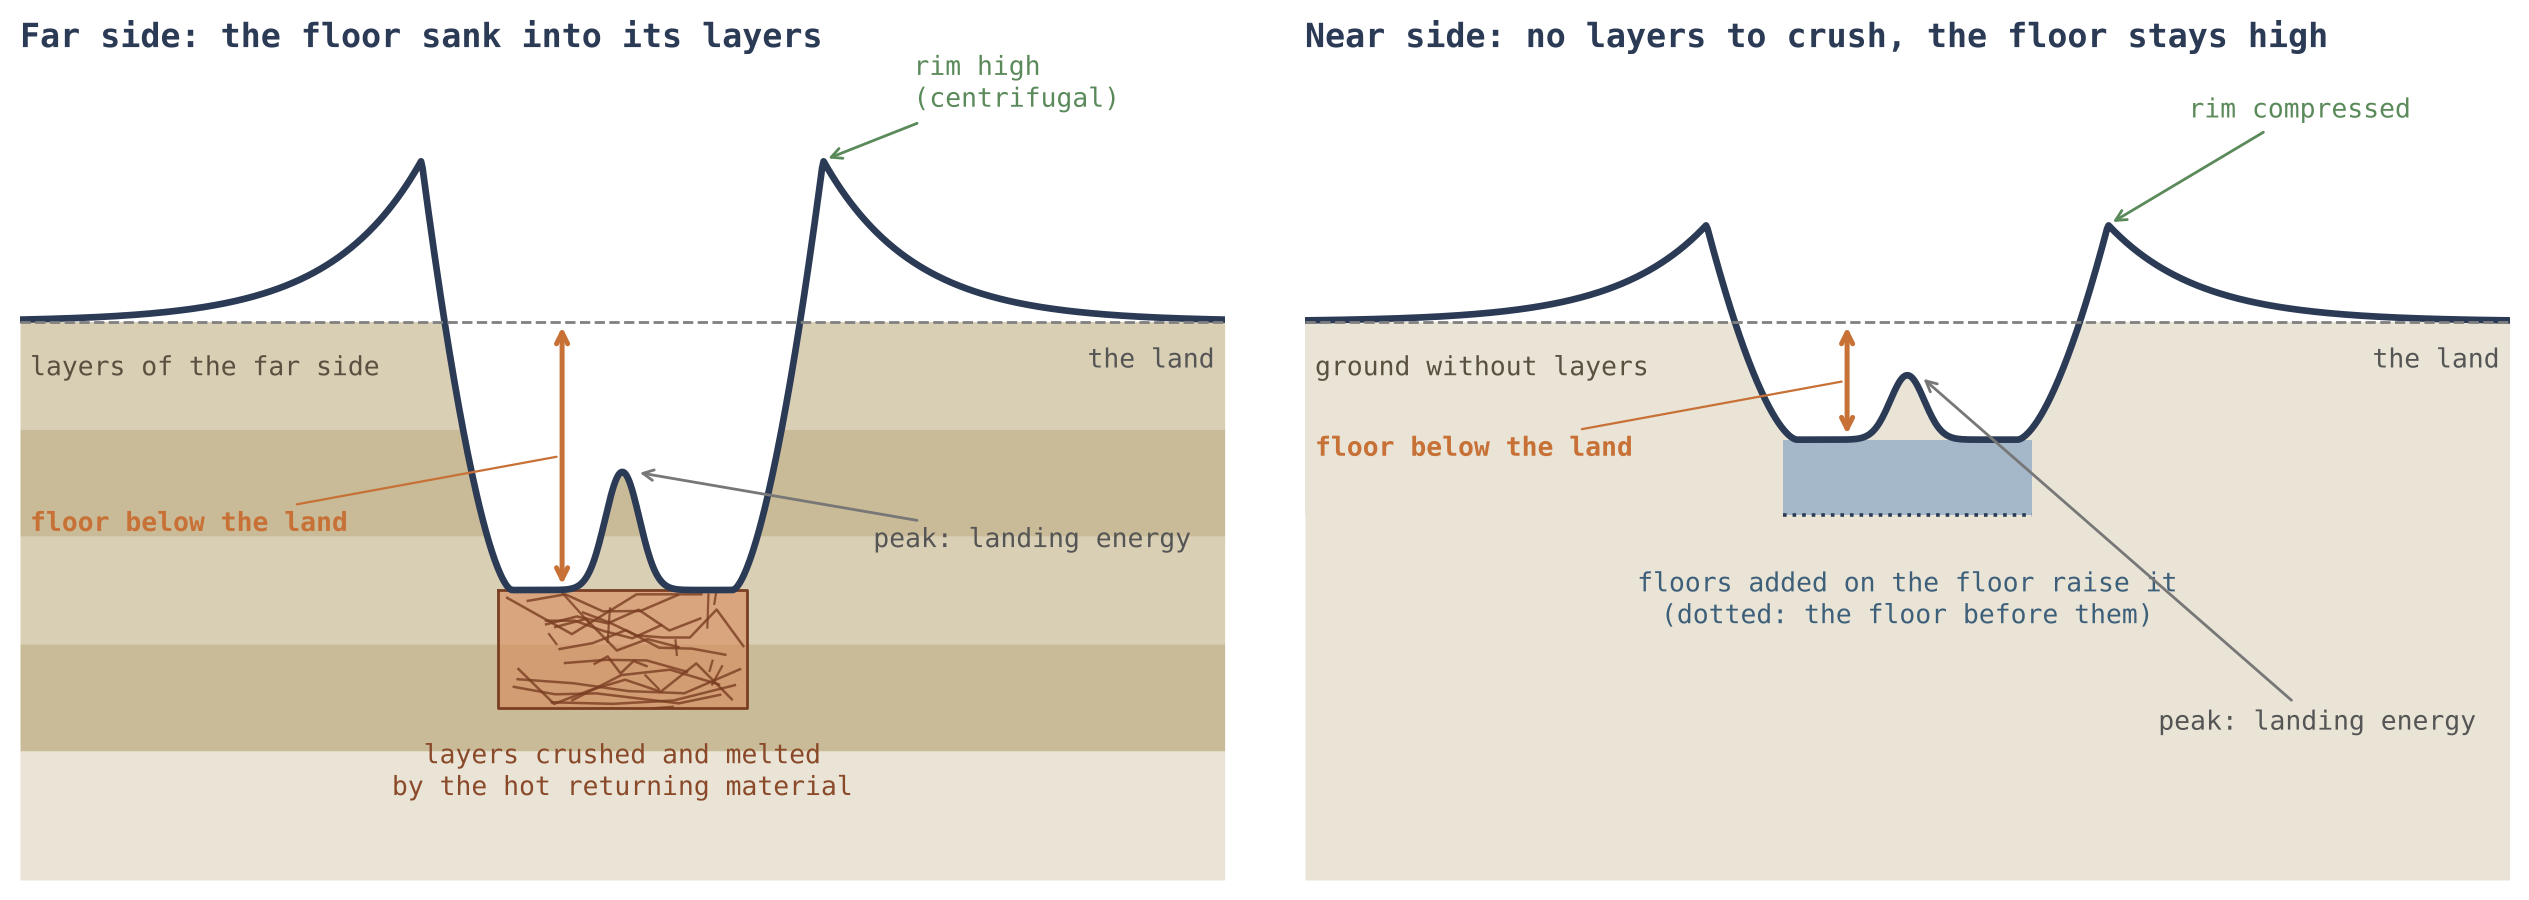
Figure 6 sets the two sides beside each other and shows the three records of a crater in one picture: the floor set by the ground beneath, the rim by the forces at landing, the peak by the energy of the landing.
Behind the scenes. The floor was first measured over the whole centre of the crater, central peak included. The leading half has the most central peaks, and a peak in the centre raises the floor’s median. Every floor was therefore measured again with the peak masked out: the footprint of the peak was traced on the elevation model and removed, and the floor was read on what remained, once out to 0.4 of the radius and once on the ring between 0.2 and 0.5 of it; the two agree. The values above are the first.
G.2 The floors of the large craters on the basalt
§G.1 compared the highlands of the four longitudes, the maria removed. This section turns to the craters that landed on the dark basalt of the near side itself, the ground that was hot and soft when they landed. Two kinds of basalt are kept apart here, as in §D.2: the floors of the maria, the basalt within the core of the feed dome beneath each of the openings of Paper 5, and the plains, basalt outside every mare — ordinary crust melted in place while the body was attached, with no feed dome beneath it. The craters are sorted by their state as in §D.2: melted (shallower than 95% of the highland craters of their size, seen as a ring), smeared (shallower than 75% of them) and sharp (made after the ground froze).
A crater of the highlands keeps the depth of a crater: its floor lies some 1.6 km below the land around it. A large crater on the near-side basalt does not. Its floor stands at the level of the basalt outside it, and about a third of the large ones stand higher. Of the 86 craters of 40 km and more with basalt mapped around them, 84 lie on the plains — the crust melted in place — and two on the floors of the maria of Paper 5; on the floors of the maria the large craters vanished into the active mare (§D.2), and what is measured here is the plains, hot ground of the same kind.
The table sorts the 86 large craters on the basalt by their state and sets them against 411 highland craters of the same sizes. For each crater the floor is compared with the basalt in a ring just outside it, and counted above if it stands more than 50 m higher, at its level if within 50 m, and below if more than 50 m lower. Read the last column from top to bottom: the floors go from a few tens of metres below the basalt (melted, orange) to more than a kilometre below (sharp, blue) and to the full depth of a highland crater (grey).
| Craters of 40 km and more | Craters | Above the basalt outside | At its level (50 m) | Below it | Median |
|---|---|---|---|---|---|
| Melted, on the basalt | 52 | 15 | 12 | 25 | m |
| Smeared, on the basalt | 24 | 9 | 2 | 13 | m |
| Sharp, on the basalt | 10 | 1 | 0 | 9 | m |
| Highland craters, same sizes | 411 | 12 | 9 | 390 | m |
The sharp craters behave almost like highland craters: their floors lie 1,388 m below the basalt, close to the highland 1,575 m, because they landed after the ground had frozen. The melted and smeared craters, which landed while it was still soft, have floors within about a hundred metres of the basalt, and many of them above it.
What is striking. Twenty-four of the 76 melted and smeared craters of 40 km and more have a floor standing more than 50 m above the basalt outside them, some by half a kilometre: Plato stands 500 m above the basalt of Imbrium, and a crater of 182 km in Oceanus Procellarum 518 m above the plain around it. It happens within the contact and beyond it alike. (The contact is the region of the near side that last touched the tip of the Earth’s pear, Paper 3.) Among the highland craters only 12 of 411, about one in thirty-four, have a floor above the land around them; among the melted and smeared craters on the basalt, about one in three.
Why it matters. If the basalt outside had filled the crater — over its rim or through a breach — the floor would stand at the level of that basalt, as water stands at one level in two connected vessels, or below it. A floor standing above the basalt outside cannot have been filled from it. It was filled from within, at a level of its own.
How the model reads it. The landing of a large body on ground still liquid or soft — a plain melted by the heat of the Earth, or a mare — raised the level of the floor beneath it, higher than it stands today. The raised floor then sank back toward the level of the ground around it; but sinking back takes time, and the ground was cooling while it did. Where the cooling won, the floor froze while it still stood high: about a third of the large craters. Where the floor had time, it settled at the level of the ground or a little below, as most of the melted craters did. A crater of the highlands landed on solid ground; nothing raised its floor, and it kept the depth of a crater. Two further things enter: the viscosity and the temperature of the ground, which set how fast the floor sank back and when it froze; and gravity. On the near side, material arriving from the Earth was drawn to the surface by the Moon’s gravity while the Earth’s pull acted the other way; the two partly offset each other, the landings were gentle, and many raised floors froze before they had returned. The far side was landed on while the body was attached, under the combined pull of the Moon and the Earth: the landings were harder, and its craters, on the maria and on the highlands alike, are the deeper.
The everyday picture is a lump dropped into a pot of thickening porridge: the surface where it fell first heaves and then slowly settles back, and if the pot cools fast enough the heave is left standing. Viscosity, used here, is a material’s resistance to flow — water has little, cold honey much; the more viscous and the colder the ground, the slower the floor sank back, and the more of the rise was kept.
What the gravity beneath adds. The mass beneath the craters points the same way (§D.3, Study 14). Under a highland crater the base of the crust stands lower than around it, by a median of 0.41 km: the landing broke the ground beneath it into light, loose material, and the crater sits over a deficit of mass. Under the melted craters of the plains there is neither deficit nor excess ( km): the ground was soft when they landed, and no lens of broken material was left beneath them. Under the melted craters on the floors of the maria there is an excess: the base of the crust stands km high, against under random points on the same floors, so the craters carry km more than their own floor, in 13 of 16. That excess is broad and has no edge: the steepness of the gravity at the crater’s edge is 1.04 against 1.00 on the floor around. A body of basalt filling the crater from outside would weigh with the sharp edge of the crater; material that sank into an active mare and spread in it does not. The craters on the soft ground of the near side therefore lack, in their gravity as in their floors, the mark of an ordinary crater on solid ground.
What we now have: the floor of a crater lies where its ground let it lie — deep in the crushed layers of the far side, near the surface on the near side, and on the soft basalt at the level of the ground or above it, where a rise was frozen before it could settle.
The phenomenon. Large craters on the near-side basalt are shallow: their floors are filled almost to the level of the basalt (Study 5). The gap in knowledge. Where exactly those floors stand against the basalt outside them — below it, at it, or above it — has not been measured crater by crater, and the answer separates two readings: a floor filled from the basalt outside cannot stand above it. The research question: at what level do the floors of the large melted and smeared craters on the near-side basalt stand, against the basalt immediately outside them, and against the floors of highland craters of the same size?
In the literature the floors of craters on the maria were filled by the same basalt flows that formed the maria [S20, S25]; floors raised above their surroundings are known in the floor-fractured craters, where magma rising beneath the crater spread as a sill and lifted the floor from below [S9]. (A sill is a flat sheet of molten material that forces its way sideways between layers and, as it swells, lifts what lies above it.) What is new here: every melted and smeared crater on the near-side basalt is measured against the basalt in a ring just outside it, the floors of the maria and the plains apart, with highland craters of the same size as the control.
A large landing on liquid or soft ground raised the floor beneath it; the floor sank back slowly while the ground cooled, and a part of the floors froze before they had returned. Hence: (a) the floors of the large melted and smeared craters stand near the level of the basalt outside, far above the depth of a highland crater; (b) a substantial share stand above it; (c) on the far side, landed on under the combined pull, the craters on the maria are deeper than on the near side.
Type of research: quantitative; heights compared crater by crater. The sample: the melted, smeared and sharp craters of 40 km and more on the near-side basalt, with basalt mapped in the ring outside them (86 craters: 84 on the plains, 2 on the floors of the maria); the control: 411 highland craters of the same sizes, outside the maria and SPA. The tools: the LOLA elevation model at 118 m, the LROC mare map, the feed domes of Paper 5, and code that reads the floor (out to 0.6 of the radius) and the mare in a ring at 1.6–2.4 radii, mare pixels only. LOLA is the laser altimeter of the Lunar Reconnaissance Orbiter, which times a laser pulse down to the surface and back; LROC is the camera of the same spacecraft, from whose images the outline of the basalt is mapped. The ring at 1.6–2.4 radii lies outside the rim and the thrown-out material nearest to it, so that it reads the basalt itself.
| Measure | What it means, in plain words |
|---|---|
| Floor minus the basalt outside | How high the floor stands above (or below) the basalt just outside the crater |
| Above, at level, below | Above: more than 50 m higher; at level: within 50 m; below: more than 50 m lower |
| The control | What the floor of an ordinary crater of that size does: it lies deep below its land |
The measurements were made on the classes fixed before (§E.2), without changing them; every crater was kept in the file, and those with too little mapped mare in the outer ring were set apart.
Against the control. The median floor of the large melted craters lies 46 m below the basalt outside, of the smeared 107 m; the highland craters’ 1,575 m below their land. Above the basalt. 15 of 52 melted and 9 of 24 smeared craters stand more than 50 m above it; of the highland craters, 12 of 411. By size. Among all melted and smeared craters, the share standing more than 50 m above the basalt rises with size: 5% at 5–10 km, 8% at 10–20, 20% at 20–40, 28% at 40–80 and 41% at 80 km and more (a test for a steady trend gives a probability of chance below one in a million million). Measured in proportion to the size of the crater, more than five thousandths of the diameter above, the share is 5–11% at every size and does not grow. By zone. Within the contact 11 of 39 large craters stand above the basalt, beyond it 13 of 37: no difference. Maria and plains. 84 of the 86 lie on the plains; of the two on the floors of the maria, one stands above. The far side. On the far-side mare floors the craters are deeper than on the near side from 20 km up: depth to diameter 0.026 against 0.021 at 20–40 km, 0.028 against 0.020 at 40–80 km and 0.021 against 0.010 at 80 km and more (probabilities of chance 0.016, 0.02 and 0.002); and fewer are melted, 38% against 50%. The far-side highland craters are deeper than the near-side ones as well, as the combined pull acted on both.
The two measures of size say different things and both are kept. A fixed threshold of 50 m is a larger share of a small crater’s depth than of a large one’s, so the share above it would be expected to grow with size even if every crater were raised by the same fraction of its diameter; measured in proportion to the diameter, the share is the same at every size. A “probability of chance” is the chance that a difference as large as the one found would arise if the two groups were in truth alike; the smaller it is, the less the difference can be put down to chance.
Result. All three parts are supported: the floors of the large craters on the basalt stand at its level, not at the depth of a crater; a third of them stand above it; and the far-side craters on the basalt are the deeper. A floor above the basalt outside was not filled from it. The craters measured lie on the plains; on the floors of the maria the large craters vanished. Limitations. The basalt outside is read as the median of a ring; where the mare slopes, as toward the centre of a basin, one side can appear high, and no tilt was corrected; the rise of the share with size holds in metres but not in proportion to the crater, so a larger landing is not yet shown to raise the floor more; a raised floor alone does not tell a frozen rise from an intrusion beneath it. Directions for further research. A reference for the basalt outside corrected for its tilt; the shape of the raised floors, whether higher at the centre, as a frozen rise would be, or flat; and the same measure on the far-side maria.
G.3Iron in the high floors and in the low
§G.2 found that some floors on the basalt froze high and others settled low. If the floors were sorted while they were still liquid, the high and the low should differ not only in level but in what they are made of. This section reads their iron and titanium. FeO (iron oxide) and TiO (titanium oxide) are given in wt%, per cent of the weight of the surface material; both are heavy, and both are read from orbit by the way the surface reflects light at several wavelengths.
The raised floors of §G.2 are poorer in iron than the floors that lie low; nearly all of them lie on the plains. A raised floor froze while the rise of the landing still held it up; it was rich in volatiles, and the volatiles carried the light material up with them. The floors that sank back to the level of the ground or below it settled with the heavier material, the iron and the titanium. Volatiles are the substances that turn to gas easily — water above all; rising as bubbles, they carry the lighter part of a melt upward, as the bubbles in a boiling pot carry the froth to the top.
The table sorts the melted and smeared craters of 20 km and more — a wider sample than the 40 km of §G.2, so that the groups are large enough to compare — by the height of their floor against the basalt outside, by the same 50 m rule. Blue marks the high floors, orange the level and low ones; the bold values are the two groups the hypothesis compares.
| Melted and smeared craters of 20 km and more | Craters | FeO of the floor (wt%) | TiO (wt%) |
|---|---|---|---|
| Floor above the basalt outside (50 m) | 51 | 13.3 | 1.5 |
| Floor at the level of the basalt (50 m) | 71 | 15.7 | 2.9 |
| Floor below the basalt outside (50 m) | 86 | 14.4 | 2.5 |
The high floors carry the least iron and the least titanium of the three groups: 13.3 wt% FeO against 14.4 in the low floors, and 1.5 wt% TiO against 2.5 — titanium lower by some two fifths. The floors at the level of the basalt are the richest of the three; the study below sets out what this does and does not decide.
The phenomenon. About a third of the large craters on the basalt have floors that stand above the basalt outside them, and the rest lie at its level or below it (Study 10). The gap in knowledge. Whether a floor that froze high differs in its chemistry from one that settled low has not been measured. The research question: do the floors that lie below the basalt outside carry more iron and titanium than the floors that stand above it?
Iron and titanium are read from the Kaguya Multiband Imager [S10]. In the literature a crater floor on a mare carries the basalt that flooded it, and its iron is that of the flow; a floor raised by an intrusion beneath it carries its own fill [S9]. What is new here: the floors are sorted by their height against the mare just outside them, and their iron and titanium compared.
A raised floor froze while it was held up, rich in volatiles that carried the light material with them; a floor that sank back settled with the heavier material. The low floors therefore carry more iron and titanium than the high floors.
Type of research: quantitative; groups compared. The sample: the melted and smeared craters of 20 km and more on the near-side basalt with basalt mapped around them (208 craters; 195 on the plains and 13 on the floors of the maria). The tools: the floor heights of Study 10 and the Kaguya iron and titanium of each floor (out to 0.7 of the radius) and of the basalt outside, at 128 pixels per degree. At that sampling a pixel spans a little more than 200 m on the lunar surface.
Each floor was placed in its group by its height against the basalt outside, by the rule of Study 10, before the chemistry of the groups was compared.
The groups. The low floors carry 14.4 wt% FeO and 2.5 TiO, the high floors 13.3 and 1.5. A test of whether two groups differ (the Mann–Whitney test, which compares their ranks) gives a probability of chance of 0.018 for the iron and 0.010 for the titanium. Within one unit of basalt. In seven units that hold both a high floor and a floor more than 200 m low, the low floor is the richer in iron in five, by a median of 0.9 wt%. Sensitivity. Taking as low only the floors more than 100, 200 or 300 m below the basalt, the low floors stay the richer (13.7, 14.3 and 14.5 against 13.3 wt%), but with fewer craters the difference is no longer beyond chance (probabilities 0.15, 0.21 and 0.33). The richest. The floors at the level of the basalt are the richest of all, 15.7 wt%. The plains alone. On the plains the low floors carry 14.4 wt% FeO and 2.5 TiO, the high 13.4 and 1.5 (probabilities 0.04 and 0.01); on the floors of the maria there are three high and three low, too few to compare.
The comparison within one unit of basalt matters because the basalt of the near side is not the same everywhere: some units are richer in iron than others. Comparing a high and a low floor that lie in the same unit removes that difference, and the direction holds there too. The sensitivity test asks whether the result depends on where the line between “low” and “level” is drawn; the direction stays the same at every line, while the groups shrink and the certainty falls.
Result. The hypothesis is supported: the low floors carry more iron and titanium than the high, beyond chance in the full comparison and in the same direction within the units of basalt, and on the plains alone. Limitations. Part of the difference comes from the units the floors lie in, since against the basalt just outside each floor the difference is smaller ( against wt%) and not beyond chance; the stricter groups are small; the maps resolve about 240 m. Directions for further research. The volatiles of the high floors directly, from their spectra and their thermal properties, against the low.
What we now have: the floors of the craters on the soft basalt were sorted while still liquid — the high ones frozen with the light, volatile-rich material, the low ones settled with the iron and the titanium.
The floor of the crater
the surface of the floor records what shook it and what filled it. The approach: the flatness and roughness of the floors are compared at four longitudes, and three readings set against each other.
Part G read how deep the floor lies; this Part reads its surface — whether it is smooth and flat or rough and broken. The same four caps and size bins are used as in Part F, and the roughness, like the rim irregularity, is read in the deeper, better-kept half of each bin, so that a floor smoothed by later filling does not pass for a gentle landing. Three explanations of the differences are then set against each other, and the data decide between them.
H.1Flatness and roughness
The table gives two measures of the floor. The flat fraction is the share of the floor whose slope is below 2° — ground that is practically level. The roughness is the spread of the slopes of the floor measured over steps of 500 m, in degrees: a smooth floor has slopes that vary little, a broken one slopes that vary much. “W/E 0.34” means that the leading half’s floors have a third of the trailing half’s flat area; “W/E 1.50” that they are half as rough again. Red marks the leading half, the roughest and least flat; blue the near side, the flattest over all craters.
| Measure | 90°W leading | 180° far | 90°E trailing | 0° near | Reads |
|---|---|---|---|---|---|
| Flatness and roughness | |||||
| Floor area with slope , deeper half, 20–30 km | 0.04 | 0.14 | 0.11 | 0.09 | W/E 0.34 (0.26–0.49) |
| Floor roughness, 500 m (°), deeper half, 20–30 km | 4.5 | 2.7 | 3.0 | 3.6 | W/E 1.50 (1.25–1.68) |
| Floor area with slope , all craters, 20–30 km | 0.06 | 0.14 | 0.13 | 0.17 | N highest, W lowest |
Both intervals of the leading half lie well away from 1 (0.26–0.49 and 1.25–1.68): in the deeper craters of 20–30 km only 4% of a leading-half floor is flat against 11% on the trailing half, and its slopes vary by 4.5° against 3.0°. Over all craters, the shallower ones included, the near side has the flattest floors, 17% of their area.
The floors are the roughest at 90°W. Three readings were set against one another, and the data separate them in part:
| Reading | What it predicts | What the data show |
|---|---|---|
| The shock of a hard landing roughened the floor | In each crater, a rough floor goes with a jagged rim, and most where the landings were hardest | Correlation of floor roughness with rim jumps, crater by crater: 0.40 at 90°W, 0.30 at 90°E, 0.15 at 180°, 0.02 at 0° — supported |
| The floors were smoothed from below, by the maria | The smoothest floors where the maria are most | Flat floor fraction highest on the near side, the half of the maria, in every size bin (0.17, 0.16, 0.20 against 0.13–0.16 at 90°E and 180°); 90°E and 180° alike between (a shallow, smooth floor is a mare in the making) — supported for the near side |
| The leading half met more space dust, which roughened its floors | The excess grows with exposure: larger on the shallower craters than on the deeper | Roughness 90°W/90°E: 1.40 shallower against 1.50 deeper (20–30 km), 1.12 against 1.43 (30–50 km) — not supported |
Each row of this table is a test: a reading, the pattern it requires, and the pattern found. The first reading is tested crater by crater. A correlation measures how closely two quantities rise and fall together, from 0 (unrelated) to 1 (in step); if the shock of the landing both broke the rim and roughened the floor, the two should go together within each crater, and most strongly where the landings were hardest. They do: 0.40 on the leading half, falling to 0.02 on the near side, in the order of landing strength found in Part F. The second reading is tested by place: the near side, where the maria are, has the flattest floors in all three size bins. The third is tested by age. A shallower crater is, on the whole, an older one, its walls slumped and its floor filled with time; dust from space accumulates with time, so if dust had roughened the leading half’s floors, its excess of roughness would be larger in the shallower, longer-exposed craters. It is smaller (1.40 against 1.50, and 1.12 against 1.43), so the roughness was there from the start.
The first two readings are not exclusive. The leading half was landed on harder, and its floors carry the shock; the near side lies by the maria, and its floors were smoothed from below. The third reading does not grow with age, and is not needed. A floor that is flat because the maria rose into it is the subject of §D.2 and Part E, and of Paper 5.
What we now have: the surface of the floor records two things — the shock of the landing, strongest on the leading half, and the filling from below, strongest on the near side by the maria. With the rim (Part F) and the depth of the floor (Part G), it completes the record of the ground and of the forces; the energy of the landing, read in the central peak, follows in Part I.
The central peak
the peak records the energy of the landing. The approach: the share of craters with a peak and the height of the peak above the floor are compared at four longitudes.
Parts F and G read the rim and the floor of a crater; Part H its roughness. This part reads the last element of the crater’s shape, the hill that stands in the middle of many larger craters. The rim records the forces at the moment of landing, the floor the ground beneath; the peak, as this part shows, records how much energy the landing carried. Together with Parts F–H it completes one study of crater shape at four longitudes, Study 6, set out in full at the end of this part.
What a central peak is. A small fresh crater is a simple bowl: its walls run down to a rounded bottom. Above a certain size the form changes: the floor becomes flat, and a mound or a cluster of hills rises from its centre. This mound is the central peak. On the Moon the change appears in craters of about 15–20 km across [S27], and the peak is read in the literature as the rebound of the floor after the landing [S28]. A peak therefore marks a landing that delivered more energy than the ground could absorb by being pushed aside; the surplus came back up in the centre.
The series’ reading of the peak. In the model the returning material was deep material of the parent, ejected through its openings (Part J), and it reached the surface still hot. It was of low viscosity — it flowed easily, in the way hot syrup flows and cold syrup does not — and it had not had time to cool in a flight of minutes (§K.1). It landed as a hot, mobile mass. Such a mass does not simply dig a hole; it drives the ground beneath it down and outward, and the ground then springs back in the centre. Because the material in the centre was still soft and hot, the rebound was able to rise, and it then froze where it stood. The peak is that frozen rebound.
I.1The peak at four longitudes
The question this section answers is whether the share of craters with a peak, and the height of the peak, differ between the four longitudes in craters of the same size. The four longitudes are those of the earlier parts: the leading half (90°W), the far side (180°), the trailing half (90°E) and the near side (0°), each a cap of 30° radius with the maria, South Pole–Aitken and the large basins removed. The table gives, for three size classes, the percentage of craters that carry a peak (upper block) and the height of the peak above the floor in the craters that have one (lower block). Read it across a row: in the upper block green marks where peaks are most common and orange where they are least common, and the right-hand column states the direction; in the lower block grey marks the highest peaks and blue the lowest, and the last column gives a difference between two longitudes with its 95% interval, found by resampling the craters (Study 6, Step 6). Heights are given in thousandths of the crater diameter, , so that craters of different sizes can be compared.
| Measure | 90°W leading | 180° far | 90°E trailing | 0° near | Reads |
|---|---|---|---|---|---|
| Craters with a central peak (%) | |||||
| 20–30 km | 60 | 46 | 49 | 56 | W highest |
| 30–50 km | 81 | 74 | 69 | 74 | W highest |
| 50–100 km | 94 | 98 | 81 | 68 | 180° highest, W next |
| The central peak above the floor, craters with a peak () | |||||
| 20–30 km | 17 | 30 | 19 | 9 | NE ( to ) |
| 30–50 km | 17 | 17 | 14 | 15 | 180°E ( to ) |
| 50–100 km | 12 | 14 | 11 | 12 | 180°E ( to ) |
The peaks point to 90°W. Below 50 km the leading half holds the most craters with a central peak; at 50–100 km nearly every crater has one, and the far side’s 98% edges past the leading half’s 94% (an earlier version said “at every size”). A central peak is the rebound of the landing. The returning material was of low viscosity and had not had time to cool in its flight; it landed as a hot, mobile mass, drove the ground down and outward, and in the centre sprang back up, as a drop falling into a pool throws a spike back up; it then set where it stood, as a peak in the middle of the floor. Only a landing with enough energy springs back so: small craters stay simple bowls, and on the Moon the peaks appear from about 15–20 km. The craters of 20–30 km stand near that threshold: the leading half, met head-on by the body’s own ejecta, has a peak in 60% of them, the far side in 46%. The far side’s landings were the hardest of all, made while the body was attached, under the combined pull of the Moon and the Earth (§G.2). In the craters of 50–100 km every landing had energy enough, and the far side’s craters carry a peak almost without exception (98%).
Why the threshold size is the place to look: a test of strength is sharpest where the outcome is in balance. In a large crater nearly every landing carried enough energy for a peak, so a harder landing adds little; in a crater just above the threshold, a small extra push decides between a bowl and a peak. That is why the clearest difference between the halves, 60% against 46%, appears in the smallest class. The leading half is the one met head-on by the material the body itself threw (Parts F–H): of the landings of that stage its were the hardest, and more of its near-threshold craters crossed into the form with a peak.
The central peaks follow the rims. Where the rims stand high the peaks do too: the far side’s peaks rise the highest above their floors, 30 thousandths of the diameter in the craters of 20–30 km and 14 against the trailing half’s 11 in those of 50–100 km, and the near side’s the lowest, 9 in the craters of 20–30 km. The centrifugal force of the shared rotation acted on both, rims and peaks alike: on the far side it lifted them, on the near side it pressed them down.
The centrifugal force here is the outward push felt by anything turning with a rotating body, as a passenger on a roundabout is pressed outward. In the shared rotation the far side faced outward, away from the parent, and the push there pointed away from the surface: soft material standing up from the floor, the rim and the peak alike, was helped upward before it set. On the near side, facing the parent, the same outward push pointed into the surface, and the same material stood lower. The peak and the rim therefore record the same thing, and the agreement between them is a check that the pattern is not an accident of one measurement.
What we now have: the share of peaks records the strength of the landing, highest on the leading half near the threshold size; the height of the peaks records the rotation that the shell shared with the parent, highest on the far side and lowest on the near side. The study that follows sets out rim, floor, roughness and peak as one research.
The phenomenon. The craters of the four longitudes differ in number (Study 1). The gap in knowledge. If the landings differed in strength from one half to the other, the shape of the craters must differ too: the rim, the floor, the roughness and the central peak. The literature has measured crater shapes globally, but not side by side for the four longitudes with the maria removed and the central peak kept out of the floor. The research question: do the rim, the floor below the land, the roughness of the floor and the central peak of craters of the same size differ between the leading half, the trailing half, the far side and the near side?
The shape of a fresh lunar crater changes with its size: small craters are simple bowls, and from about 15–20 km craters carry a flat floor and a central peak [S27]. The central peak is read as the rebound of the floor after the landing [S28]. The depth of a crater shrinks with age as its walls slump and its floor fills, so depth is also used as a measure of age. What is new here: depth is split into three heights (§A.2) and each is compared between the four longitudes, crater size held fixed, the peak masked out of the floor, and the maria, SPA and the large basins removed. Holding size fixed matters because shape changes with size by itself; a comparison of craters of different sizes would show the size, not the longitude.
The leading half, landed on hardest, carries the marks of a hard landing: more jagged and elongated rims, lower rims, rougher floors and more central peaks near the threshold size. The far side, where the shared rotation lifted the material outward, carries the highest rims and peaks and the lowest floors, sunk into its layers; the near side the lowest rims and the highest floors.
Type of research: quantitative; measures of shape compared between regions, size by size. The sample: 1,457 craters of 20–100 km in four caps of 30° radius centred on 90°W, 180°, 90°E and 0°, the maria, SPA and the large basins removed. The tools: the SLDEM2015 elevation model at about 60 m [S7], the catalogue of Robbins [S6], and code that traces each rim at 72 azimuths and reads the floor with the peak masked out. The table below translates each measure into plain words.
| Measure | What it means, in plain words |
|---|---|
| Rim irregularity | How much the rim height jumps around the circle: a broken rim jumps more |
| Rim elongation | How far the rim departs from a circle: a slanted arrival stretches it |
| Rim above the land | How high the rim stands over the ground around the crater |
| Floor below the land | How deep the floor lies under the ground around it, the peak left out |
| Floor roughness | How uneven the floor is, by the spread of its slopes |
| Central peak | Whether the crater has one, and how high it stands above its floor |
Each crater was measured on the elevation model at 72 azimuths. The footprint of the central peak was traced and removed before the floor was read, once out to 0.4 of the radius and once on the ring of 0.2–0.5; the two agree. The values are the tables of Parts F–I. The peak is removed because a peak in the centre raises the median height of the floor; without the mask, the half with the most peaks would appear to have the highest floors for that reason alone (§G.1).
Intervals. Each difference between two regions is given with a 95% interval found by resampling: the craters are drawn again at random many times, the difference recomputed each time, and the middle 95% of the results kept. A difference whose interval excludes zero is not explained by chance. The rims. In the craters of 20–30 km the leading half’s rims are the most irregular (ratio to the trailing half 1.25, interval 1.00–1.48) and stand 4.5 thousandths of the diameter lower than the trailing half’s, the interval excluding zero. Above 30 km the far side’s rims are the highest. The floors. The far side’s floors lie the lowest at every size, by 9 to 18 thousandths of the diameter more than the trailing half’s, every interval excluding zero; the near side’s the highest; leading and trailing alike. The peaks. Near the threshold size, 20–30 km, the leading half has a peak in 60% of its craters against 46% on the far side; in 50–100 km the far side’s craters have a peak in 98%.
Result. The hypothesis is supported in its main parts: the leading half carries the marks of a hard landing in its rims and peaks, the far side the highest rims and the lowest floors, the near side the lowest rims and the highest floors. Between the two halves it is the rim that differs, not the floor. Limitations. Some intervals, of the rims of the larger craters, include zero; the near side’s land is small once the maria are removed, and its samples are the smallest; an older crater is also shallower, so age and landing are not fully separated by shape alone. Directions for further research. The same measures for craters of 5–20 km, where the counts are larger, and a model of the rim built by a landing under the shared rotation, to give the expected size of each difference.
The engine
deep pressure, ejection velocity and landing velocity are different quantities. The approach: the energy at the opening, the shock at the landing, the passage through the vapour and the velocity ceiling are stated with what they require.
Parts C–I read the craters as they are. This part asks the physical question behind all of them: can material thrown from an opening come back fast enough to make a crater and to leave the marks of shock in the ground it lands on? Three quantities must be kept apart. The deep pressure is the pressure inside the parent that lifted the material to the opening (Paper 3). The ejection velocity is the speed at which the material leaves the opening. The landing velocity is the speed at which it meets the receiving surface. Each is set by different physics, and a conclusion about one cannot be carried over to another without a calculation. The sections below take them in order: the energy needed at the opening (§J.1), the pressure produced at the landing (§J.2), the losses on the way through the vapour (§J.3), the state of the arriving material and of the surface that receives it (§J.4), and the upper limit on the speed of material that stays bound to the Earth (§J.5). The flights themselves — their time, their height and where they land — are computed in Part K.
J.1Energy available at the opening
The question this section answers is how much energy each kilogram must receive at the opening to leave at a given speed, and where that energy can come from.
For unit mass ejected at velocity , the kinetic energy relative to the opening is:
In words: the energy of motion of one kilogram is half the square of its speed. Because the speed is squared, doubling the speed takes four times the energy. Velocities of 2, 3, 5 and 8 km/s require respectively 2, 4.5, 12.5 and 32 MJ/kg. A megajoule per kilogram is a familiar scale: 12.5 MJ/kg, the cost at 5 km/s, is a sizeable fraction of the chemical energy stored in a kilogram of fuel. The energy must therefore be delivered at the opening by a definite source, and the account must show it.
In an incompressible material, a local pressure difference can supply at most per unit mass in ideal conversion. This is the familiar rule of a water jet: a pressure difference across a nozzle can give each kilogram at most of energy, and in practice less. In an expanding material the enthalpy drop or the pressure work along a thermodynamic path must be computed, together with heat, gravity and losses. Here the material is not a still liquid: gas dissolved in it comes out of solution and expands as the pressure falls, and that expansion does work on the melt around it.
The lift cost of 139.78 GPa in Paper 3 is not an additional reservoir at the opening after the material has already been lifted. Nor is the radial pressure remainder of 2.074 GPa in a particular example of Paper 3 an ejection budget that has been allocated and solved. The test requires sufficient energy for equation (5) to remain after the energy costs of lift, flow and load support have been accounted for. Ideal conversion of pressure to velocity is not a guaranteed lower bound on the velocity.
Where the ejection energy comes from. The pressure that throws the material out is the pressure from the Earth. The spin and the sorting — one mechanism (Paper 3) — create it in the Earth’s interior; it passes through the pear into the body, reaches the openings, which are its outlets, and sprays the material out of them, as the pressure in a hose throws the water out of the nozzle. The volatiles assist: water and other gases dissolved in the deep melt under pressure come out of solution as the melt nears the opening, expand, and add their push to the throw. A shaken bottle of soda shows this part on a small scale: the gas leaving the liquid throws the liquid out. The full energy account — how much of the pressure reaches the opening after the costs of lift, flow and load support, and how much the volatiles add — is a requirement of the model: together they must supply per kilogram for the velocities that the craters require.
J.2Velocity and shock pressure
The question this section answers is what pressure the returning material produces in the ground when it lands at a given speed. The pressure matters because a landing records itself in the minerals of the ground only above certain pressures (shock metamorphism); a crater made by a soft arrival and one made by a shock look different in the laboratory.
What a shock is, and what the Hugoniot is. When a body lands faster than sound travels in the ground, the ground ahead of the contact cannot move out of the way in time. A sharp front forms, a shock, across which pressure, density and velocity jump. Two speeds describe it: the speed of the front itself, , and the speed that the material behind the front acquires (the particle velocity). For most solids, measured in the laboratory, the two are related by a straight line, ; this line is the material’s Hugoniot. is close to the speed of sound in the material, the speed of the front for a very weak shock, and tells how much faster the front runs as the shock grows stronger.
Impedance matching. At the contact, the two sides must have the same pressure and the same velocity, otherwise they would separate or pass through each other. When the arriving body and the ground are of the same material, they are equally stiff, and the jump in velocity is shared equally: the arriving body slows by half its speed, and the ground beneath it is set moving at half that speed. Hence the rule below. For two different materials — a hot melt on a cold crust, for example — the stiffer side takes the smaller share, and the split must be solved from both Hugoniots; this is what impedance matching means.
In a planar head-on landing of identical materials, the particle velocity behind the shock front is , where is the normal landing velocity. Using the basalt relation :
In words: the pressure jump across the shock equals the density of the undisturbed ground, , times the speed of the front, times the speed given to the material. It is the balance of momentum across the front: in each second the front sweeps up a mass per square metre and sets it moving at , and the force per square metre needed to do that is the pressure. is the pressure before the shock and is small. Because itself grows with the landing speed, the pressure grows somewhat faster than in proportion to the speed.
Sekine and colleagues give km/s and , approximately for the low-pressure branch up to of about 4 km/s. The paper’s own experiments reached about 25 GPa; the broader curve also draws on comparisons with additional data [S3]. At a reference density of 2,700 kg/m³:
| , km/s | , km/s | Estimated , GPa |
|---|---|---|
| 2 | 1 | 12.96 |
| 3 | 1.5 | 22.07 |
| 5 | 2.5 | 45.56 |
| 8 | 4 | 93.96 — at the edge of the approximation’s range |
The table reads down: each row is one landing speed, the particle velocity it gives (half the speed), and the contact pressure from equation (6). At 5 km/s, the example used throughout the paper, the front runs at 3.5 plus 1.3 times 2.5 km/s, and the contact pressure is 45.56 GPa — several hundred thousand times the air pressure at sea level. Even the slowest row, 2 km/s, gives 12.96 GPa. The last row, 8 km/s, has a particle velocity of 4 km/s, at the upper end of the range in which the straight-line Hugoniot was fitted, and is read with that caution.
These are local contact pressures in an idealised example, not pressures acting uniformly across the whole crater. In an oblique landing, in a porous medium or in a magma–sial pair, impedance matching and suitable equations of state must be solved. A foamed density must not be used for the ejection and the returning body then assumed to have become dense basalt without a compaction or solidification path. The reason is consistency: the same material cannot be counted light and foamy where lightness helps (in leaving the opening) and dense where density helps (in the pressure of the landing), unless the path between the two states is shown.
Figure 7 draws equation (6) as a curve. The solid line is the range of the fit, the dashed continuation lies beyond it, and the dots are the rows of the table. The horizontal dashed line marks the 25 GPa reached in the experiments of [S3]: below it the curve rests on direct measurement, above it on the fitted line and on comparison with additional data.
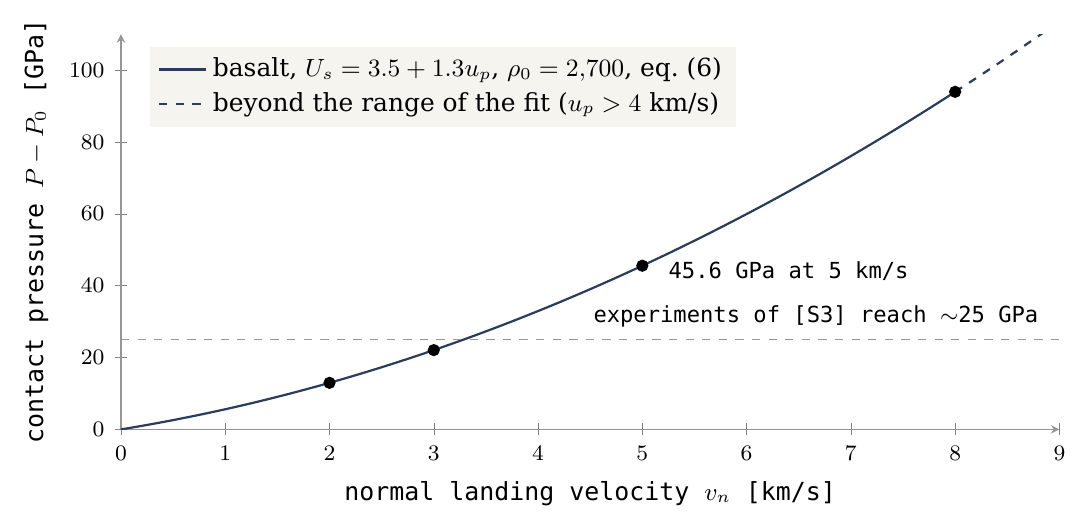
Can a liquid make a shock? A specialist may object that a molten returning body is too soft to shock the ground. It is not: a liquid resists compression almost as strongly as a solid, and a compression wave runs through it in the same way; what a liquid lacks is strength against shear, not stiffness against squeezing. A liquid returning body can transmit a compression wave; full solidification is not a condition for the creation of shock itself. However, the size, density, dispersal and heat of the returning body affect the pressure, the pulse duration and the excavation. Thresholds for mineral changes depend on the type of material and its state [S4]. A slower landing can also form a secondary crater under suitable conditions [S1]; there is no universal threshold below which “nothing is recorded”.
J.3 The vapour atmosphere is part of the test
The question this section answers is how much speed the returning material loses on its way through the vapour that surrounded the parent in the scenario. This matters because the landing pressure of §J.2 depends on the landing speed, and every kilometre per second lost in the air is lost from the crater.
The flight tables assume a vacuum. In the vapour environment of the scenario, the column of material through which the returning body passes must be examined. Define a ballistic coefficient and an atmospheric column along the path . In a drag-only model, with constant mass and area and no other forces:
The symbols: is the mass of the returning body, its cross-section facing the flow, and its drag coefficient, a number near one for a blunt body. The ballistic coefficient is therefore mass per unit of frontal area: it says how much body stands behind each square metre that pushes the gas aside. A cannonball has a large and a feather a small one. is the mass of gas per square metre that lies along the path — the weight of the air column the body must push through, expressed as mass. Equation (7) says that the body keeps its speed as long as the gas it meets is small compared with its own mass per area; when the two become comparable, the speed falls off exponentially. A heavy, compact body passes almost untouched; a light or finely broken one is stopped.
For an example only, a spherical body one kilometre in diameter, density 2,700 and , gives kg/m². Two nearly vertical crossings of a hydrostatic column at an adopted base pressure of 100 bar and give , and a velocity attenuation factor of about 0.51 in the drag model. 100 bar is not a reconstructed pressure of the ancient atmosphere.
The two crossings are the way up and the way down: the material leaves the opening through the vapour and comes back through it. In a column at rest, the base pressure equals the weight of the gas above each square metre, so for one crossing is the base pressure divided by the effective gravity. With the two crossings together the column is 1.35 times the body’s , and the body arrives with about half the speed it would have had in a vacuum. A body thrown at 5 km/s would land at about 2.5 km/s; by Figure 7 this still gives a contact pressure above 12.96 GPa, the value at 2 km/s.
The example demonstrates that drag is not a correction that can always be neglected. For a real trajectory, gravity and drag must be solved together; heating, break-up and the motion of the gas also change . Volatiles may assist ejection and at the same time make rapid passage through the atmosphere harder. A single parameter domain must satisfy both the ejection and atmospheric-passage requirements. Put plainly: the same gases that throw the material out (§J.1) also form the vapour it must cross, so more gas helps the throw and hinders the flight. The model requires a range of gas content, body size and vapour pressure in which both are met at once.
J.4 A landing lump, a cloud of material and a preserving surface
The question this section answers is in what state the material must arrive, and what kind of surface must receive it, for a crater to be made and kept.
The same mass arriving as a dense lump or as a dispersed cloud does not create the same shock pulse. A lump delivers its momentum to a small area in a short time, and the pressure is high; a cloud spreads the same momentum over a wide area and a longer time, as a bucket of water poured from a height strikes differently from a single block of ice of the same weight. A tidal deformation time alone does not determine whether a lump breaks up: viscosity, strength, surface tension and sometimes self-gravity must be included. Viscosity resists the stretching of a soft lump; strength holds a solid one together; surface tension holds a drop together, as it holds a drop leaving a syringe; and in a large body its own gravity does the same. There is no basis for assuming that every long-range lump arrives intact, or that every molten returning body loses its cratering capacity.
The receiving surface must be thick and strong enough relative to the size of the crater (Figure 8). A freezing layer one metre thick does not prove preservation of a crater kilometres across. Paper 3 treats the shell: stiff and cold at the surface, mobile at its base. The test here adds landing heating and the need for the record to form before burial or relaxation. Relaxation is the slow flattening of a crater whose ground is too soft to hold its shape, as a pit pressed into thick honey closes over time; a crater survives only if the ground beneath it is stiff enough, to a depth comparable with its size, for long enough.
Figure 8 shows what such a surface looks like today. The far-side highlands around Tsiolkovskiy are covered with craters of every size, each overlapping the next, on the thickest crust of the Moon. In the model this is the oldest record, made on the shell while it still lay on the parent and carried up with it.
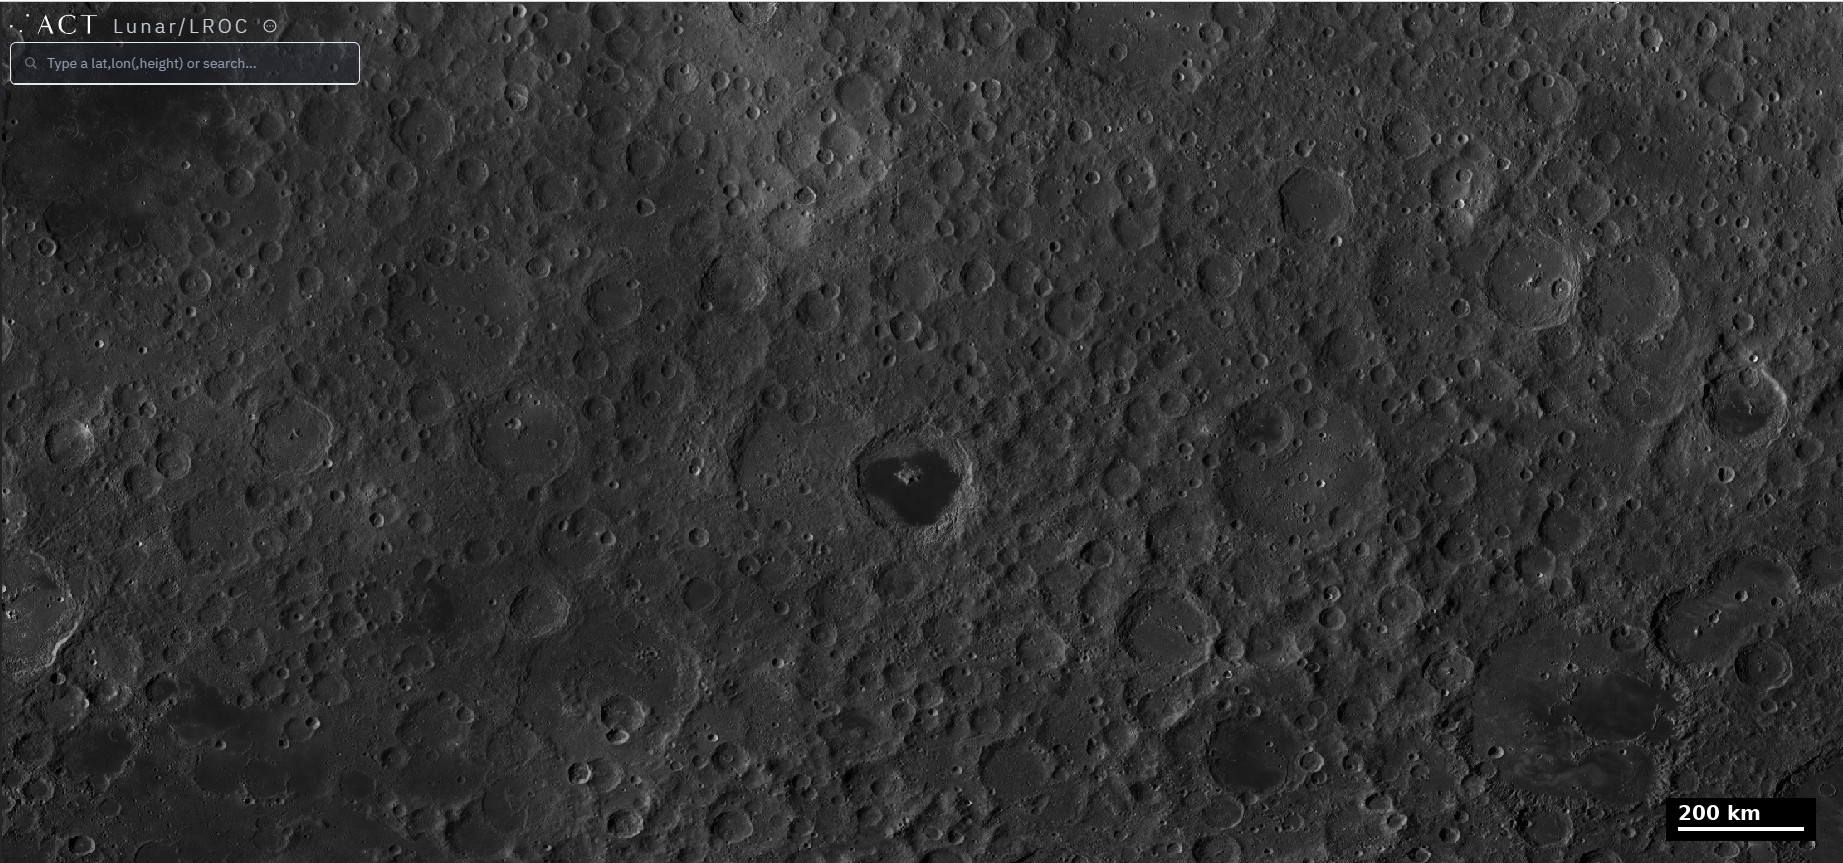
J.5 Gravitational binding and a velocity ceiling
The question this section answers is how fast material may be thrown and still return. Material thrown too fast leaves the Earth for good and makes no crater on the shell; the ceiling therefore bounds the speeds the craters can record.
In the central model, gives for radial ejection:
Energy conservation in a central field. In a field that pulls toward one centre and does not change in time, the total energy of a thrown body — energy of motion plus energy of position — stays constant along its flight. is that total, per kilogram (equation 10 of §K.1). A body with negative total energy cannot climb out of the field: it rises, slows, and falls back. A body with positive total energy escapes. is the strength of the terrestrial field, the radius from which the material is thrown (6,721 km in the example), and the rate of the parent’s rotation. The term is the square of the escape speed from a body at rest. The second term, , is the share already paid by the rotation: material on the equator of a turning surface moves sideways with that surface at before it is thrown, and that sideways motion is part of its energy. The radial throw has to supply only the rest. Below 10.748 km/s the material is bound and comes back; above it, it leaves.
The same sideways speed explains why the material lands to the west (§K.1). Thrown straight up, it keeps the sideways speed it had on the surface; but as it rises, that speed carries it through a smaller angle per second than the surface turns, because the same speed at a larger radius covers a smaller angle — a child who walks outward on a turning roundabout falls behind the boards beneath her. When the material comes down, the ground beneath it has moved on eastward, and the landing lies west of the opening: about 1,032 km west for a throw at 5 km/s, after 28 minutes in the air. Energy conservation also gives the return speed: with no drag and a field that has not changed, material coming back to the radius it left has the same total energy and the same sideways speed, so its radial speed is again , and relative to the turning surface it lands at the speed it was thrown.
Remaining gravitationally bound to the Earth does not guarantee a landing on the shell. Material can land on another region, be swallowed by the parent or be altered on encountering the developing body. For a bound component in a central field, a general and broader bound on the relative velocity is:
In words: a body still bound to the field can at a radius move no faster than the escape speed at that radius, ; the surface it lands on moves at ; and the largest possible closing speed is the sum of the two, as when two cars meet head-on. The bound is not necessarily attainable in a particular ejection geometry. The old shock ceilings of 113 or 97 GPa are not ceilings for all material originating in the Earth–Moon system. They depended on the family of paths and the material chosen, and in part lay beyond the range of the shock approximation. A sample above such a number therefore does not by itself set aside every terrestrial source.
The Hill radius is a dynamical scale, not a boundary at which the Moon’s gravity vanishes. It is the distance from a small body within which its own pull on a nearby particle outweighs the tidal pull of the larger body it orbits; inside it, the small body holds its own material, and outside it the larger body takes over. In the late reference of 17,631 km, with the full lunar mass and a body density of 2,600, one obtains km and a body radius of about 1,890 km. A fall from rest from in the lunar gravity alone gives about 1.31 km/s, but this is a limited computational experiment and not a ceiling for a returning body already in motion. This comparison concerns a later state and cannot be combined with the early field used in the tables as though both described the same state.
What we now have: a throw at a few kilometres per second needs per kilogram at the opening, supplied by the pressure from the Earth with the volatiles assisting; the material returns at the speed it was thrown, lands west of its opening, and, landing on basalt, produces a contact pressure of tens of gigapascals; the vapour can halve that speed, so the size of the returning body and the gas content enter the test together; and every throw below about 10.748 km/s stays bound. Part K computes the flights.
The geometry
where the returning material lands is set by the flight and the turning surface. The approach: the flights from the parent and from the body are computed and their landings mapped.
Part J asked how much energy the material carried as it left an opening, and what shock it could produce on landing. This Part asks the next question: once the material is in flight, where does it come down, and at what speed relative to the ground it lands on? The answer depends on two things only: the flight itself, set by the ejection speed and the gravity of the parent, and the motion of the surface beneath it, which keeps turning while the material is in the air. We take three cases in turn. Material that leaves the parent’s shell and falls back onto the same shell (§K.1); material that leaves the parent and lands on a surface higher up, such as the rising dome or the developing body (§K.2), with what that does and does not say about a trend of shock in time (§K.3); and material thrown by the body itself, once it had risen, that falls back on the body (§K.4). The last case is the one that sets the longitudes: it explains why the trailing half of the Moon, centred on 90°E, is the most crowded with craters, and why the leading half, centred on 90°W, is the one on which the craters landed hardest.
K.1 Return to the shell at the same altitude
The question here is simple: material is thrown straight up from the equator of the turning parent and comes back down to the same height. How fast does it hit the ground, and where?
Denote , the angular speed of the surface, where is the rotation period (5.5 hours in the example; see the environment table). Material ejected radially from the surface, straight up, also has an initial tangential velocity : the sideways speed it shared with the turning ground at the moment it left, being the radius of the ejection point. Two quantities stay fixed during a flight in a field that does not change and without air drag. The first is the energy per unit mass, : the kinetic energy of the radial and tangential motion together, minus the depth of the gravity well, , where is the gravitational constant times the early mass of the parent. The second is the angular momentum per unit mass, : the tangential speed times the distance from the centre, which measures how much “turning” the material carries with it. In an inertial frame — one that does not turn with the surface — they are:
Here is the ejection speed, measured relative to the ground. On return to the same radius, under the assumptions of a fixed field and no drag, both quantities have their starting values. Because the angular momentum is the same and the radius is the same, the tangential velocity is again ; because the energy is the same and the depth of the gravity well is the same, the total speed is the same, and so the radial velocity is : the same size as at ejection, now pointing down. A surface rotating at the same rate moves tangentially at the same velocity, so the sideways motions of the material and of the ground cancel, and only the radial part is left. Therefore:
In words: material that falls back to the height it left lands at the speed it was thrown, whatever the rotation. This matters because it ties the landing speed, and through it the shock, directly to the ejection speed at the opening (Part J), with no gain or loss from the flight.
The equation describes a real landing on a continuous spherical surface in the model. It does not establish that the material landed on the part of the shell that would rise with the dome; establishing that requires a map of the openings and the shell. The landing distance below is the relative displacement along the equator.
The table follows four flights, from 2 to 8 km/s. Read each row from left to right: how high the material rose, how long it was in the air, how far west of its starting point it came down, and how fast it landed. The last column repeats the first, which is equation (11). The other columns grow much faster than the speed: raising the speed from 2 to 5 km/s raises the peak almost eightfold (251 to 1,932 km), and at 8 km/s the material rises higher than the radius of the parent itself (8,684 km against km) and stays aloft for more than an hour and a half.
|
, km/s |
Peak height above the ejection radius, km | Return time, minutes | Westward displacement on the surface, km | , km/s |
|---|---|---|---|---|
| 2 | 251 | 8.46 | 51.7 | 2 |
| 3 | 591 | 13.50 | 184.1 | 3 |
| 5 | 1,932 | 28.01 | 1,031.6 | 5 |
| 8 | 8,684 | 97.28 | 8,438.7 | 8 |
The material moves in the direction of rotation in the inertial frame, but the surface advances further during its flight. The reason is the angular momentum. As the material rises, its distance from the centre grows while its angular momentum stays fixed, so it turns more slowly about the centre than the ground below, which keeps turning at . A skater who extends her arms slows her spin in the same way. When the material comes down, the ground has moved on to the east, and the material lands to the west of where it left. The westward displacement is a property of the flight, not a motion of the shell.
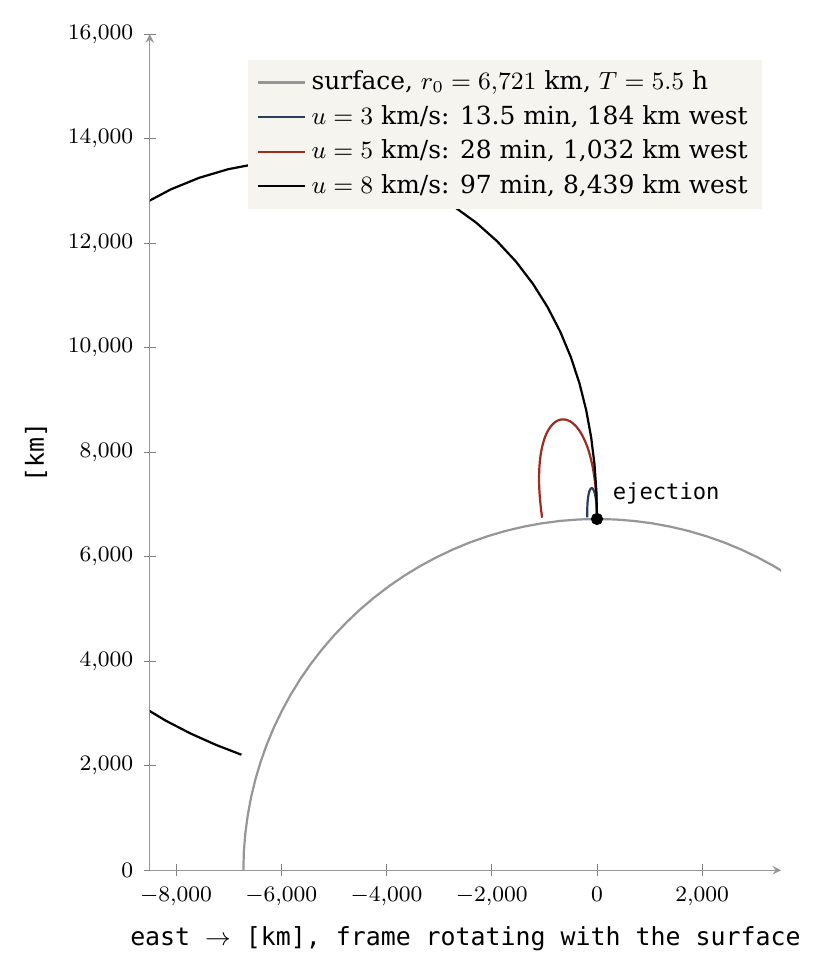
Figure 9 shows the same four flights as seen by an observer standing on the turning surface. The large arc is the surface, the dot the point of ejection. Each curve rises, bends to the west (to the left) and falls back to the surface; the higher and longer the flight, the further west it lands. The 8 km/s flight, in black, rises furthest and lands more than 8,000 km to the west.
The body’s own ejecta. The flights above start on the parent. The body, once risen, threw material from its own openings as well; where that material fell back on it, and how hard, made its leading and trailing halves different. That record is the subject of Parts F–I and §K.4.
What we now have: on the parent’s shell, landing speed equals ejection speed, and the landing point lies to the west of the opening by a distance that grows quickly with speed.
K.2Landing on a higher target
The next case is material that does not fall back to its own height but lands on a surface higher up — the flank of the rising dome, or the developing body above it. Such a target is taken to turn with the parent (to corotate), so it moves sideways faster than the ground beneath it, in proportion to its distance from the centre. The question is how fast the material meets it.
At distance , the radial velocity and the velocity relative to the corotating target are:
The first expression is the energy budget at height : the total energy, plus the depth of the gravity well there, gives the kinetic energy available, and the part tied up in sideways motion, , is subtracted, leaving the up-and-down motion. The second adds two parts at right angles: the radial speed, and the difference between the material’s sideways speed, , and the target’s, . At the second part vanishes and , which is equation (11) again. Higher up, the material moves sideways more slowly than the target, and this difference is part of the landing speed: the target sweeps into the material from the side.
and an encounter between the material’s path and the target in time and place are required. Reaching the target radius alone is not a landing on a small body or a bulge: the material must also be at the place where the target is when it arrives. The radial reach threshold, found by setting at the target radius — the speed that just brings the material up to that height — is:
The first term is the cost of climbing out of the gravity well from to ; the second, which is negative, is the help the material gets from the sideways motion it carries from the turning surface.
The table gives, for three target radii, the minimum ejection speed needed to reach them, and the landing speed relative to the target for ejection at 5 and 8 km/s. Two things can be read from it. First, a flight at 5 km/s reaches 8,000 km (where 4.226 km/s is enough) but not 10,000 km (where 6.072 km/s is needed). Second, for the flight at 8 km/s, the landing speed falls as the target is placed higher: from 6.834 to 5.491 to 4.597 km/s, always below the 8 km/s of a return to the same height.
|
Target radius, km |
, km/s | for | for |
|---|---|---|---|
| 8,000 | 4.226 | 2.775 | 6.834 |
| 10,000 | 6.072 | does not reach | 5.491 |
| 12,000 | 7.050 | does not reach | 4.597 |
The radii are test surfaces; they are not five dated construction stages and are not distances of the Moon’s centre. For a developed spherical target, the distances from the Earth to the near and far surfaces differ from the centre-to-centre distance by , the radius of the body. At this stage the gravity of the developing body and the shape of the connection are also required.
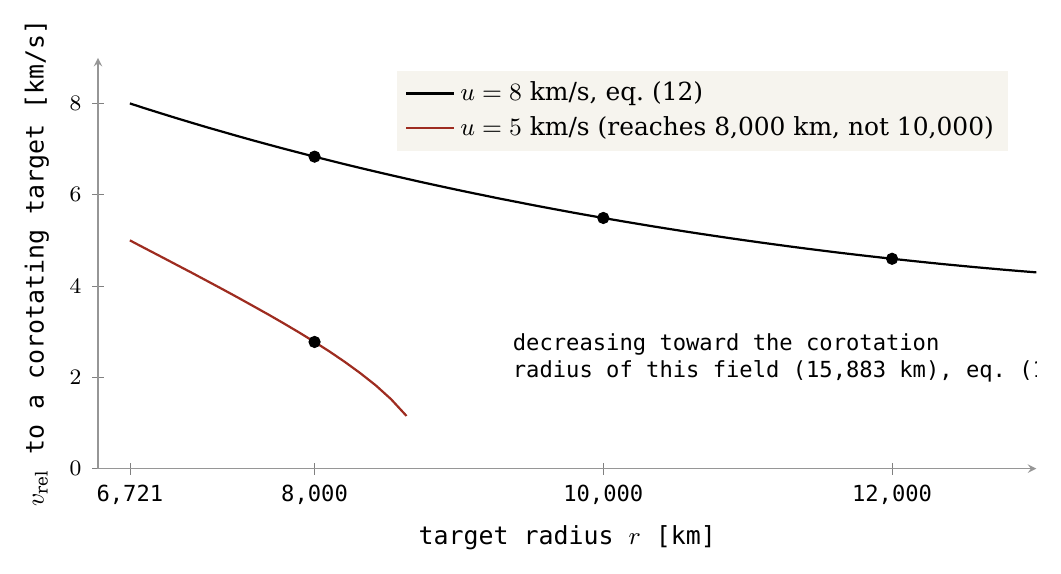
Figure 10 draws the same calculation continuously. The horizontal axis is the radius of the target, from the ejection radius of 6,721 km outward; the vertical axis is the landing speed relative to it. Both curves start at their ejection speed, as equation (11) requires, and fall as the target is placed higher. The red curve, for 5 km/s, ends where the flight reaches its peak height of 1,932 km above the ejection radius (§K.1): beyond that the material does not arrive. The dots mark the values of the table.
K.3The shock trend is path-conditional
Figure 10 invites a reading in time: as the target rose, landings became softer, so the shock recorded in samples should fall with time. This section states when that reading holds and when it does not.
For the same source, constant ejection velocity, constant and constant , equation (12) gives:
The equation compares two accelerations at radius : the outward pull felt by a body turning with the parent, , and the inward pull of gravity, . Below the radius where the two are equal, gravity wins and the landing speed falls with height; above it, the turning wins and the landing speed rises. That radius is the corotation radius: the distance at which a body turning once with the parent is in a free orbit, held neither down by gravity nor flung outward. The relative velocity decreases up to the model’s corotation radius, and increases beyond it if the material arrives and the target is still corotating. In the early-stage data here this radius is about 15,883 km, because the mass is . It does not replace the 15,818 km reference of Paper 2, which uses a different mass definition. All the target radii of §K.2 lie well inside it, which is why every curve of Figure 10 falls.
This is a relation between altitude and velocity in the same example. Turning it into a shock trend in time requires knowing how the ejection velocity, the rotation, the target position, the landing angle and the material change. On return to the same altitude equation (11) results. The rise of another body does not require a decreasing trend in that same-altitude return velocity: material that falls back to its own shell lands at its ejection speed no matter how high a second body stands. A shock trend by sample depth also requires identification of layers and events: folding, excavation and repeated landings can obscure the original sequence, as a pile of papers shuffled and restacked no longer shows the order in which they were written. There is no binding prediction here of 102→86 GPa (a fall in the shock pressure, the pressure in the shock wave of a landing, which minerals record), and no proof that an asteroidal source cannot show a change in time. The decline of Figure 10 is a property of one path; whether it became a trend in time is a matter for the record, not for this equation.
K.4Where the body’s own ejecta land
Sections K.1–K.3 dealt with material thrown by the parent. This section turns to material thrown by the body itself, and shows how it sets the pattern of craters by longitude that Parts C and F–I measure.
The flights of Parts J–K start on the parent. Once the body had risen on the connection, its own openings — its maria — threw material as well, most of it from near its equator. That ejection was neither strong nor far. Material thrown from the body at its own escape speed or less — about 2.0 km/s at 1,300 kg/m³ and 2.3 km/s at release — falls back on it, and the turning of the attached body decides where it falls and how hard. (The escape speed is the speed at which material leaves a body for good; below it, the body’s gravity brings the material back. These speeds are a few times smaller than the 5–8 km/s flights of §K.1, so the body’s ejecta stayed close to home.)
The series follows the standard convention: the leading half of the Moon, the half that faces its orbital motion, is centred on 90°W; the trailing half on 90°E. The convention rests on synchronous turning: the Moon turns once about its axis in the time it takes to go once around the Earth, so the same face always points to the Earth (the near side, centred on 0°), the opposite face always points away (the far side, 180°), one limb always faces forward along the path, and the other always faces backward. The attached body turned in the same way, carried round with the Earth, and had the same four faces.
The body turned with the Earth. Material thrown up from the trailing half comes down while that half moves away from it: it catches up with the ground from behind, and lands gently. Material thrown up from the leading half comes down while that half moves on into it: the ground runs into the falling material, and the landing is hard. The difference lies in the landing speed, which is always the speed of the material relative to the ground it meets. When the ground moves away from the falling material, the ground’s motion is taken from that speed; when the ground moves toward it, the two add. A ball caught while the hand draws back lands softly in it; the same ball caught while the hand pushes forward strikes it. Material thrown from the far side lags a little behind the turn and drifts toward 90°E — the westward lag of §K.1, which from 180° points toward the trailing half:
| Thrown from | What brings it back | Lands | Landing |
|---|---|---|---|
| 180°, the far side, near the equator | gravity; it lags a little behind the turn | 170°E if near, 100°E if far | hardest (§I.1) |
| 90°E, the trailing half | gravity alone; the body moves away from it | back on 90°E | soft |
| 90°W, the leading half | gravity, and the body moving on to meet it | back on 90°W | hard |
The table reads row by row: where the material was thrown from, what brings it back, where it lands, and how hard. Its colours follow those of the count in §C.3: orange for the trailing half, where the material lands softly and the craters gather, green for the leading half, where it lands hard. Far-side material near the body lands close to its source (about 170°E); material that travels further drifts as far as 100°E, close to the centre of the trailing half. Its landing is the hardest of the three, for the reason given below.
Two predictions follow. The trailing half collects its own ejecta and those that drift from the far side, and so holds the most craters (§C.3). The leading half meets its ejecta head-on, and so is the half landed on hardest: its craters should carry the marks of a hard landing (§F.1–L.4). The far side’s landings were harder still, the hardest of all, made while the body was attached, under the combined pull of the Moon and the Earth (§G.2, §I.1). The near side stands apart from both: it lies by the large maria, and its craters were shaped from below by them as well (§G.1).
The first prediction is tested by a count in §C.3. In plain words, the test asks whether the excess at 90°E could be an accident of counting: a crater count scatters by about its square root, so two regions can differ by chance alone. The ratio of trailing to leading density there is 1.79, and the range within which it lies with 95% confidence, 1.56–2.05, stays well above one, the value of no difference; resampling whole cells of the map rather than single craters, to allow for craters that cluster, gives the same answer. The second prediction is tested by the shape of the craters in Parts F–I. What we now have is the geometry behind both: soft landings and crowding behind, hard landings in front.
The chemistry
the material of a crater tells where it came from. The approach: iron, titanium and thorium are read around the maria and inside the craters, and the foreign mass of the literature’s reading is measured against what the crust holds.
Parts C to K read the craters by their number, their place and their shape. This Part reads what they are made of. The shape of a crater records how the returning material landed; its chemistry records where that material came from. Four questions are asked in turn. Did the material around each mare come from that mare (§L.1–L.3)? Is the inside of a crater one material, or layers dug from below (§L.4)? Did a body from outside leave its mass in the craters, as the impact reading of the literature requires (§L.5)? And what was the material that kept arriving from the Earth after release made of, and where did it fall (§L.6–L.7)? The chemistry of the floors of the large craters on the basalt is read with the floors themselves, in §G.3: the floors that froze high stood up while they were still rich in volatiles, which carried the light material up with them, and they are poorer in iron than the floors that sank back to the level of the ground and settled with the heavier material.
Each kind of element answers a different one of these questions:
| Element | What it marks | What it tells here |
|---|---|---|
| Iron and titanium (FeO, TiO) | The material of the maria, which is rich in both | How far each mare threw its material, and whether the craters carry it (§L.1, §L.2, §L.4, §L.6) |
| Thorium | An element that stays in the last liquid of a cooling melt and is brought up with deep material | The halo of a mare, read at a coarse scale (§L.3) |
| Siderophile elements | Metal, which carries them; a body from outside brings them | Whether a foreign body left its mass in the craters (§L.5) |
| Isotopes of ruthenium | The part of the solar system where the material formed | Whose siderophile elements the craters carry: a foreign body’s or the Earth’s (§L.5) |
Iron and titanium are given as the weight of their oxides, FeO and TiO, in percent of the weight of the ground (wt%): 6.9 wt% FeO means 6.9 grams of iron oxide in every 100 grams of surface material. Thorium is far rarer and is given in parts per million (ppm), grams in a tonne. Three maps from orbit are used throughout. The Kaguya Multiband Imager [S10], a camera on the Japanese Kaguya orbiter, measured the light reflected by the surface in several colours, from which the iron and titanium are computed at about 240 m per pixel. Lunar Prospector, a NASA orbiter, counted the gamma rays given off by thorium; its map is smoothed over about 60 km. The LROC mare map is the outline of every basalt unit mapped by the Lunar Reconnaissance Orbiter Camera; it is used to remove the basalt from a measurement wherever the ground and not the mare is to be read.
L.1Mare material in rings around the mare
This section carries out the source test stated in §C.5. The model holds that the maria are the openings from which the returning material was thrown (§C.1): most of the craters near a mare were made by that mare. If so, what a mare threw should be found on the ground around it, most near it and less farther out, as the ash of a chimney lies thickest next to the chimney. The literature holds instead that the craters were dug by bodies from outside, which have nothing to do with the maria; in that reading the ground near a mare is enriched only where later craters mixed a little of the mare sideways into it, a few kilometres to some tens of kilometres [S26]. The two readings therefore part on the reach: a mare that threw its own material reaches far; sideways mixing does not.
The ground is read in rings: bands at a set distance from the mare edge, 0–25 km, 25–50 km and outward to 300–600 km. In each ring, craters of 5–60 km were chosen, and the ground around each crater was read at 3–4 crater radii from its centre. That distance lies beyond the crater’s own ejecta blanket, the material it threw out, which reaches to about 2 radii; so what is read is the ground the crater landed on. Every pixel of mapped basalt is removed, so that what is measured is the land around the mare and not lava that spread over it. The controls are craters of the same sizes more than 600 km from any mare: their ground is the level of the highland where no mare reached.
The main result: mare material in rings around the mare. The point of the test is the ground around each mare, read ring by ring outward. If the mare threw its material around it, the heavy elements of the mare — iron and titanium — must be found in a ring around it, and less of them the farther the ring. They are. Around the six maria, pooled, the iron of the ground (3–4 crater radii, basalt removed) falls from 6.9 wt% at 0–25 km to 3.1 at 100–150 km, and then holds at 3.3–3.4 out to 600 km, 1.1 wt% above the controls; the titanium falls from 0.90 to 0.51, against 0.46 in the controls (Table, Figure 11). In plain numbers: the ground next to a mare holds three times the iron of the far highland (6.9 against 2.3), and even 300–600 km away it still holds about one and a half times as much. Around Smythii and Moscoviense the iron falls by half within 50–100 km; around Crisium it stays near 4 wt% out to 300 km. The two exceptions are in the iron alone and far from the mare: beyond 150 km the ground southwest of Nectaris rises again, toward the iron-rich southern highlands of the near side, while its titanium stays flat; Moscoviense, on the far side, is a small mare whose ring reaches the far-side level, 2 wt%, within 100 km. In both exceptions the titanium, or the iron near the mare, still falls as expected; what departs is the far ring, where the ground beyond the reach of the mare has its own level. The plains are read apart. In the model a plain — Procellarum, Tranquillitatis, Fecunditatis — is not an opening over a feed dome but crust melted in place (Paper 5, §C.2); it had no throat, and it threw nothing and spilled nothing. It is the maria — apart from the maria of the contact — that spilled their melt over their margins, in addition to throwing out large material. Around Procellarum, the largest plain, the iron falls from 10.9 to 2.4 wt%, the level of the controls, at 300–600 km — a short reach, not the reach of a throw; Tranquillitatis and Fecunditatis lie among other basalt and stay high.
Why the iron is highest at the rim. A mare sealed — its surface froze and kept the composition it then had — at the concentration it had reached at the end, about 17 wt% FeO. The ground around it was sealed earlier, while the mare was poorer. In the first stage the mixed material of the mare flowed out over long distances: light material and volatiles tend to float, and being more fluid they ran far. As the light material left, the mare concentrated in iron and its viscosity — its resistance to flow, the property that makes honey slower than water — rose, and what it threw ran shorter distances. A sauce reducing on the stove behaves in the same way: while it is thin it splashes far from the pot; as it thickens, what leaves it drops beside the pot. The ground far from the mare was therefore sealed low in iron, and the ground near it high. The same history dates the craters and the maria: near a mare, old craters carry less iron than new ones — though most new craters are small, made by volatiles, and carry the lighter material — and a mare rich in iron was concentrated longer and sealed late, a mare poor in iron sealed early, without a strong concentrating mechanism.
| Ground around the crater, FeO/TiO (wt%) | 0–25 km | 25–50 | 50–100 | 100–150 | 150–300 | 300–600 |
|---|---|---|---|---|---|---|
| The maria | ||||||
| Smythii | 7.8/1.25 | 5.8/0.92 | 3.6/0.72 | 3.2/0.64 | 3.4/0.57 | 3.5/0.62 |
| Imbrium | 10.8/1.07 | 9.8/0.97 | 9.6/0.78 | — | — | — |
| Serenitatis | 8.0/1.31 | 7.0/0.67 | 6.7/0.68 | — | — | — |
| Crisium | 4.7/0.72 | 4.1/0.60 | 4.2/0.53 | 4.0/0.49 | 4.4/0.43 | 3.4/0.43 |
| Moscoviense | 7.3/1.00 | 3.2/0.61 | 2.4/0.48 | 1.9/0.47 | 2.1/0.48 | 2.3/0.46 |
| Nectaris | 5.2/0.84 | 4.6/0.79 | 4.1/0.72 | 4.1/0.65 | 4.5/0.65 | 6.0/0.67 |
| Six maria pooled | 6.9/0.90 | 5.1/0.75 | 3.9/0.61 | 3.1/0.53 | 3.3/0.53 | 3.4/0.51 |
| The plains | ||||||
| Tranquillitatis | 8.6/1.24 | 7.7/1.12 | 6.8/1.03 | 5.8/0.84 | 5.0/0.81 | 4.5/0.78 |
| Fecunditatis | 9.4/1.12 | 7.9/0.93 | 7.3/0.83 | 6.8/0.74 | 6.4/0.73 | 6.3/0.64 |
| Procellarum | 10.9/1.12 | 8.8/0.84 | 6.5/0.69 | 4.7/0.58 | 3.2/0.49 | 2.4/0.39 |
Medians of the ground at 3–4 crater radii, mapped mare pixels removed, for target craters of 5–60 km assigned to their nearest mare; rings with fewer than 10 craters are left blank. Far controls (600 km from any mare): 2.3/0.46. The colour fades with distance.
Each cell gives iron and titanium, FeO/TiO, in the ring of its column. The table is read along each row, from the nearest ring on the left to the farthest on the right; the orange fades as the distance grows, and in the rows of the maria the values fade with it. The bold row, the six maria pooled, is the main result, and it is read against the controls in the note below the table, 2.3/0.46. The plains are left uncoloured because they are read apart: Procellarum is the one that falls all the way to the controls. The dashes mark the far rings around Imbrium and Serenitatis, which hold too few craters to read, since the ground there lies among other basalt.
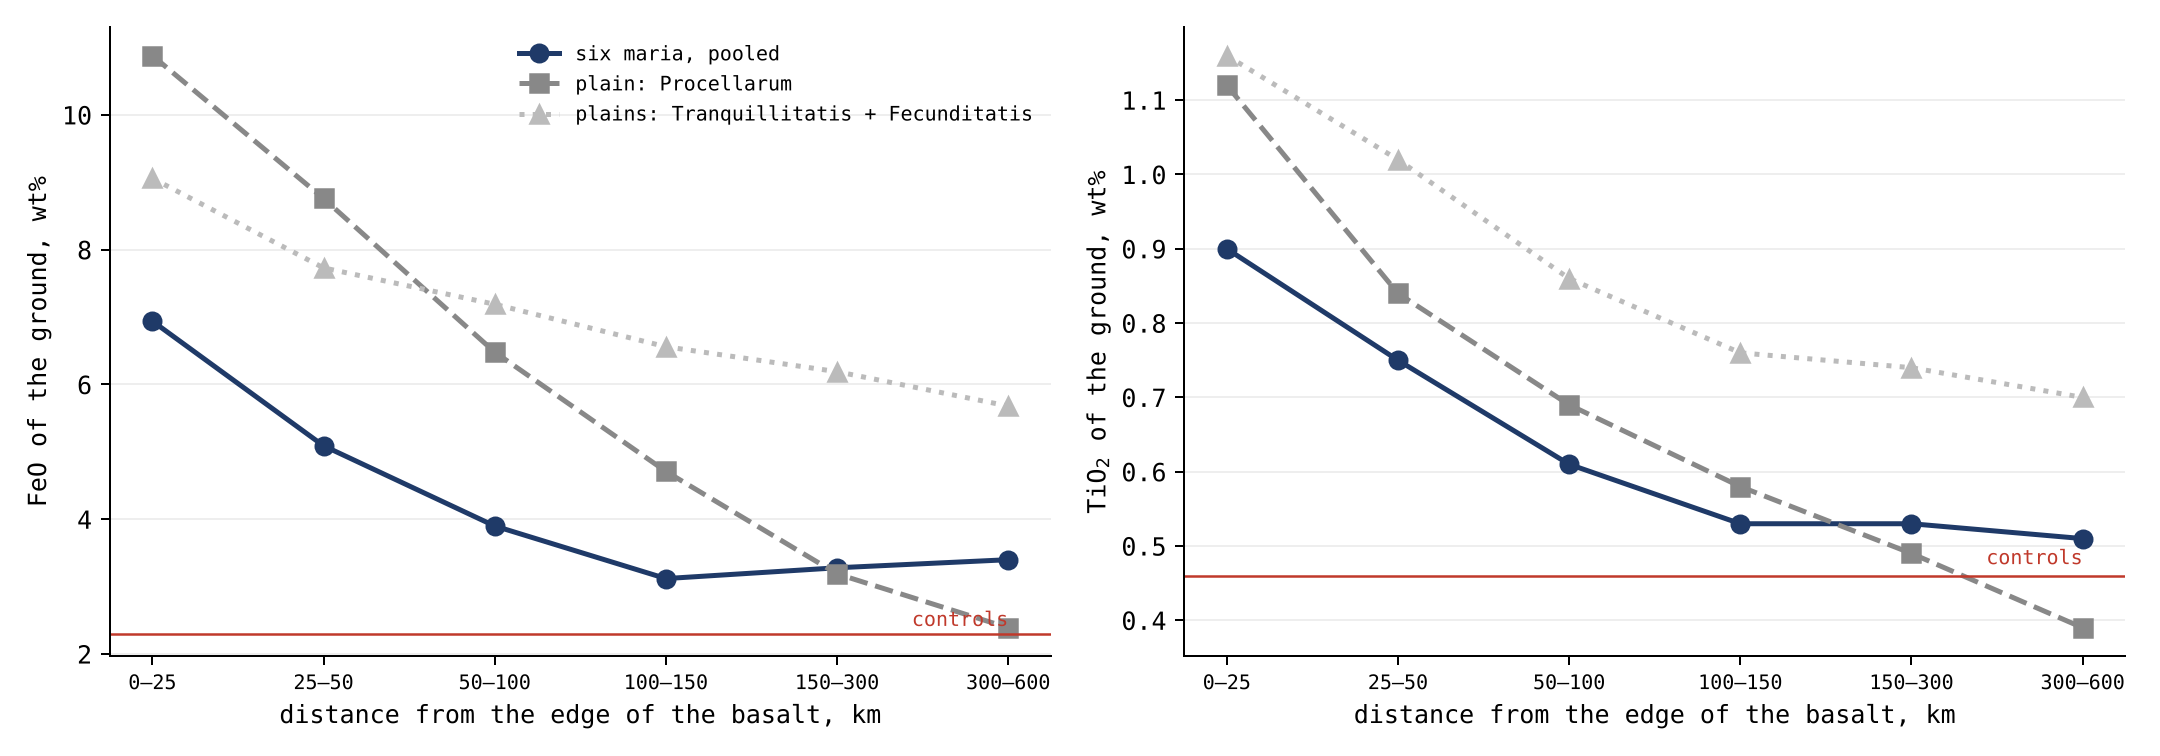
Figure 11 draws the same values as curves against distance. The curves of the maria fall steeply over the first 100 km and then level off above the controls; the curve of Procellarum keeps falling until it meets them. The level part of the maria’s curves, above the controls out to 600 km, is the reach that sideways mixing by later craters cannot supply.
Two readings follow. Around every mare the ground carries the mare’s iron, fading with distance: the ground within 50 km of a mare holds two and a half times the iron of the far controls, and an excess remains out to 600 km. This is the criterion of §O.1, and it is met: the craters near a mare carry more of its signature than craters far from it. It is what the model expects of maria that threw their material around them. And the crater is poorer than its own surroundings — by a little, but at every distance and in the same direction: , , and wt% FeO from the nearest ring to the farthest, against in the controls, far from any mare. These four values are the crater interior minus its own ground, in the four distance bands of the table of §C.5 (0–50, 50–150, 150–300 and 300–600 km). The difference is small, but its sign is the point: near a mare the crater is always a little poorer than the ground it sits in, and far from any mare it is not. What this difference measures, and how the model reads it, is the subject of §L.2.
So far: the ground around every mare carries the mare’s iron and titanium, most near it and an excess to 600 km, and beside the plains, which threw nothing and spilled nothing, the iron falls to the controls within a few hundred kilometres.
The phenomenon. The ground around a mare is darker and richer in iron than the highlands far from it. The gap in knowledge. The literature explains the halo as mare material mixed sideways into the highland by later cratering; the model says the mare threw its own material onto the ground around it, and that material made the craters there (§C.1, §C.5). If the mare is the source, its signature must fall off with distance from it, around every mare, and the craters near it must carry that signature. The research question: do the iron, titanium and thorium of the ground and of the craters around a mare fall off with the distance from it, around every mare, and how far does the mare’s signature reach?
Compositional gradients across the contacts between mare and highland are known from orbital spectra, and are read as lateral transport by later cratering, which carries mare material a few kilometres to some tens of kilometres into the highland [S26]. In that reading each later crater throws a little of the mare a short way, and many such throws spread it; the reach is set by how far a crater throws, which is short. Iron and titanium are read from the Kaguya Multiband Imager [S10], thorium from Lunar Prospector. What is new here: craters around six maria and three plains are chosen before any chemistry is read, the maria being the openings over feed domes of Paper 5, the ground is read ring by ring out to 600 km, and matched controls far from any mare give the baseline.
Around every mare the iron and titanium of the ground are highest next to the mare and fall outward, beyond the few tens of kilometres that lateral mixing explains; the craters within the mare’s reach carry its signature, and those far away do not. A plain threw nothing and spilled nothing, so the excess beside a plain falls to the level of the controls within a few hundred kilometres; the maria, apart from those of the contact, spilled their melt over their margins as well as throwing out large material.
Type of research: quantitative, with a control group. The sample: 11,574 craters of 5–60 km outside the basalt, 5,840 around six maria (Crisium, Imbrium, Moscoviense, Nectaris, Serenitatis, Smythii) and 5,734 around three plains (Procellarum, Tranquillitatis, Fecunditatis); the control: 5,922 craters matched by size, more than 600 km from any basalt. Matching by size means that the control group holds craters of the same sizes in the same proportions, so that any difference cannot come from comparing large craters with small ones. The tools: Kaguya iron and titanium maps at full resolution, the Lunar Prospector thorium map, the LROC mare map, and code that reads each crater and its ground ring by ring.
| Choice | Why, in plain words |
|---|---|
| Craters chosen before the chemistry was read | So that the result cannot steer which craters are counted |
| The ground read at 3–4 crater radii, mare pixels removed | To read the ground the crater landed on, not the mare itself |
| Rings of distance from the mare edge | A source leaves its mark strongest close to it and weaker farther out |
| Controls far from any mare | To know the level of the ground that no mare reached |
The list of craters and controls was fixed and saved before any map was opened. Each crater was then read in its rings, and the ground around it outside the mare; the values are the tables of §C.5 and of this section.
The fall-off. Pooled over the six maria, the iron of the ground falls from 6.9 wt% at 0–25 km to 5.1, 3.9 and 3.1 at 100–150 km, and holds at 3.3 and 3.4 at 150–300 and 300–600 km, 1.1 wt% above the controls; the titanium falls from 0.90 to 0.51, against 0.46. The craters. Inside the craters the iron follows the ground ring by ring, 5.88 to 3.30 wt%, and each crater is a little poorer than its ground ( wt% within 50 km, 95% interval to ; in the controls). The 95% interval is the range within which the true value lies with 95% confidence, given the scatter of the craters measured; here it lies wholly below zero, so the crater being poorer than its ground is not an accident of the sample. Thorium. The ejecta around the maria carry 2.16 ppm within 50 km and 1.39 at 300–600 km, against 1.02 in the controls. The plains. Around Procellarum the iron falls to 2.4 wt%, the level of the controls, at 300–600 km; around all three plains, pooled, to 2.60, while around the maria it still holds 3.40.
Result. The hypothesis is supported: around every mare its signature is highest next to it and falls outward, and it reaches hundreds of kilometres, too far for sideways mixing alone; the maria are the source of the material around them. An excess that holds to 600 km is ten times and more the reach of sideways mixing by later craters. Beside the plains, which threw and spilled nothing, the excess falls to the controls. Limitations. The rings of neighbouring maria and plains overlap at large distances, so the far rings are not clean, and the two smaller plains lie among other basalt; the thorium map is coarse, about 60 km, and reads the region rather than the single crater; two exceptions in the iron (southwest of Nectaris and around Moscoviense) are explained by the ground beyond, not tested. Directions for further research. The same test with a thorium map of higher resolution, and a model of how far material thrown from a mare should fall, set against the measured reach.
L.2The crater and its ground
§L.1 found that the ground near a mare carries the mare’s iron, and that the crater sitting in that ground is a little poorer than it. This section states what was measured, what the measurement shows, and how the model reads it.
What is measured. The Kaguya Multiband Imager reads the light reflected by the uppermost surface layer, and from it gives a concentration: the weight of FeO in every 100 grams of that layer (wt%). It gives neither an amount of material nor the depth to which the material reaches. The crater interior and the ground at 3–4 crater radii are read on the same maps, at the same resolution and in the same unit, crater by crater, each crater against its own ground. The comparison is therefore like-for-like: two concentrations of the same surface layer, one inside the crater and one on the ground around it.
What it shows. Around the six maria the crater interior is a little poorer in iron than its own ground at every distance band: , , and wt% FeO at 0–50, 50–150, 150–300 and 300–600 km (§C.5). Within 50 km the 95% interval, to , lies wholly below zero. In the far controls, more than 600 km from any mare, the difference is . The difference is small — a few tenths of a percent against the 5.96 wt% of the ground within 50 km — and its sign is the point: near a mare the crater is a little poorer than its ground, far from any mare it is not. It does not change the main result of §L.1, the fall-off of the mare’s signature with distance: inside the craters the iron follows the ground ring by ring, from 5.88 to 3.30 wt%, and the small step between crater and ground rides on that fall-off without altering it.
How the model reads it. We propose that the difference belongs to the same history as the fall-off (§L.1, Why the iron is highest at the rim). The ground around a mare was sealed step by step as the mare concentrated in iron, so what a surface holds depends on when it was sealed. Near a mare, old craters carry less iron than new ones, though most new craters are small, made by volatiles, and carry the lighter material. The floor of a crater is the ground the material landed on — its layers — and the crater interior records the material and the layer of its own time. This reading is to be tested by dividing the craters near each mare into age classes and comparing the difference from the ground class by class: the older craters should carry the larger deficit.
L.3Thorium and the returning material
Thorium and the returning material. Thorium is the third element of the source test. It does not fit into the crystals of the common minerals, so it stays in the last liquid of a cooling melt, and in the series it marks the contact with the Earth, where the Moon last touched it (Paper 5, §J.3). Around the maria the thorium of the ejecta also falls with distance, from 2.16 ppm within 50 km to 1.39 at 300–600 km, against 1.02 in the controls (Study 2). But thorium is a regional value: the Lunar Prospector map is smoothed over about 60 km, larger than every crater measured, so it shows the halo of the mare but does not separate a crater from its surroundings. A crater of 20 km on this map is like a face in a photograph taken badly out of focus: the colour of the scene shows, but not the face. The share of the returning material itself is not identifiable from these maps. The next step is set in Paper 12 (research topics): a measure that sees the returning material — melt and glass in the crater, the crater’s interior read zone by zone, or a higher-resolution thorium — in place of the ground.
L.4The inside of the crater
§L.2 compared the crater with the ground around it. This section looks inside the crater itself. The question it answers is what fills a crater: in the literature, a crater is a hole dug through layers, and its peak and walls expose the deeper ones; in the model, a crater is the place where returning material landed, and it is filled with that material. The two readings predict different things for the inside. If the crater is a hole through layers, its centre, its walls and its rim should differ from one another and from the surface around it. If it is filled with the material that made it, spread through it, the inside should be one material.
The chemistry inside a crater shows what fills it. The craters of 10–60 km within 150 km of a mare edge, 7,227 of them, were chosen and frozen before any chemistry was read, and each was divided into six rings: the centre (out to 0.3 of the radius), the floor (0.3–0.7), the inner wall (0.7–0.95), the rim (0.95–1.1), the ejecta (1.2–2 radii) and the surroundings (3–4 radii), mare pixels removed from the last two. Iron and titanium were read in each ring on the Kaguya Multiband Imager maps [S10] at their full resolution, about 240 m:
| Difference (wt%) | FeO | TiO |
|---|---|---|
| Centre minus inner wall | (0.06–0.10) | (0.058–0.063) |
| Centre minus floor | (0.09–0.12) | (0.019–0.022) |
| Centre minus rim | (–0.04) | (0.054–0.060) |
| Floor minus surroundings | (–0.03) | (–0.003) |
| Centre minus surroundings | (0.07–0.13) | (0.011–0.019) |
| Rim minus surroundings | (0.09–0.13) | (–) |
Each row subtracts one ring of the crater from another, for iron and for titanium, with its 95% interval in brackets. What matters is the size of the numbers: every difference is a tenth of a wt% or less. The green row is the key one: the floor of the crater and the ground around it carry the same iron and titanium to the second decimal.
The inside of a crater is one material. From the centre to the wall and onto the rim the iron changes by about a tenth of a percent, and the titanium by less — far below the calibration scatter of the maps themselves (0.81 wt% FeO, 0.43 wt% TiO). The calibration scatter is the uncertainty with which a value on the map stands for the true composition of the surface; a difference eight times smaller than it is no difference in material. The floor carries exactly the iron and titanium of the land around the crater. The returning material that made the crater spread through it evenly: it laid one composition from the centre to the rim, and the same as the ground it landed on.
A specialist reader will object that the central peaks of craters are used as windows into the deep crust, and that a crater ought to show the layers it cut. The measurement answers it for this sample: across 7,227 craters the centre, where the peak stands, differs from the wall by 0.08 wt% FeO and from the surroundings by 0.10, far inside the scatter of the maps. No layering is seen at the scale the maps resolve.
The two halves carry the same chemistry inside their craters. The model has the leading half, 90°W, landed on hardest and the trailing half, 90°E, landed on softest (§K.4, §C.5). The craters at 90°W and at 90°E were paired one to one by diameter (within 5%), and in a second test also by mare cover, by distance from the mare edge (within 25 km) and by latitude (within 10°): 1,214–1,235 pairs. Pairing one to one means that each crater of one half is set against a crater of the other half that is alike in everything but its longitude, so that any difference left belongs to the longitude. For each pair the difference between centre and surroundings was compared between the halves:
| Centre minus surroundings, 90°E minus 90°W (wt%) | FeO | TiO |
|---|---|---|
| Paired by diameter | (–0.10) | (–0.020) |
| Paired by diameter, mare edge and latitude | (–0.02) | (–0.003) |
The table gives, for each way of pairing, how much more (or less) the crater centre differs from its surroundings on the trailing half than on the leading half. A value of zero would mean that the two halves are alike; every interval in the table contains zero.
Every interval includes zero, in every ring of the crater. A hard landing at 90°W and a soft one at 90°E leave the same chemistry inside the crater, because the crater is filled with the returning material that made it. The strength of the landing shows in the shape — the peaks, the teeth of the rim, the roughness of the floor — and not in what lies in the crater. The caution of the source test (§C.1), that a hard landing might expose the ground below and a soft one leave the returning material on top, is so answered: on both halves the crater holds its own returning material.
So far: the inside of a crater is one material from centre to rim, the same as the ground it landed on, and the strength of the landing changed the shape of the crater but not what is in it.
The phenomenon. A crater can hold two materials: the ground it dug into and the material that made it. The gap in knowledge. Whether the inside of a crater differs from its rim and from the ground around it, and whether a hard landing at 90°W leaves a different chemistry inside the crater from a soft one at 90°E, has not been measured on thousands of craters ring by ring. The research question: does the iron and titanium change from the centre of a crater to its wall, its rim, its ejecta and the ground around it, and does it differ between the two halves for craters of the same size?
The central peaks and walls of craters are used as windows into the crust beneath, because, in the impact reading, the blow lifts deep material to the surface [S29]. Iron and titanium are read at about 240 m from the Kaguya Multiband Imager [S10]. In that reading the inside of a crater should show the layers it dug through, and differ from the surface around it. What is new here: every crater is divided into six rings read on the same maps, and the craters of the two halves are paired one to one by size, by mare cover, by distance from a mare and by latitude.
The crater is filled with the returning material that made it, spread evenly, so the inside of the crater is one material from centre to rim, the same as the ground it landed on; and the two halves carry the same chemistry inside their craters, since the strength of the landing changed the shape, not the material.
Type of research: quantitative, with paired comparison. The sample: 7,227 craters of 10–60 km within 150 km of a mare edge; for the halves, 1,214–1,235 pairs of craters at 90°W and 90°E. The tools: the Kaguya iron and titanium maps at full resolution, the LROC mare map, and code that reads six rings in each crater: the centre (to 0.3 of the radius), the floor (0.3–0.7), the inner wall (0.7–0.95), the rim (0.95–1.1), the ejecta (1.2–2 radii) and the surroundings (3–4 radii).
The craters and the pairs were chosen and saved before any chemistry was read. Each pair was matched within 5% in diameter, and in the second test also by mare cover, by distance from the mare edge within 25 km and by latitude within 10°. The values are the tables at the head of this section.
Within the crater. Each difference between rings is given with its 95% interval. From the centre to the wall and to the rim the iron changes by about a tenth of a per cent, the titanium by less; the floor minus the surroundings is 0.00 for iron (interval to ) and 0.000 for titanium. These differences are far below the calibration scatter of the maps themselves, 0.81 wt% FeO and 0.43 wt% TiO. Between the halves. For each pair the difference between centre and surroundings was compared between the halves. Every interval includes zero, in every ring, in both pairings.
Result. The hypothesis is supported: the inside of a crater is one material, the same as the ground it landed on, and a hard landing and a soft one leave the same chemistry inside the crater. Limitations. The sample lies near the maria, within 150 km of an edge, and does not cover the far highlands; the maps resolve about 240 m, so thin layers inside a crater are not separated; and the test reads iron and titanium, not thorium, whose map is too coarse for single craters. Directions for further research. The same rings far from any mare, and the same test with a thorium map of higher resolution (§L.3).
L.5The foreign mass that is not there
The sections so far asked where the material of the craters came from on the Moon. This section asks the question that separates the model most sharply from the literature: did anything come from outside?
If the craters of the Moon were made by external impacting bodies, the bodies brought their own mass, and part of it stayed. The literature reads that part in the highly siderophile elements — iridium, osmium, platinum, ruthenium — which the Moon’s own silicate almost lacks, since its differentiation sent them to the core, so that a small addition stands out at once. Siderophile means “iron-loving”: when a body melts and its metal sinks to form a core (its differentiation), these elements dissolve in the metal and go down with it, leaving the silicate shell almost without them. A body from outside of chondritic composition — the stony meteorites that never melted, with their metal still mixed through them — carries them at a far higher level. A little of such a body mixed into the crust is therefore seen at once, as a few drops of ink are seen in a glass of clear water. If the craters are of returned terrestrial material, as this paper proposes, there is no foreign mass to find: the returning material is of the same kind as the shell it landed on. The question is therefore a measurement: how much foreign mass the crater record requires, where it should lie, and what is found.
Behind the scenes. The test was first framed as a budget for the whole Moon, and on that scale a foreign mass is a small fraction of the lunar mass and says little. A mass that lands stays near the surface, so the comparison was moved to where it should lie, the upper crust. And since the presence of the siderophile elements alone does not tell where they came from — the Earth’s mantle carries them in chondritic proportions too — the isotopes of those elements were added as the deciding measure.
The isotopes are the fingerprint. Atoms of one element can differ in the number of neutrons in their nucleus; these forms are its isotopes. They behave alike in chemistry, so melting and mixing do not change their proportions, but the proportions differ slightly between the bodies that formed in different parts of the young solar system. Two samples can therefore hold the same amount of ruthenium and still tell, by its isotopes, whether it formed with the Earth or with a meteorite from elsewhere, as two people may say the same words in different accents.
Two chains of events.
| Step | The literature: an external impacting body | LEF: returned terrestrial material |
|---|---|---|
| The body | An asteroid or comet, of chondritic or other meteoritic composition, at 15–20 km/s | Material thrown from the Earth’s interior or from the body’s own openings, at 2–8 km/s |
| The crater | Most of the body melts or vaporises; part escapes the Moon | The material lands on a shell of the same kind and stays |
| What stays | On average about a fifth of the body [S12] | All of it, and it is not foreign |
| Where it lies | Mixed into the upper crust, and before about 4.35 Gyr lost to the core with its siderophile elements [S12] | In the layers of the shell, as the shell itself |
| The signature | An excess of siderophile elements of meteoritic isotopic composition | Siderophile elements of the Earth’s composition, in the proportions of terrestrial material at its stage of differentiation |
The table follows one crater through both readings, step by step. The left column is the literature’s chain; the right is the model’s. The last row is what can be measured today, and it is where the two part: an excess of foreign siderophile elements with a meteoritic fingerprint, against siderophile elements with the Earth’s fingerprint. The three tests below measure the amount (Tests 1 and 2) and the fingerprint (Test 3).
Test 1: the foreign mass the visible craters require. The size of the body behind each crater of the catalogue was computed from the scaling of Collins, Melosh and Marcus [S13], at 45°, for a body of 2,700 kg/m³ on a target of 2,800 kg/m³, with a transition to complex craters at 15–20 km, on all craters of 1 km and more (Wang & Wu [S16] for 1–20 km, Robbins [S6] for 20 km and more). A scaling law of this kind is the literature’s own rule for working back from the width of a crater to the size of the body that dug it, given its speed, its angle and the densities of body and target; complex craters, above 15–20 km, are those with central peaks and terraced walls, whose shape changes the rule. Using the literature’s rule means that the mass found is the mass the literature’s own reading requires:
| Craters | Number | Foreign mass at 18 km/s (kg) | Share |
|---|---|---|---|
| South Pole–Aitken | 1 | 68% | |
| Other basins, 300 km and more | 32 | 30% | |
| Craters of 20–300 km | 6,940 | 2% | |
| Craters of 1–20 km | 1,311,414 | 0.03% | |
| All |
The table sums the bodies by size of crater, at 18 km/s, near the middle of the 15–20 km/s of the literature. The red rows carry almost all the mass: one crater, South Pole–Aitken, needs two thirds of it, and the 32 other large basins nearly a third (an earlier version gave kg and a quarter). The 1.3 million small craters together need less than a thousandth. This is because the mass of a body grows with the cube of its size: one body hundreds of kilometres across outweighs a million bodies of a few hundred metres.
At 12–25 km/s the total ranges over kg. These are the craters seen today only; the literature’s own model of the bombardment, which includes the craters since erased, requires kg since 4.5 Gyr [S12].
Test 2: where it should lie, and what is there. A body that lands stays near the surface, so its remains should be in the upper crust; the layer used here is the upper 5 km. With the literature’s own retention — a fifth of the body on average, up to three fifths in earlier estimates [S12] — the visible craters alone leave kg of foreign material. Spread through the upper 5 km of the crust, that is 2–6% of it (an earlier version gave 2–5%); the literature’s whole bombardment, at a fifth retained, is 15%. What the crust holds is estimated from its siderophile elements at kg [S12] — 0.9–2% of the upper 5 km even if all of it lay there:
| Foreign material in the upper 5 km of the crust | Mass (kg) | Share of the layer |
|---|---|---|
| Required: the whole bombardment of the literature, a fifth retained | 15% | |
| Required: the visible craters only, a fifth to three fifths retained | 2–6% | |
| Found: all the crust’s siderophile elements, as if all in this layer | 0.9–2% |
The red rows are what the literature’s reading requires the layer to hold; the green row is what is found. The colour fades from the largest requirement to the measurement. The found row is generous to the literature: it places all the siderophile elements of the crust in this one layer, and still falls short.
The crust holds less than the visible craters alone require, by up to 6.7 times (an earlier version said “up to six times”), and a seventh to a sixteenth of what the literature’s bombardment requires (an earlier version gave a seventeenth). The literature closes the gap in two steps: a low retention, lowered from about three fifths to a fifth, and the loss to the core of everything that arrived before about 4.35 Gyr [S12]. Together they make some 93% of the delivered mass disappear. A body that made a crater cannot be wholly buried: if it landed on the ground, its remnants should stay at a level that can be measured, and the craters seen today were made on a crust already solid, whose siderophile elements could no longer sink to the core. The loss to the core can apply only to a Moon still molten; it cannot remove the remains of the craters that are still visible on its solid face.
Test 3: whose siderophile elements. The isotopes of ruthenium separate the reservoirs of the solar system — the regions of the young solar system whose bodies carry distinct fingerprints — and they have now been measured in lunar crater products: in an Apollo 16 sample and a lunar meteorite, the ruthenium that the impact reading assigns to a foreign (impactor) component is indistinguishable from that of the Earth’s silicate [S14]. The authors read it as bodies from the region that supplied the Earth’s late veneer — the small mass the Earth is held to have received after its core formed, which gave its mantle its siderophile elements — and ask for more samples. In the model it is read directly: the siderophile elements in the lunar craters are the Earth’s, because the material that made the craters was the Earth’s. The melts attributed to the body that made the Imbrium basin carry ratios of osmium, ruthenium, platinum and palladium that match no known group of chondrites [S15]; they are taken up with the basins of the maria in Paper 5. In the model they need no unknown body: they are terrestrial material at its own stage of differentiation.
The literature and the model, test by test.
| Test | Result | The literature reads | The model reads | Conclusion |
|---|---|---|---|---|
| Foreign mass for the visible craters | kg at 18 km/s; South Pole–Aitken 68% | The mass the bodies brought | No foreign mass: the material is terrestrial | The question is where it is |
| Foreign material in the upper 5 km | Required 2–6%; found 0.9–2% at most | Most of the body vaporised; a fifth retained | Nothing to retain | Less than required, up to 6.7 times |
| The whole bombardment | Required kg; crust and mantle hold | Low retention, and loss to the core before 4.35 Gyr: some 93% vanished | No missing mass to explain | The literature needs the mass to vanish; the model does not |
| Ruthenium isotopes of crater melts | As the Earth’s silicate [S14] | Bodies from the region of the Earth’s late veneer | The Earth’s own material | As the model predicts; two samples |
| Siderophile ratios of the Imbrium melts | Match no chondrite group [S15] | An unknown body, or metal of a planetesimal core | Known terrestrial material, at its stage of differentiation | Explained without a new kind of body |
| Fragments of foreign bodies | Single grains: a chondrule in Chang’e-5 [S17], CI-like relics in Chang’e-6 [S18] | Remnants of the impacting bodies | Space dust, in the small amounts the model allows | Amounts the model allows |
The table sets the literature’s reading and the model’s side by side for each test. The last column is shaded by how strongly the result favours the model: neutral for the first row, which only states the mass to be looked for, and deeper green where the literature needs an added assumption and the model does not. The last row is the fair objection: foreign grains have been found. They are single grains — a chondrule, a small round bead typical of chondrites, in the Chang’e-5 soil, and relics like the CI chondrites in the Chang’e-6 soil — the small amounts of space dust that fall on every surface, and not the mass the craters would require.
What follows. The crater record, read as external impacting bodies, requires a foreign mass the Moon does not hold, and the literature’s way out is to assume that most of it vanished. The siderophile elements that are found carry, where measured, the Earth’s isotopic composition. Both are what the model predicts: the craters are of returned terrestrial material, and there is no missing mass to explain. The test is stated in §O.1: the siderophile elements of the lunar crater melts carry, by their isotopes, the Earth’s composition, and any meteoritic part stays within what space dust supplies.
The phenomenon. The literature holds that the craters of the Moon were dug by bodies from outside. The gap in knowledge. A body that lands leaves part of its mass behind, and bodies from outside are rich in elements that the Moon’s crust lacks: the siderophile elements, such as iridium, osmium and ruthenium. The literature explains the small amount found by saying that most of it was vaporised or buried. How much foreign mass the visible craters require, and how much the crust actually holds, has not been set side by side. The research question: how much foreign material should the upper crust hold if the visible craters were made by bodies from outside, how much does it hold, and what do the isotopes of the crater melts say about where their siderophile elements came from?
The siderophile elements of the crust and mantle give the mass the Moon received after it formed, and the whole bombardment of the literature requires about kg [S12]. The mass of a body is found from the size of its crater by scaling laws [S13]. The ruthenium isotopes of lunar crater melts are like those of the Earth’s silicate [S14]; the siderophile ratios of the Imbrium melts match no group of chondrites [S15]; single grains of foreign bodies have been found in the soils of Chang’e-5 and Chang’e-6 [S17, S18]. What is new here: the mass required by the visible craters is computed crater by crater and compared with what the upper crust holds, layer by layer.
The craters are of returned terrestrial material, so the upper crust holds far less foreign mass than bodies from outside would have left, and the siderophile elements that are there carry the Earth’s isotopes.
Type of research: quantitative, by calculation against measured amounts, with a review of the isotope literature. The sample: every crater of 1 km and more, some 1.32 million (Wang & Wu [S16] for 1–20 km), with South Pole–Aitken and the large basins apart; the published siderophile and isotope data of lunar melts and soils. The tools: the scaling law of Collins, Melosh and Marcus [S13], which turns the size of a crater into the mass of the body that dug it, for a body of 2,700 kg/m on a target of 2,800 kg/m at 45° and 18 km/s; a retained fraction of one fifth [S12]; and the published siderophile budgets [S12].
The mass of the body was computed for every crater, summed by size and for South Pole–Aitken and the large basins apart. The siderophile budget of the crust and mantle, and the isotope data, were taken from the literature as published. The values are the tables of this section.
Test 1, the visible craters. They require – kg of foreign mass, of which South Pole–Aitken alone is 68%. Test 2, the upper 5 km. Spread through the upper crust, the retained fifth would be 2–6% of it; what is found, at most, is 0.9–2%. The whole bombardment. It requires kg; the crust and mantle together hold –, about a fifteenth. Test 3, the isotopes. The ruthenium of the crater melts is the Earth’s; the Imbrium melts match no chondrite.
Result. The hypothesis is supported: the crust holds a small part of the foreign mass the visible craters require, and the ruthenium of the crater melts is terrestrial; the literature’s answer, that the mass was vaporised or buried, must be assumed for every crater, while the model needs no assumption. Limitations. The mass computed rests on an assumed velocity, density and retained fraction, each uncertain by a factor of about two; the upper crust is sampled at few places; and single foreign grains are found, in the small amounts the model allows as space dust. Directions for further research. The siderophile elements and ruthenium isotopes of the melts of individual craters of known size, so that the retained mass of one crater can be weighed against what its size requires.
L.6The terrestrial material after release
The craters read so far were made while the Moon was still attached to the Earth, or by its own openings. This section turns to the craters made after release, and asks what the material that made them was.
At release the Moon was round, with a rigid outer shell; it had flattened and rounded again while it was still attached (Paper 7). The pear — the bulge of the Earth whose tip the Moon had been — was gathered back into the Earth by the sorting, slowly, over tens to hundreds of millions of years after release, leaving wrinkles on its surface (Paper 9). The Earth did not fall quiet: its openings went on throwing material, most of which fell back to it, and part of which reached the Moon and landed on it (§E.4).
The prediction. A mare is a cut through the layers of the tip of the pear. The middle of the cut holds the iron, and with it the thorium that came up from deep in the Earth; the spike that ran into the body may hold more of the light material. The material that the Earth went on throwing after release was another thing: the part of the Earth’s outflow that could escape it. The heavy material sank back down the pear toward the Earth, and the light rose (Paper 3, §C.10); what left the Earth and reached the Moon was the lighter part. Escaping the Earth was not easy: to reach the Moon the material had to leave the Earth’s surface at 8.8 km/s or more, rising toward the Earth’s escape speed as the Moon receded (§E.4). The craters made on the maria after release (Part E) were built of it. The model therefore predicts that the material of these craters — the ejecta, read apart from the mare floor they landed on — is poorer in iron than the mare, the richest in iron on the whole Moon.
What it shows. Material from the Earth landing on the Moon after release shows that the Earth stayed active after the Moon left it; the activity waned with time — the pieces that reached the Moon grew smaller, still hot (§E.4) — but it went on.
The phenomenon. The craters on the near-side basalt were made after release by material from the Earth — some while the floor was still hot (melted and raised), the sharp ones after it had frozen (Studies 5 and 9). The gap in knowledge. What that material is made of, against the mare it landed on, has not been measured crater by crater. The research question: is the material thrown out of the craters on the basalt poorer or richer in iron and thorium than the basalt around them, on the floors of the maria and on the plains?
Iron and titanium are read from the Kaguya Multiband Imager [S10], thorium from Lunar Prospector [S11]. In the literature the ejecta of a crater on a mare are the target it dug: the basalt, and the highland material beneath it where the crater reached through the basalt [S26]. Soils at the Apollo 12 site tied to the rays of Copernicus are rich in thorium and poorer in iron than the local basalt [S30]. The literature reads the rays of a crater as bright streaks of its ejecta that run outward from it, sometimes for hundreds of kilometres; in the model a ray is a record within the ground beneath the surface, formed only where material landed on a floor that had already cooled (Further work, item 7). What is new here: every crater on the near-side basalt is read against the basalt just around it, the floors of the maria and the plains apart, by class and size, with a control for how deep the crater dug.
The material from the Earth was its lighter part; the ejecta of the craters on the basalt are therefore poorer in iron than the basalt around them, on the floors of the maria and on the plains alike.
Type of research: quantitative, crater by crater, with a control of excavation depth. The sample: the 3,478 craters of 3 km and more on the near-side basalt (Study 5), 324 on the floors of the maria and 3,154 on the plains; thorium for the 62 of 60 km and more. The tools: the Kaguya iron and titanium maps at 128 pixels per degree, the Lunar Prospector thorium map, the LROC mare map; the ejecta read at 1.2–2 radii, the mare around at 3–4 radii, mare pixels only; and a published map of basalt thickness to flag the craters that dug through it. The control of depth matters because of the literature’s reading: a crater that cut through the basalt throws up the poorer highland beneath it, and its ejecta would be poor in iron for that reason alone. The craters that stayed within the basalt are the clean test.
The craters and their classes were fixed before the chemistry was read. Every crater was kept; craters whose surroundings carry too little mapped mare were set apart and reported.
All craters. The ejecta are poorer in iron than the mare around them in every class and size: by 0.3–0.9 wt% FeO for the craters of 5–10 km, and by 1–6 wt% for the larger ones. Maria and plains. On the floors of the maria the ejecta are poorer than the basalt around them by a median of 0.20 wt% (two of three craters poorer), from at 3–5 km to at 20 km and more; on the plains by 0.36 (71% poorer), from to . Craters inside the basalt. Among the craters whose ejecta lie wholly on mapped mare and that did not dig through the basalt, the difference is small: wt% for the sharp craters (97), for the smeared (6), for the melted (36), within the calibration scatter of the maps (0.81 wt%). The sharp, smeared and melted classes are those of §D.2, set by depth against highland craters of the same size: a melted crater, shallower than 95% of them, landed on the active ground and melted into it; a smeared one is shallower than 75% of them; a sharp one was made after the ground froze. Thorium. For the craters of 60 km and more the ejecta carry the thorium of the mare around them, within about 0.1 ppm. Samples. The Apollo 12 soils tied to Copernicus carry 7.6–9.4 ppm thorium against 0.83 in the local basalt, and 14.0–15.7 wt% FeO against 20.5.
Result. The hypothesis is supported in the full sample: the material of the craters on the basalt is poorer in iron than the basalt, on the floors of the maria and on the plains alike, and the sample tied to a crater made on the mare after it froze is poorer in iron and richer in thorium than the local basalt. Limitations. The literature reads the poorer ejecta as highland material dug from under the basalt; among the craters that stayed within the basalt the difference falls within the scatter of the maps, so the two readings are not separated by these maps; the thorium map is too coarse for the small craters. Directions for further research. The returned samples of the ejecta of single craters made on the maria, read for iron, thorium and the ruthenium isotopes together.
L.7 The near side keeps more of the last small craters
§L.6 read what the material from the Earth was made of. This section reads where it fell. The Earth stands always in the sky of the near side, so material thrown from it reaches that side more easily; if the Earth went on throwing after release, the last craters should lean toward the near side. The model calls the Earth the last scatterer: the last source that threw material over the Moon.
If the Earth went on throwing material after release, and part of it reached the Moon, the last craters it made should be found on the land of the whole Moon — and somewhat more on the side that faces it. Counted on the land alone, every mare removed, the small fresh craters are more numerous on the near side; the larger and older craters are fewer there, because the near side was erased by the heat of the contact and by its own maria:
| Craters on the land (per million km) | Near side | Far side | Near against far |
|---|---|---|---|
| 1–2 km, fresh | 14,103 | 11,814 | (1.12–1.27) |
| 1–2 km, all | 27,708 | 24,577 | |
| 2–5 km | 9,413 | 10,997 | |
| 5–10 km | 1,299 | 2,070 | |
| 10–20 km | 364 | 687 |
The table is read from top to bottom, from the smallest and youngest craters to the larger and older. The last column is the ratio of near to far; green marks an excess on the near side, red a deficit. The colour turns from green to red as the craters grow: the near side holds 19% more of the small fresh craters and only about half the craters of 10–20 km. Two histories are written in one column: the small craters record the last arrivals, which favoured the near side; the larger ones record what the near side lost earlier.
The near side lost its old craters early and gathered more of the last ones. The last scatterer of the craters on the Moon was the Earth (Paper 5, Studies 7 and 12; Paper 3, §C.11).
The phenomenon. The smallest and freshest craters are the last to have formed on the Moon. The gap in knowledge. If the Earth went on throwing material after release, part of it reached the Moon and made these craters; a source facing the near side should leave more of them there. The floors of the maria cannot test it, because the near-side maria lie by the contact and froze late (Paper 5, Study 12); the land can. The research question: on the land, every mare removed, are there more small fresh craters per million km on the near side than on the far side?
In the literature the small craters come from bodies from outside, at a flux nearly the same over the Moon, with a small excess on the leading side [S22, S23]; the old highlands are saturated with small craters, so that a new crater erases an old one; and the young rayed craters scatter fields of secondary craters around them. Secondary craters are made by the blocks a large crater throws out, which fall back nearby; they are not new arrivals from elsewhere, and a field of them could imitate an excess. What is new here: the land of both sides is compared at the same latitudes, the maria and SPA removed, the fields of the young rayed craters removed on both sides, and the fresh craters counted apart from the old.
The last small craters came from the Earth after release; they fell over the whole Moon and somewhat more on the side facing the Earth. Hence the small fresh craters are more numerous on the near-side land than on the far-side land, while the larger, older craters, erased on the near side by the contact and its maria, are fewer there.
Type of research: quantitative; densities compared between the two sides. The sample: every crater of 1–20 km of the Wang & Wu catalogue [S16] on the land, latitude within 60°, outside every mapped mare and outside SPA. The tools: the catalogue with its depths, the LROC mare map, and code that measures the land area on each side and counts the craters on it.
| Choice | Why, in plain words |
|---|---|
| Every mare removed, near and far | The maria covered craters; only the land is compared |
| Latitude within 60°, SPA removed | The poles crowd craters (Paper 7), and SPA erased what lay in it |
| Fresh craters counted apart | On the old land small craters are saturated: a new crater erases an old one, so only the fresh ones keep the last arrivals |
| Fields of 16 young rayed craters removed, 10 crater radii, both sides | Copernicus, Tycho, Jackson, King and others scattered secondary craters around them |
A crater is counted as fresh when it is deeper than the median land crater of its size. A crater grows shallower with time, as its walls slump and its floor fills, so the deeper half of each size holds the younger craters. Saturation, in the table above, is the state of a surface so crowded that, like a page filled with stamps, each new stamp covers an old one and the count no longer grows.
The land of each side was measured by sampling four million points; the craters on it were counted by size, all of them and the fresh apart, first with every crater and then with the secondary fields removed. The values are the table above (secondary fields removed).
The excess. The near side carries 1.19 times the far side’s fresh craters of 1–2 km. Is it chance? Craters cluster, so the interval was found by resampling whole cells of 10° by 10° rather than single craters: 1.12–1.27; it excludes one. Resampling draws the cells again and again at random, with repeats, and recomputes the ratio each time; the spread of the results gives the interval. Drawing whole cells keeps each cluster together, so that a single dense group cannot pass for many independent craters. By latitude. Before the secondary fields were removed, the fresh craters of 1–2 km were 1.12 times more numerous on the near side within 30° of the equator, and 1.39 times at 30–60°; removing the fields left the whole excess unchanged (1.20 before, 1.19 after). At the same distance from a mare. Small craters near a mare could come from its spray while it was active, and most of the near-side land lies near a mare. The land of both sides was therefore compared band by band of distance from the nearest mare edge: the near side carries more fresh craters of 1–2 km in every band — 1.26 (1.13–1.41) within 50 km, 1.25 (1.13–1.41) at 50–150 km, 1.19 (1.08–1.31) at 150–300 km, 1.14 (1.02–1.29) at 300–600 km and 1.51 (1.21–1.78) beyond 600 km. The excess is not the spray of the maria. It is largest in the band farthest from any mare, where no mare could have supplied it. The larger craters. From 2 km up the near side carries fewer: 0.86 at 2–5 km, 0.63 at 5–10 km and 0.53 at 10–20 km.
Result. The hypothesis is supported: the last, small and fresh craters are more numerous on the near side, beyond chance and after the secondary fields are removed, while the older and larger craters are fewer there. The Earth was active after release, and it was the last scatterer of craters on the Moon. Limitations. The fresh craters are defined by one rule; the list of young rayed craters removed is not complete. Directions for further research. The chemistry of the fresh craters (§L.6), and the size of the near-side excess predicted from the capture of slow material by the Moon.
So far, the chemistry of the craters: the material around each mare came from that mare; the inside of a crater is the returning material that made it; no foreign mass is found, and the siderophile elements that are there carry the Earth’s fingerprint; and after release the Earth went on throwing its lighter material at the Moon, more on the side that faces it, as the last scatterer of craters.
L.8 A record kept whole: the Moon never passed through a ring
The crater record of this paper exists because nothing ground it away. A body that passes through a ring of ice and dust is worn by it: its hollows are worn shallow, its rims rounded, its smallest craters erased, and the body itself is reduced. How long a body spends in a ring decides how much of its first face it loses. The comparison below sets the Moon beside the two moons of Mars.
| Body | Time in a ring | What is seen today |
|---|---|---|
| Deimos | long, in the dense ring | smooth; hollows worn shallow (median depth 1.9% of width, against 5.5% on Phobos); no grooves; smaller than it left |
| Phobos | brief, at the thin gaseous edge | etched but not smoothed; grooves and wrinkles kept |
| The Moon | none | a saturated record on the highlands; large basins and their rims kept; the body whole |
Table L.8. Time in a ring and the face that remains. The colour shows how much of the first face was worn away.
Around the young Earth a ring could not form: the pear, turning with the Earth out to the corotation line, swept the band where a ring would stand and gathered its material; the volatiles rose through the connection into the body instead of escaping; and the hot Earth, wrapped in rock vapour, did not let water condense to ice at those heights (Paper 3, §C.9a). The saturated highlands of the Moon are the record of that absence, and the condition is a requirement of the model: the Moon must show no sign of a ring having worn it — no global smoothing, no erasure of small craters independent of terrain, no loss of mass beyond what its construction explains.
Dating
a crater’s age is read in the literature from crater density and a constant flux. The approach: the populations are ordered by when they landed, without converting counts to years.
The Parts before this one asked where the returning material came from, where it landed, how hard, and what it left. This Part asks when, and it answers in a particular way. In the literature the age of a surface is read from the number of craters on it. The crater density is the number of craters per unit area: a surface exposed for longer has gathered more craters, as a car left longer under a tree gathers more fallen leaves. To turn that count into years, the literature assumes a known and steady rain of bodies from outside, a constant flux, calibrated on the samples brought back by the missions. This paper replaces that rain. In the model almost all the craters were made by returning material, whose rate rose and fell with the activity of the openings and of the Earth; a count of craters can therefore still rank two surfaces, the more crowded being the longer exposed, but no fixed rate of arrival can turn the count into years.
What the paper keeps is an order. The crater populations of the earlier Parts can be placed one after another by what lies on what and by the state the craters are in, without a number of years attached to any of them:
first, the craters made by the far-side sources that worked early and were then buried with them under the layers of the far side (§D.1);
then, the craters made while the body was attached, which rose with the shell and are the record of the highlands and of the far side (Parts B, J–K);
then, the craters that landed on the floors of the maria while those floors were still active, and melted into them (§D.2, Part E);
last, the sharp craters on the frozen floors and the small fresh craters on the land, made after release (§D.2, §L.7), together with the captured population named in §M.1 below.
For scale only, the construction as a whole took about 600 Myr and ended with release at 3.873 Ga (Paper 3); the order above falls within that span and after it, and is read without dividing it further.
M.1Captured ejecta after release
This section names the last population in that order, the one made after the Moon had left the Earth.
The material treated so far returned to a shell that still lay on the parent, and rose with it; its record is the far side. A second population follows. At release the Moon was cut off from the Earth’s pressure, and with it the internal pressure of the Moon and the ejections of its maria stopped; the near-side maria were then hot and of low viscosity, and froze slowly, from the outside inward. On the Earth’s side the ejections continued, smaller, while the Moon was already a separate body receding from a few Earth radii. Most of what left fell back to the Earth; a fraction, leaving near the ceiling of eq. (8) and in the Moon’s direction, was captured by the Moon’s gravity and landed on it. The ceiling of eq. (8) is the largest ejection speed, about 10.748 km s, at which material still stays bound to the Earth (§J.5); material leaving just below it climbs far from the Earth before it turns back, and if the Moon lies on its way, the Moon’s own pull can take it. This is not returning material in the sense of Parts J–K — it never came back to the shell — and it is named separately here: captured ejecta. Its target was the surface exposed last, the contact disc and its maria (Paper 11, §B.8); the few and recent craters on the maria are read here as this population, the captured ejecta.
Two things distinguish it from an asteroid. Its velocity at the Moon is bounded above by what is left of the Earth’s escape speed after the climb — of the order of a few km s at a lunar distance of a few Earth radii, plus the Moon’s own escape speed of 2.4 km s — against 15–20 km s for an asteroid; and its composition is the Earth’s — the light part of the outflow, poorer in iron than the maria (§L.6), with no foreign elements. The second speed enters because a body falling onto the Moon from far away is accelerated by the Moon’s own gravity on the way in, and arrives at least at the Moon’s escape speed. The predictions follow: on the maria, craters small for the mass that made them, shock pressures below the asteroidal range, and ejecta poorer in iron than the mare, with no foreign signature. The first two follow from the lower speed, the third from the source. A crater grows with the speed of what makes it (eq. (1)), so a slow body of a given mass digs a smaller crater than a fast one. The shock pressure grows steeply with speed (eq. (6)): about 12.96 GPa at 2 km s and 45.56 GPa at 5 km s in the basalt example of §J.2, and far more at the speeds of an asteroid. And a body of the Earth’s light material leaves ejecta poorer in iron than the mare it lands on, and no foreign signature (§L.6). A mare crater of this age carrying the shock record of an asteroidal velocity is not this population; the population as a whole carries the shock of the lower speed. The capture fraction — what part of the small ejections of that time reached the Moon rather than the Earth — is an orbital calculation left to the Further work.
What we now have is an order of the crater populations, from the buried far-side record to the captured ejecta on the maria, read from superposition and state rather than from a rate of arrival.
Statistics
every comparison depends on what is compared with what. The approach: the samples, the bins and the measures are stated, with what is measured and what is assumed.
This Part states how the comparisons of the paper were made and how far they can be trusted. Two ideas run through all of them. The first is like for like: two groups are compared only when they differ in the one thing under test and are alike in everything else that could move the result. The craters are compared within the same size bin, because a large crater is naturally shallower for its width than a small one; the maria and South Pole–Aitken are removed from both sides of every comparison of the ground, because a mare erases craters and is rich in iron, and a sample that held more mare than its control would differ for that reason alone; and the samples were chosen and frozen before the quantity under test was read, so that the choice could not follow the answer. The second idea is beyond chance. Every measured difference scatters a little from sample to sample. A difference is counted as real only when it is larger than that scatter: when its 95% interval — a range that would hold the true value in 95 of every 100 repetitions — does not include zero (for a difference) or one (for a ratio), or when the probability of a result at least as strong, if there were no effect at all, is small.
N.1How the craters were compared
This section describes the measurements behind the shape of the craters (Parts F–I, Study 6). The second prediction — after the count of §C.3 — is that the landings were harder on one half than on the other (§K.4), and a harder landing should leave a crater of a different shape.
The second prediction is read on the shape of the craters. In the four caps of §C.3, with maria and South Pole–Aitken removed, 1,457 craters of 20–100 km from the Robbins catalogue [S6] were measured on the SLDEM2015 elevation model [S7], at about 60 m. The elevation model is a map of the height of the surface, built from laser altimetry and stereo images, in which a point is resolved every 60 m or so; a crater of 20 km is thus read on several hundred points across. For each crater five things were measured:
the rim: the height of the rim crest along 72 azimuths, its irregularity around the circle and its jump from one azimuth to the next, and the elongation of the rim;
the central peak: present or absent;
the floor: the share of the floor that is flat (slope below 2°) and its roughness;
the three heights of the crater, set out below;
the chemistry inside the crater, by zones, in a separate sample (§L.4).
The 72 azimuths are 72 directions around the crater, one every 5°, so that the rim is read as a closed line and not as a single number. Its irregularity measures how much the crest rises and falls around that line, and its jump measures how much it changes from one direction to the next: a rim broken by a hard landing is both. The three heights are those of §A.2: the rim above the land, the floor below the land, and the rim to the floor.
The comparisons on these measures were built to be like for like in three ways. Craters were compared only within the same size bin (20–30, 30–50 and 50–100 km, §A.2). The irregularity of the rim and the roughness of the floor were compared within the deeper half of each bin, so that a rim softened by time or a floor partly filled would not pass for a weaker landing. And the four caps are of equal size and lie on the equator, so that latitude, which crowds craters toward the poles, is the same for all four (§C.3). A difference between two regions is given as a ratio or a difference with a 95% interval found by resampling (§N.2); where the interval excludes zero, or one for a ratio, the difference is beyond chance. In the craters of 20–30 km, for example, the leading half’s rims are more irregular than the trailing half’s by a ratio of 1.25, with an interval of 1.00–1.48, and they stand 4.5 thousandths of the diameter lower, with an interval that excludes zero (§F.1, Study 6).
The other comparisons of the paper follow the same two rules. Each is set out in full in its own study; the table gathers them so that the reader can see, for each, what was compared with what and how “beyond chance” was decided.
| Study | Compared, like for like | How chance was judged |
|---|---|---|
| 1. Count by longitude (§C.3) | Four equal caps on the equator; maria and SPA removed in each, and the basins as well in a second count | Ratio of densities with its interval from the counts: 1.79 (1.56–2.05); again by resampling whole cells of 5° by 5°, because craters cluster: 1.48–2.19. Neither reaches one |
| 2. Source test (§C.5, §L.1) | Craters around six maria and three plains against 5,922 matched controls more than 600 km from any basalt, all chosen before any chemistry was read | The fall of iron with distance is read against the controls; the crater against its own ground, wt% FeO within 50 km, against in the controls |
| 4. Melted craters (§D.2) | Each crater against highland craters of its own size, basalt removed from the highland sample; the rule set on the highland craters alone | Chi-square test of the table of counts: probability about 3 in a million that the melted share rises toward the contact by chance |
| 6. Shape by longitude (Parts F–I) | Same size bin; rims and floors in the deeper half; equal caps | Resampled 95% intervals; a difference whose interval excludes zero is beyond chance |
| 7. Inside the crater (§L.4) | Craters at 90°W and 90°E paired one to one by diameter, and also by mare edge and latitude: 1,214–1,235 pairs | Every interval includes zero: no difference between the halves |
| 9. Last scatterer (§L.7) | Land only, every mare and SPA removed, the same latitudes, secondary fields removed on both sides | Interval by resampling cells of 10° by 10°: 1.12–1.27, which excludes one |
| 14. Mass under the craters (§D.3) | Each crater against 50 random points on its own floor, of the same size | Wilcoxon test: higher in 13 of 16, probability 0.04 |
Two of the named tests need a word. The chi-square test asks whether the shares in a table of counts — here the share of melted craters in each zone — differ more than chance would make them if the share were the same everywhere. The Wilcoxon test compares each crater with its own control and asks whether the differences lean one way more often and more strongly than chance would make them; it uses the ranks of the differences, so that one extreme crater cannot drive the result.
N.2What is measured and what is assumed
Every measurement rests on choices, and this section names them, so that a reader can judge what each result depends on.
The central peak and the rim crest are classified by an automated reading of the elevation model, not by a manual geological audit; the prominence threshold, the window of the rim search and the cuts between the deeper and shallower halves and between the better- and less-preserved rims are operational and stated with the code. “Operational” means that each line was set by a stated rule chosen before the comparison, not by a judgement made crater by crater; the prominence threshold is how far a central rise must stand above the floor to count as a peak, and the window of the rim search is the band, between 0.85 and 1.15 of the radius (§A.2), in which the crest is looked for. The same rule was applied to every region, so that whatever error it carries, it carries alike on both sides of each comparison. The deeper half used for the rim irregularity and the floor roughness is read from the depth; the three heights are therefore compared over all craters. Selecting the deeper half by depth and then comparing depths would compare a quantity with itself, so the heights are read on the whole sample. The footprint of the central peak is traced by an automated rule; in 425 craters it is broad or reaches the edge of the floor, and the results hold without them. Removing those craters and finding the same result shows that the floor measures are not driven by peaks that spill onto the floor. The elongation figure is from the whole Robbins catalogue without the mask.
The intervals are bootstrap intervals over craters; they do not model spatial correlation between neighbouring craters. A bootstrap interval is found by drawing the sample again many times from itself, at random and with replacement, recomputing the result each time, and keeping the middle 95% of the results. Neighbouring craters are not fully independent — a source scatters several craters in one place — and an interval that treats them as independent can be somewhat narrower than the truth; for this reason the count of Study 1 and the count of Study 9 were also resampled by whole cells of the surface, and their intervals stayed clear of one (§N.1). The ring chemistry of §L.4 is read in fixed fractions of the radius, not on a mapped wall and floor of each crater, and its intervals do not include the calibration scatter of the maps. That scatter is 0.81 wt% FeO and 0.43 wt% TiO (§L.4), larger than every difference measured inside the craters; a difference smaller than it is read as “one material”, not as a measured gradient. Mare pixels inside the crater were kept, and removed only from the ejecta and the surroundings. Inside the crater nothing was removed, so that each crater is read whole; the ejecta and the surroundings serve as the reference ground, and removing the mare from them keeps that reference on the land, as the like-for-like rule requires.
What we now have is the measure of trust for each result of the paper: what it was compared with, on how many units, and how chance was set aside.
Predictions and tests
the possibility of a fast landing is not an identification of the origin of the observed craters. The approach: a tested population is defined, and each claim is listed with its test and, where measured, its result.
That returning material can land fast enough to make a crater does not show that the craters seen today were made that way. This Part therefore lists every claim of the paper with the test that reads it. It has two sections: each claim with its test (§O.1), and the outcome of the paper’s studies at a glance (§O.2). The requirements of the model, and what would test it, are collected in Paper 11 (The Requirements).
O.1Fourteen focused tests
Each row of the table states a claim of the model and what it assumes, and the measurement that tests it, so that a reader with the public data can carry out the test. Several rows have been carried out in this paper; there the result is given in the last column (“Measured”), with its section. The rest are open, and stand as requirements on future data.
|
Prediction or requirement |
Assumptions and quantitative expectation | Test and result |
|---|---|---|
| Ejection, passage and fast landing | The pressure from the Earth, with the volatiles assisting, supplies at the opening; a concentrated returning body passes through the atmosphere and meets the shell | Linking the exit model of Paper 3 to paths with drag and break-up and to an equation of state for the landing |
| A trend in a series of events | Equation (14), only after fixing the source conditions and the altitudes | Shock measurements in units with identified age and origin; control on material, angle and position within an event (depth in the target, distance from the crater centre); read against the range predicted by that version, not against a single general trend |
| Terrestrial source of the returning body | Composition of the ejection reservoir at the time of the event consistent with differentiation in Paper 3 | A mixing model of returning body and target using several elements and isotope systems |
| The maria as the source | The craters around a mare were made by its ejecta (§C.1) | Craters chosen around each mare before their chemistry is read; fraction carrying the mare’s thorium and iron signature against distance from the mare, with the share of the returning material measured. Measured (§C.5, §L.1): FeO of the ground 5.96 wt% within 50 km against 2.30 in the controls far from any basalt — borne out at the level of the ground — the ground around a mare is the mare’s material; the crater is poorer than its surroundings at every distance (, , and wt% FeO at 0–50, 50–150, 150–300 and 300–600 km, against in the controls; §L.2) (an earlier version gave 7.4 vs 2.4 and to ) |
| The ring of active spray | The maria with many small craters on their rims are the volatile-rich ones (§C.1) | Small craters on the mapped rim against the ground outside, mare removed on both sides, against a measured volatile content (pyroclastic and dark-mantle deposits, hydration) — open |
| Buried feed domes | The far side’s feed domes were buried by its layers, with their craters (§D.1) | Circular Bouguer highs and their mare cover; surface composition on the core against the surroundings; crust over the dome. Measured (§D.1): 44 buried, 36 of 40 on the far side; core FeO the same as the surroundings (, to ) |
| The longitudes | The body’s own ejecta land toward the trailing half, 90°E, and meet the leading half, 90°W, head-on (§K.4) | Crater density by longitude, clean (measured: 249–252 at 90°E against 139–175 at 90°W); signs of landing strength by longitude within the same size and depth half (Parts F–I: more central peaks, more jagged small rims and rougher floors at 90°W; the same rim height and the same chemistry inside the crater) |
| The missing foreign mass | External impacting bodies would leave a foreign mass in the upper crust; returned terrestrial material leaves none (§L.5) | The foreign mass the crater record requires against the siderophile elements of the crust; the ruthenium isotopes of the crater melts. Measured (§L.5): the visible craters require 2–6% of the upper 5 km, the crust holds 0.9–2%; ruthenium as the Earth’s |
| A record carried on the shell | Cratering before release, on the attached body; preserving strength; the contact region defined in advance | Dating, cross-cutting relations, deformation and mapping with control on basalt burial; density by angular distance from the near-side centre |
| Size and state on the maria | Large pieces landed early on hot maria and were melted; small, cold pieces landed late on frozen floors and stayed sharp (§E.2–E.5) | Rim above the land of the smeared and melted craters on the mare floors against highland craters of the same size, by zone |
| Terrestrial material after release | The material from the Earth was its lighter part: the craters made on the maria after release are poorer in iron than the mare (§L.6) | Iron of the ejecta of each crater on the mare floors against the mare around it, by size, excavation depth controlled |
| The Earth as the last scatterer | The last small craters came from the Earth after release, somewhat more on the near side (§L.7) | Fresh craters of 1–2 km per area on the land, every mare and SPA removed, secondary fields removed, near against far |
| Raised floors on the basalt | A large landing on soft ground raised the floor, which froze before it returned (§G.2) | Floor against the basalt just outside, tilt corrected, by size and by side |
| Iron of the high and low floors | Floors that froze high were rich in volatiles and poorer in iron than floors that sank back (§G.3) | Iron of each floor against its height relative to the basalt outside |
How to read the rows that were measured. In the row of the maria as the source, the prediction holds: within 50 km of the six maria the ground carries 5.96 wt% FeO, two and a half times the 2.30 of the controls, and the excess falls with distance (§C.5). The crater itself is a little poorer than that ground at every distance (§L.2). In the row of the buried domes, it holds as well: the iron over the 44 buried domes differs from the surroundings by wt%, and the interval, to , includes zero — the surface over a buried dome is the same as the ground around it, as a cover laid over it requires. In the row of the longitudes, the trailing half carries 249–252 craters per million km against 139–175 on the leading half, the opposite of the leading-half excess that bodies from outside would give. In the row of the foreign mass, the upper 5 km of the crust holds 0.9–2% of foreign mass, against the 2–6% the visible craters would require if bodies from outside had made them: at best the lowest end of the requirement, and in most of its range a small part of it.
What each test reads. Each test reads what its claim requires.
Ejection, passage and landing. The model needs one set of conditions in which the energy left after the lift (eq. (5)), the passage through the vapour (eq. (7)) and the landing pressure (eq. (6)) all work together; the test is to fix that shared set.
A trend in a series of events. Eq. (14) says how the landing speed changes with the height of the target, but only for one source, one spin and one field (§K.3). The test reads a trend against what a stated version predicts, not against a single general trend, which the model does not claim.
Terrestrial source. The returning material came from the Earth at a known stage of its differentiation (Paper 3). A mixing model splits a crater’s material into the part of the body that landed and the part of the target; the test asks for the terrestrial composition that supplies the first part.
The maria as the source. If the maria threw the returning material, the ground beside them carries their iron, more than ground far away; this is what was measured (§C.5).
The ring of active spray. If volatiles drove the spray that built the rims of the maria, the maria richest in volatiles — read in their pyroclastic deposits, the dark ash of explosive eruptions, and in their hydration — carry the ring of small craters. A general ring on every rim was not found (Paper 5, §M.1); the test on the volatile-rich maria alone is open.
Buried feed domes. A dome that was buried under the layers of the far side carries the cover on top, not its own material; its core is therefore no more mafic than its surroundings — no richer in iron and magnesium — as measured (§D.1).
The longitudes. The body’s own ejecta fell back gently on the trailing half and were met head-on by the leading half (§K.4); the trailing half is therefore the more crowded, and the leading half the harder landed on.
The missing foreign mass. Bodies from outside bring the siderophile elements — the iron-loving metals such as iridium and ruthenium, which the Moon’s own crust almost lacks — and the isotopes of ruthenium tell an outside body from the Earth. The model expects the Earth’s isotopes in the crater melts, and no more outside metal than space dust supplies.
A record carried on the shell. The crater record of the highlands formed on the shell, survived, and rose with it (Paper 3). The test is that the time of its formation, the time it could be preserved and the time of the rise overlap.
Size and state. A melted crater lost its rim with its floor, because it sank into soft ground; a flooded crater keeps its rim and has only its floor filled. The height of the rim tells the two apart.
Material after release. What reached the Moon from the Earth after release was the lighter part of the Earth’s outflow (§L.6); among craters that dug only into the basalt, the ejecta are therefore poorer in iron than the mare.
The last scatterer. A source facing the near side leaves more of the last small craters there; the test counts fresh craters of 1–2 km, near against far, with the secondary craters of the young rayed craters removed.
Raised floors. A floor raised by a landing on soft ground and frozen in place can stand at or above the basalt around it; a floor filled from that basalt cannot. The test reads each floor against the basalt outside.
Iron of the high and low floors. A floor that froze high held its volatiles and the lighter material, and one that sank back was the denser; high floors are therefore poorer in iron than the low.
The chemical rows carry a condition of their own. Concentrations of siderophile elements must be derived from a defined source state. A deficiency must not be predicted and a chondritic abundance then also interpreted as confirmation through an undocumented change of the degree of differentiation. In plain words, the model may not predict too little metal and then, if a normal (chondritic, meteorite-like) amount is found, explain it after the fact by changing how far the Earth had differentiated; the source state is fixed first. The measured composition of the product of the landing includes mixing with target material; it does not describe the returning body alone. The comparison must also include differentiated external impacting bodies, that is, bodies from outside that had themselves separated a core and so carry little metal in their outer parts.
The geometric claim is kept briefly: the craters attributed to this stage are a record that rose with the shell and reached the far side and the limb, with a possible exception in the contact region. Their absence on young basalt does not prove such an exception, and circularity alone is no argument against transport: a crater that rose on the shell kept its round shape, so a round crater is no evidence against its having been carried. The mechanics and the mapping are detailed in Papers 3 and 11; the same prediction is not counted here as an additional independent confirmation.
Beyond the Moon. The crater mechanism of this paper is not particular to the Moon. A moon that was built from its parent and released from it remains, while the parent goes on throwing out material, under a rain of material returned from that same parent; its craters are made mainly by that material, not by bodies from outside. We therefore predict that the craters of every moon of this kind carry the composition of its parent planet, not that of outside bodies. Phobos and Deimos, which Paper 10 reads as fired from Mars, are the first case: the material of their craters should be Martian. The samples that the MMX mission is to return from Phobos test this directly: the model expects the material of its craters to be mainly Martian, with no more outside material than space dust supplies.
O.2The studies in one table
Each study is given its light: green where the hypothesis held in full, amber where part of it held and part did not, red where it did not hold. What did not hold is stated in its own study and gathered here.
How to read the light. The light judges the hypothesis of each study as it was stated before the measurement, not the model as a whole. Green (light green in the table) means that the hypothesis held in full on the measured sample; the text beside a green light may still name a limit — a small sample, a sub-test not yet beyond chance, or an exception with its stated cause — when that limit does not contradict the hypothesis. Amber (orange in the table) means that the hypothesis held in one part and not in another, and the part that did not hold is named in the same row. Red would mean that the hypothesis did not hold; no study of this paper is red. The study numbering is joint with Paper 5. Study 13 of this paper was cancelled, and the other numbers are kept as they are; Study 5 is shared with Paper 5, where it is Study 8 (Part E). Of the fourteen studies listed, eleven are green and three are amber.
| Light | Study | What held, and what did not |
|---|---|---|
| 1. How many craters, by longitude | The trailing half holds the most craters, beyond chance. The shift of the size distribution is not yet significant | |
| 2. The source test | The ground around the six maria carries their iron, falling with distance, with an excess to 600 km; beside the plains, which threw and spilled nothing, the excess falls to the controls | |
| 3. The buried domes and the large craters | No excess on the buried domes; the large craters come from visible maria and buried domes alike | |
| 4. Craters melted into the floors of the maria | Three of five melted; one sharp crater of 20 km and more on all the floors; on the maria of the contact the large craters vanished. The floors of the contact hold only three craters | |
| 5. Size and state on the maria | Fewer craters on the floors than on the plains at every size; the melted share rises with size; small sharp craters on the contact | |
| 6. The rim, the floor and the peak by longitude | The leading half carries the marks of a hard landing, the far side the highest rims. Some intervals of the rims of the larger craters include zero | |
| 7. The inside of the crater | One material from centre to rim, the same on both halves | |
| 8. The foreign mass | The crust holds a small part of what the craters require; the ruthenium is terrestrial | |
| 9. The Earth as the last scatterer | The last small craters are more numerous on the near side, secondaries removed | |
| 10. The raised floors | A third of the large floors stand above the basalt outside. Nearly all lie on the plains; on the floors of the maria the large craters vanished | |
| 11. Iron of the high and low floors | The low floors are richer in the full comparison and on the plains alone. Against the basalt just outside each floor, and in the stricter groups, the difference is not beyond chance | |
| 12. The material after release | Ejecta poorer in iron than the basalt, on the floors of the maria and on the plains. Among the craters that stayed within the basalt the difference falls within the scatter of the maps | |
| 14. The mass under the melted craters | More mass than their own floor, in 13 of 16, without the edge of a body; none under the plains | |
| 15. The rim: worn by heat or flooded | The rim lost, and the surviving crest blunted, on the side of the hot plain only in the contact. The matched comparison of crest shape rests on four pairs |
The three amber rows show what “part held” means. In Study 6 the leading half carries the marks of a hard landing in the small craters, and the far side the highest rims; but for the rims of the larger craters some of the differences between the regions have intervals that include zero, so they are not yet beyond chance. In Study 11 the low floors carry more iron than the high in the full comparison and on the plains alone; read against the basalt just outside each floor, the difference is smaller ( against wt%, §G.3) and no longer beyond chance, and part of it may come from the units the floors lie in. In Study 12 the ejecta of the craters on the basalt are poorer in iron than the basalt; but among the craters that dug only within the basalt, the difference is smaller than the calibration scatter of the maps, so the model’s reading (lighter material from the Earth) and the literature’s (highland material dug from under the basalt) are not yet separated. A green row can also carry a limit: in Study 1 the shift of the size distribution toward smaller craters at 90°E, by a factor of 0.75–0.81, has an interval that still includes one (§C.3), and in Study 4 the floors of the contact hold only three craters.
Discussion
the records of this paper must tell one process. The approach: what the two halves record is drawn together, and what remains outside and what is new are stated.
The Parts before this one each read one record of the craters: how many there are, the rim, the floor, the central peak, the chemistry, and the state of the craters on the maria. This Part asks whether they tell one story. The line of argument runs in five steps, each resting on a measured result of the paper:
The source. The maria threw the returning material: the ground around them carries their iron, falling with distance to 600 km (§C.5, §L.1).
Where it landed. The body turned with the Earth, so its own ejecta fell back gently on the trailing half and were met head-on by the leading half (§K.4); the trailing half holds the most craters (§C.3).
How hard. The shape of the craters records the landing: the leading half carries the marks of a hard landing, the far side the highest rims, the near side the lowest rims and the flattest floors (Parts F–I).
What fills the crater. The inside of the crater is one material, the same on both halves (§L.4), and the foreign mass of bodies from outside is not in the crust (§L.5).
When. The floors of the maria froze after most of the material had landed (§D.2, Part E), and the last small craters came from the Earth after release (§L.7, §M.1).
Section P.1 draws together the records of the two halves; P.2 states what the paper leaves outside; P.3 states what is new.
P.1What the two halves record
The table sets each measured record beside the reading the model gives it. The colours follow the regions: orange rows are the records in which the trailing half, 90°E, stands out (the number and the size of the craters); green rows are the signs of a hard landing, which point to the leading half, 90°W; the blue row is the near side’s floors, filled by the maria; the grey rows are the heights, in which the far side and the near side stand at the two ends. The deeper the shade, the stronger the difference.
| What | Measured | Reads |
|---|---|---|
| Number of craters | 90°E 249–252, 90°W 139–175 per Mkm² (§C.3) | the trailing half collected the ejecta |
| Size of craters | 90°E toward smaller, factor 0.75–0.81 | softer landings at 90°E |
| Central peaks | most at 90°W below 50 km (60 and 81%); at 50–100 km nearly all craters (§I.1) | hard landings at 90°W |
| Toothed rims | 90°W 1.14–1.25 times 90°E, 20–30 km | hard landings at 90°W |
| Elongated rims | 90°W 17%, 90°E 12% | slanting arrival at 90°W |
| Floor roughness | 90°W 1.5 times 90°E, with the rim jumps (§H.1) | shock of the landing |
| Flat floors | highest flat share on the near side | the maria filled them from below |
| Floor below the surroundings | lowest on the far side, highest on the near side; the same on both halves (§G.1) | hot landings crushed and melted the far side’s layers; the maria filled the near side |
| Rim height | far side highest; leading half lowest at 20–30 km, trailing above it; near side compressed (§F.1) | the forces at landing: outward pull, head-on meeting, an ordinary landing, pressing |
| Peak height | far side highest, near side lowest (§I.1) | the centrifugal force, on peaks as on rims |
| Chemistry inside the crater | one material, centre to rim; the same at 90°W and 90°E (§L.4) | the crater is filled with its returning material |
Three rows show how the table reads. In the first, Mkm² is a million km: the trailing half carries some 1.4 to 1.8 times the leading half’s craters of 20 km and more, depending on whether the large basins are removed as well (§C.3). In the row of the toothed rims, “1.14–1.25 times” is the ratio of the leading half’s rim jump and rim irregularity to the trailing half’s in the craters of 20–30 km (§F.1). The last row, without colour, is the one record that does not change from region to region: the strength of the landing shows in the shape of the crater and not in what lies inside it.
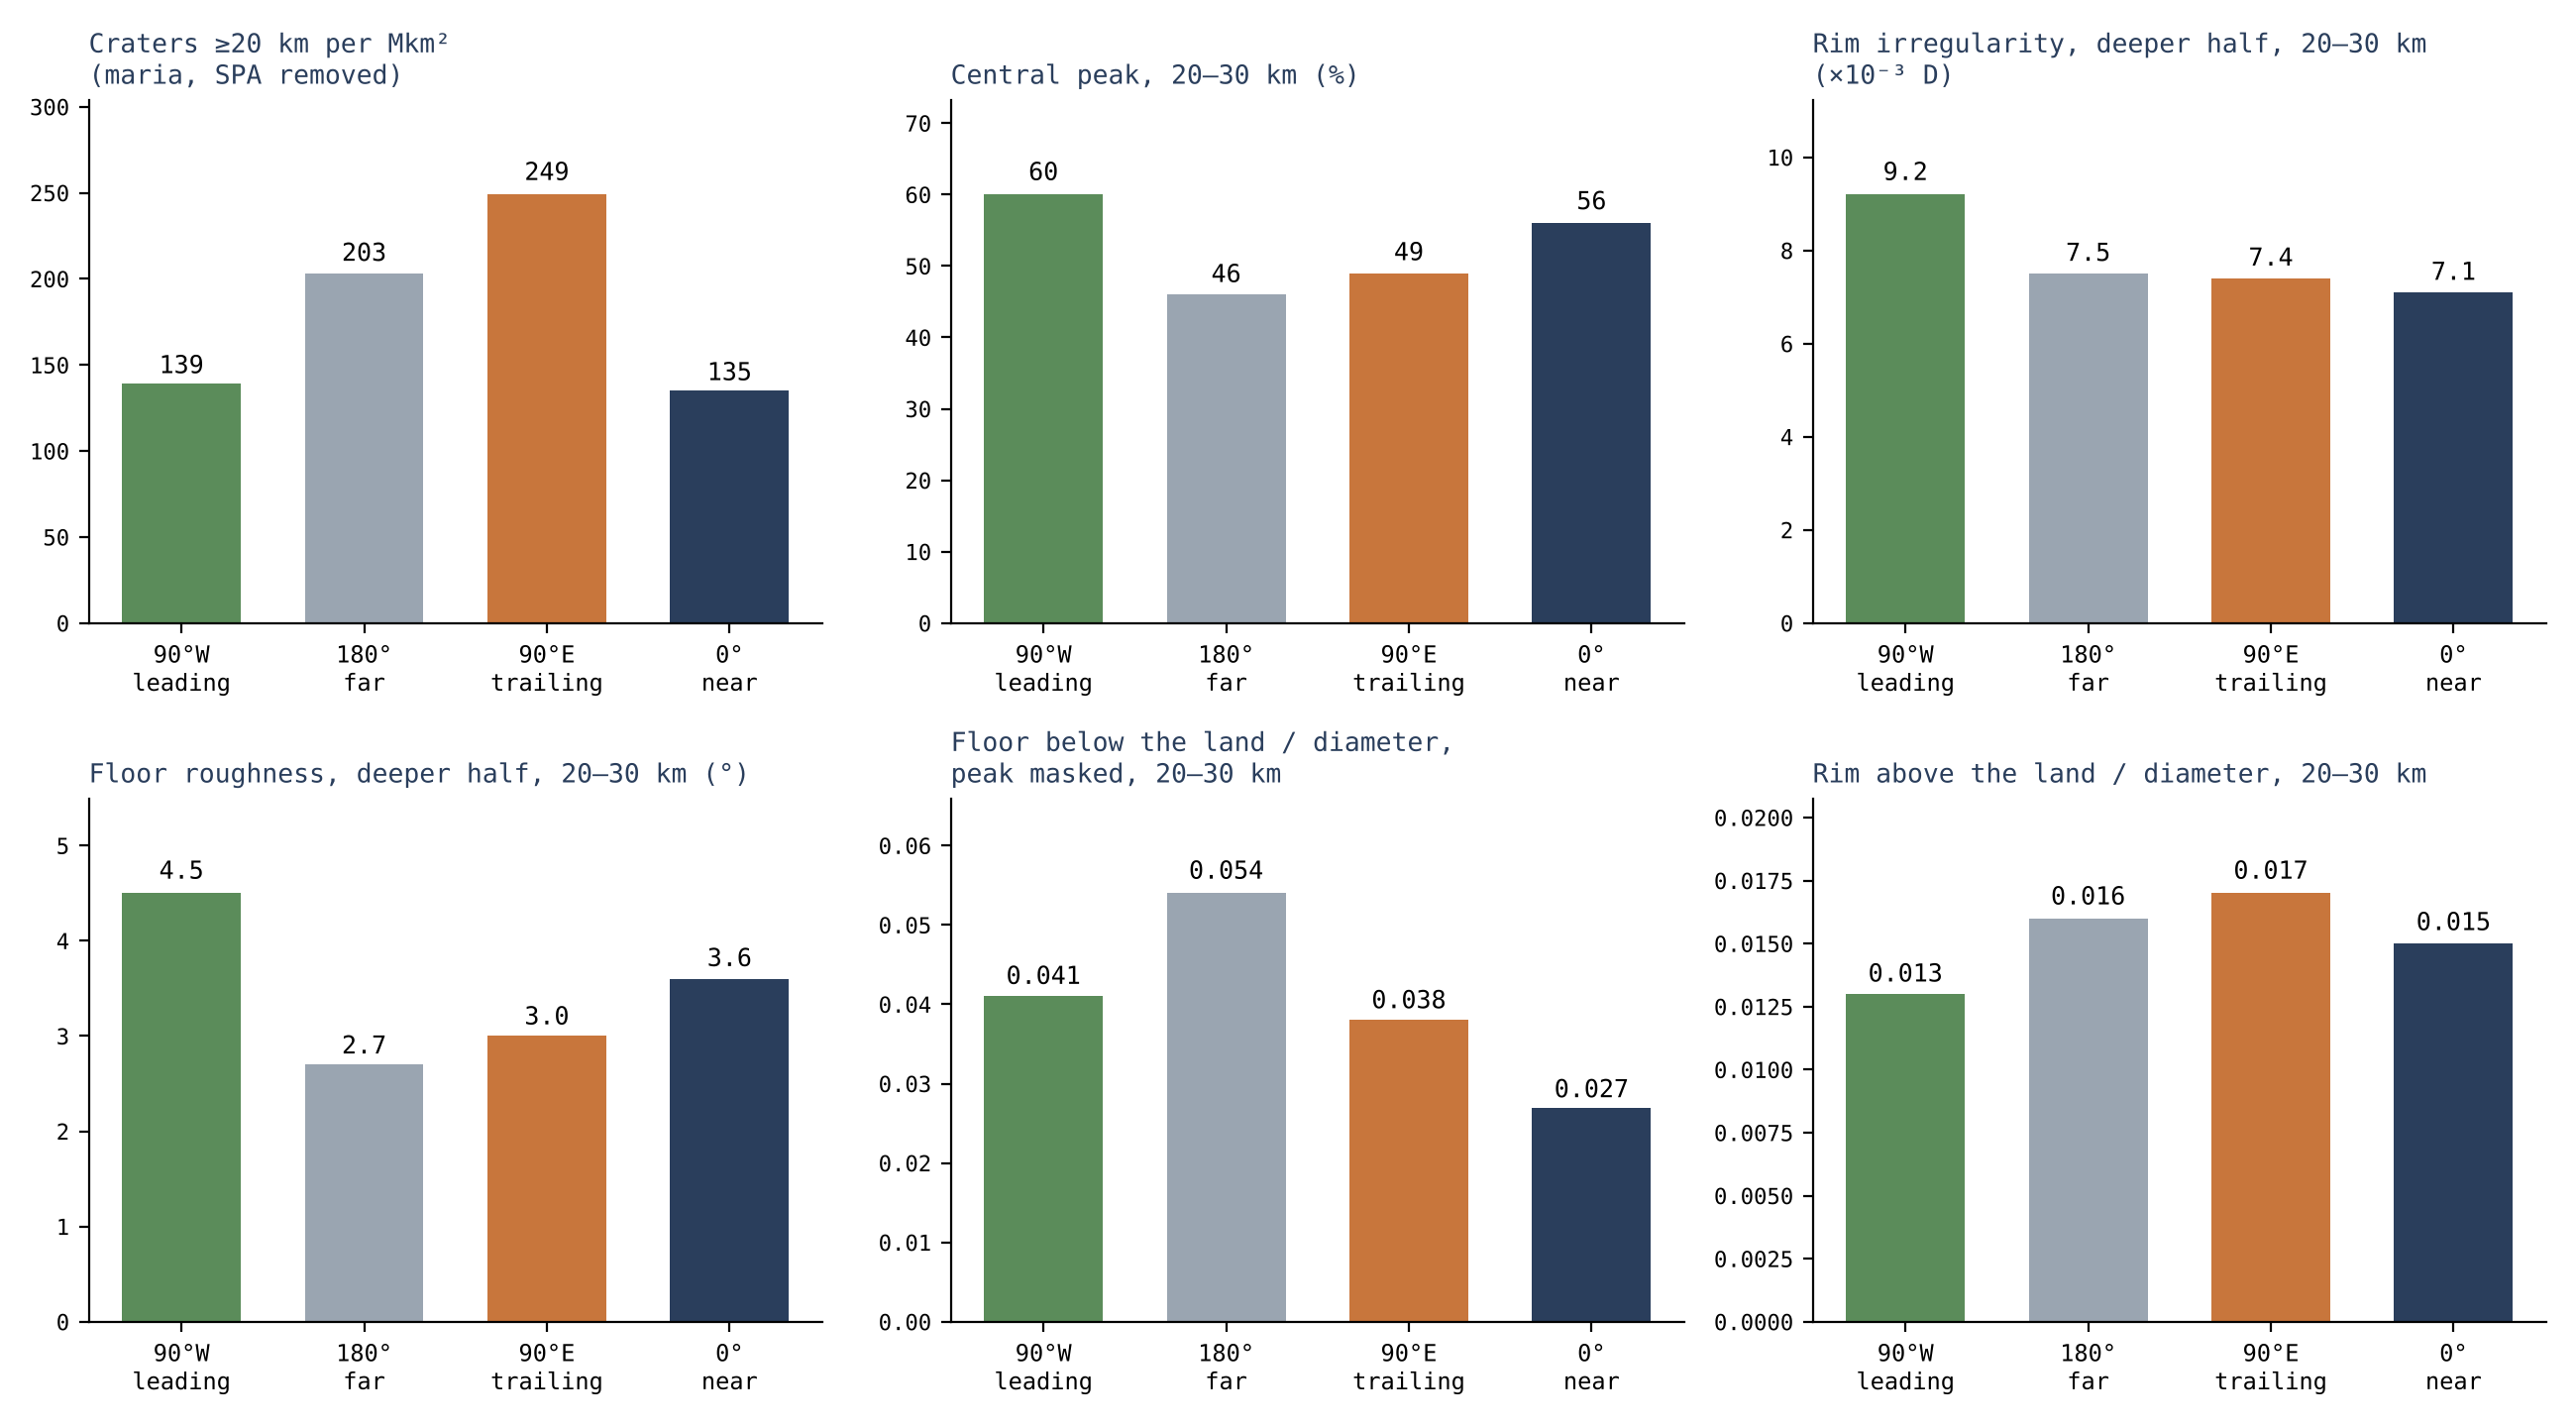
Figure 12 puts the same records side by side as bars, one panel for each measure, so that the reader can follow one region across all of them: the green bar of the leading half is low in the count and high in the peaks, the irregularity and the roughness; the grey bar of the far side is highest in the rims and lowest in the floors; the navy bar of the near side is at the other end in both.
One process, three records. Each part of the crater keeps a record of its own. The centre records the energy of the landing: the central peak rises where the landing had energy enough to spring back. The rim records the forces at the moment of landing: lifted outward on the far side, pressed low on the leading half; and the height of the peak follows the rim. The floor records the ground the material landed on: the layers of the far side, crushed and melted, let it sink; the maria of the near side filled it from below. The halves differ in the way the body’s own ejecta predict. The trailing half, where the material came down gently, gathered the most craters and the smaller ones. The leading half, where the ground ran into the falling material, has fewer craters but harder ones: more central peaks, toothed and elongated rims, rough floors. The far side, its thrown-up material lifted outward by the shared rotation and its layers crushed and melted beneath the landing, holds the highest rims and the lowest floors. The near side, pressed against its ground and filled from below by the large maria, holds the lowest rims and the flattest and highest floors. What the landing did not change is the material: inside the crater, at every longitude, lies the returning material that made it, spread evenly from the centre to the rim.
A specialist may object that the leading half should be the more crowded, since a Moon that moves along its orbit meets more bodies from outside on its leading side; the literature predicts an excess there of some tens of per cent [S22, S23]. The count goes the other way (§C.3), by a margin that chance does not explain, and the shapes say why: the craters of the leading half are fewer but harder, as ground running into falling material makes them, and the trailing half holds the many, gentler ones. A flux from outside gives a leading-half excess and no reason for the trailing half’s gentler craters; the body’s own ejecta, falling back on a turning body, give both.
What we now have is one process read in three records: where the material landed, set by the turning of the attached body; how hard it landed, written in the centre and the rim; and what ground it landed on, written in the floor.
P.2What remains outside the paper
This section states the limits of the paper, so that what it claims is read at its right size.
This paper does not determine the origin of each individual crater or of SPA. The crater size distribution remains a constraint still to be computed: the ejected size and velocity distributions must be propagated through models of break-up, landing, saturation and burial. The size distribution is how many craters there are of each size; to predict it from the model, the sizes and speeds of what was thrown must be carried through every step that changes them — breaking up in flight, landing, and the later erasing of old craters by new ones (saturation) or by cover. Until that is done the distribution limits the model but does not test it. Neither saturation in every size range nor a time-constant flux underlying crater counts can be assumed. A comparison between radiometric age and model age can test chronology, but a mismatch does not by itself identify terrestrial magma: a radiometric age dates the cooling of a sample, and an age read from craters dates exposure under an assumed flux, so that a disagreement between them says that one of the two assumptions is wrong, not which source made the craters.
A construction rate must not be inferred from the number of craters remaining without computing how many were erased, how many returning bodies left material and how many caused loss. The craters seen today are what survived, not all that landed; counting them alone would give too low a rate. Material from the deep source that was ejected and returned is counted in the balance of Paper 3 once. Its later rise with the shell does not turn it into a new source of mass: the same material is not counted again when it is carried up.
P.3 The novelty and the contribution to the series
Ballistic flight, secondary cratering and shock relations are existing physics [S1–S5]. Ballistic flight is the path of a thrown body under gravity alone; secondary cratering is the making of craters by material thrown out of a larger crater; shock relations, such as eq. (6), give the pressure of a landing from its speed. The paper applies them to internal ejection onto the shell of a rising dome, and formulates the requirements the scenario must pass. Its independent contribution is the distinction between the return velocity and the capacity of the ejection source, the calculation of the velocity relative to the surface, and the inclusion of target gravity and atmospheric passage in the cratering constraints. In plain words: the speed at which material comes back is not the same question as how much the opening can throw (§J.1, eq. (11)); what makes a crater is the speed relative to a surface that is itself turning (§K.2); and a crater on the parent forms under the parent’s gravity and after a passage through its vapour (§C.6, §J.3), not under the gravity of the Moon today. It does not repeat the construction of the body from within, which is the subject of Papers 2 and 3. What Paper 6 adds to the series is the crater record read as the record of the maria and of the Earth: the source of the craters, the sorting of their landings by the turning of the attached body, and the order in which the floors froze.
Conclusions
what the paper has shown, in order. The approach: one line for each result, with the part that carries it. Each conclusion below states first what was found and then what it means for the picture of the craters; the part or section named in brackets is where the calculation or the measurement and its test are given in full.
The paper set out to answer one question: if the craters of the Moon were not dug by bodies from outside, what made them, and what do they record? Its answer is that a crater is the place where returning material landed — material thrown out of the openings, the maria, that came back down under gravity — and the parts of the paper have tested that answer in two ways. The first five conclusions concern the physics of the landing itself: how fast the material comes back, what pressure it makes, and what a source must supply for it to happen (Parts J and K). The last four concern the record on the Moon today: the foreign mass that the craters should have left and did not, the maria as the source, the craters that were lost, and the difference between the longitudes (Parts C–I and L). Conclusion 6 joins the two: it names the tests that decide whether the crater population belongs to the mechanism.
Q.1What the paper has shown
A returning body lands as fast as it was thrown (§K.1). In the central field tested, material returning to a corotating surface at the same radius lands at a relative velocity equal to the ejection velocity. Gravitational return does not require a slow landing. The reason is simple: the material leaves with the speed of the turning surface plus its own upward speed ; when it comes back to the same distance from the centre, gravity has returned exactly the speed it took during the climb, and the surface below is still turning at the same rate, so the only difference left between the two is the speed (equation 11). Material thrown at 2, 3, 5 or 8 km/s comes back at 2, 3, 5 or 8 km/s. What it means: falling back does not soften a landing. Material thrown up from the openings returns with the full speed it was thrown with, and that is enough to make a crater; the question is therefore not whether returning material can make craters but whether the source can throw it fast enough (conclusion 3).
At these speeds the landing makes shock pressures of tens of gigapascals (§J.2). In the ideal basalt example, 2–5 km/s give contact-pressure estimates of about 13–46 GPa (12.96 GPa at 2 km/s, 45.56 GPa at 5 km/s, from the measured shock behaviour of basalt [S3]). These are pressures at the point of contact in a head-on landing of like on like, not pressures across the whole crater. The result requires matching of material and geometry before application to a lunar sample. What it means: a landing of returning material at a few km/s is a shock event, of the kind that leaves a record in the minerals; it is not a gentle settling. To compare the number with a particular lunar sample, the actual pair of materials (for example molten material landing on the cooler shell), the angle of arrival and the porosity must be put in; that is a stated step of the test, not a weakness of the result.
The source must throw the material fast, the material must cross the vapour, and it must arrive in one piece (§J.1, J.3, J.5). The exit velocity, atmospheric passage and the survival of a coherent returning body are the three requirements this test hands to Paper 3. To throw a kilogram at 2–8 km/s takes 2–32 MJ (equation 5). The pressure from the Earth supplies it: the spin and the sorting create the pressure in the Earth’s interior, and it passes through the pear to the openings and sprays the material out of them. The gas dissolved in the melt — the volatiles, chiefly water — assists: as the melt rises and the pressure on it falls, the gas expands and adds its push, as a shaken bottle drives out its contents when opened. The full energy account, after the costs of lift, flow and load support (the lift cost of 139.78 GPa in Paper 3), is a requirement of the model. On the way back the body must cross the vapour atmosphere of the scenario; a body one kilometre across crossing a column at 100 bar keeps about half its speed (§J.3). And material thrown faster than the escape speed, about 10.7 km/s in the example, does not come back at all (§J.5). What it means: the three requirements define one window — fast enough to make a crater, slow enough to stay bound, large and dense enough to cross the vapour — and the pressure from the Earth, assisted by the volatiles, must supply that window. The volatiles both help the ejection and thicken the atmosphere the body must cross; one domain of conditions must satisfy both, and that is how the requirement is handed to Paper 3.
A shock trend or a shock ceiling depends on the path, not on the source alone (§K.3, J.5). A decreasing shock trend and a numerical shock ceiling belong to a defined path and source; they are not universal signatures of all returning terrestrial material. The landing speed falls with height up to the corotation radius (about 15,883 km in the early-stage data here) and rises beyond it (equation 14); but whether a series of samples shows a trend in time depends on how the ejection speed, the rotation, the target and the angle changed between events. What it means: a single shock number cannot rule the terrestrial source in or out. Earlier versions of the series gave ceilings of 113 or 97 GPa and a trend of 102→86 GPa; these held for one family of paths, and a sample above such a ceiling does not by itself set the source aside. The test is therefore stated per path and per source (§O.1, “a trend in a series of events”).
A crater made on the parent must be computed in the parent’s conditions (§C.6, J.4). Creation of craters on the parent body requires using the gravity and rheology of the target at that time, and then computing preservation and transport according to Paper 3. Rheology is the way the ground flows or breaks under load — whether it behaves as a stiff solid or as a soft, slowly flowing one. On the parent the gravity was about 8.25 m/s², five times the Moon’s today; the same crater there needs a returning body several times more massive than on the Moon now (§C.6). The receiving surface must also be thick and strong enough to keep a crater of that size, and the crater must be carried, with the shell it lies on, to where it is seen today (Paper 3). What it means: the craters of the far side cannot be read with the scaling laws of today’s Moon alone. Each crater of the record passed three stages — it was made on the parent, it survived, and it rose with the shell — and each stage is part of the calculation.
The paper defines the test, and the tests of §O.1 decide the attribution. Paper 6 has an independent role: it defines a test for the landing of the returning material. Attribution of the crater population to the mechanism is decided by the tests of §O.1, among them — ejection and flight, the trend in a series of events, the terrestrial source, the maria as the source, the ring of active spray, the buried feed domes, the longitudes, the missing foreign mass, and the record carried on the shell — each stated with what it reads. What it means: the physics of Parts J–K shows that the landing can happen; the measurements of Parts C–I and L show whether it did. Several of those tests have now been run — the maria as the source, the buried feed domes, the longitudes and the missing foreign mass — and their results are the four conclusions that follow. Each test reads its own measurement, so that the attribution is checked measurement by measurement.
The craters carry no foreign mass (§L.5). The foreign mass is not there. Read as external impacting bodies, the visible craters require up to 6.7 times the foreign mass the crust holds, and the literature’s whole bombardment fourteen to eighteen times more than crust and mantle hold (an earlier version gave “up to six times” and “seven to seventeen times”); the literature closes the gap by assuming that some 93% of the delivered mass vanished. The ruthenium of the lunar crater melts, where measured, is the Earth’s (§L.5). The measure is the highly siderophile elements — iridium, osmium, platinum, ruthenium, the “iron-loving” elements that went to the core when the Moon separated into layers, so that the crust holds almost none of its own and any addition from outside stands out. In the impact reading the visible craters require – kg of foreign mass, 2–6% of the upper 5 km of the crust; the crust holds 0.9–2% at most. The whole bombardment of the literature requires kg; crust and mantle together hold –. The literature bridges the gap with a low retention (a fifth instead of about three fifths) and with loss to the core before about 4.35 Gyr. The isotopes of ruthenium tell which reservoir of the solar system the element came from, and in the two samples measured they match the Earth’s silicate [S14]. What it means: in the impact reading the missing mass must be assumed away, crater by crater. In the model there is nothing to explain: the material that made the craters was the Earth’s, of the same kind as the shell it landed on, and its siderophile elements carry the Earth’s isotopes.
The maria are the source, and the craters were lost in two ways (§C.1, C.5, L.1; D.1–D.2). The maria are the source of the returning material: the ground around each mare carries its iron and titanium, falling off with distance (§C.1; measured in §C.5 and §L.1). Around the six maria tested, the iron oxide (FeO) of the ground is 5.96 wt% within 50 km of the edge against 2.30 wt% in control craters more than 600 km from any basalt, and it stays above the controls out to 600 km. Craters were lost twice: on the far side, buried with the sources that made them (§D.1), and on the floors of the maria they melted, 49 of 79 of 10 km and more, with one sharp crater of 20 km and more on 1.2 million km, against 207 per million km on the highlands (§D.2); on the maria of the contact the large ones vanished altogether (§D.2). On the 703,000 km of the floors of the maria of the contact not one crater of 20 km and more remains. What it means: a mare is not a target that collected craters but a source that threw material around it — the iron is highest beside the mare and thins outward, the mark of a source. The same activity that made the craters also erased them: on the far side the sources were covered by the layers they and the parent laid down, and the craters went under with them; on the open maria the craters landed on a hot floor and melted into it, about three in five (62%). The craters seen today are the last record written, not the first.
The two halves of the Moon record the body’s own ejection (Parts F–I, §K.4). The longitudes record the body’s own ejection: the trailing half, 90°E, is the more crowded, and the leading half, 90°W, the one landed on hardest — more central peaks, more jagged rims in the small craters, rougher floors; the far side the highest rims, the leading half the lowest; the near side, by the maria, the flattest and highest floors; and inside the crater, at every longitude, one material. The centre records the energy of the landing, the rim the forces at that moment, the floor the ground beneath (Parts F–H). The leading half is the half that faces the Moon’s motion in orbit, centred on 90°W; the trailing half faces backward, centred on 90°E. The density of craters, maria and South Pole–Aitken removed on both sides, is 249–252 per million km at 90°E against 139–175 at 90°W. Material thrown from the attached, turning body at its own escape speed or less fell back on it, and the turning decided where and how hard: on the trailing half it came down gently and often, on the leading half the ground ran into it head-on, as a runner meets rain on the face and not on the back. What it means: the difference between the halves is not a difference of what fell, since the material inside the crater is the same at every longitude, but of how it landed. One process, read in three parts of each crater, gives a consistent picture across the whole Moon.
Taken together, the nine results describe one process seen from two sides. The physics shows that material thrown from the openings returns at the speed it left, makes shock pressures of tens of gigapascals, and requires a source that throws it fast enough and a body that crosses the vapour intact. The record shows that the maria were the source, that the crater record was written and erased by the same activity, that the craters carry no foreign mass, and that the two halves of the Moon were landed on in the way the body’s own turning predicts. The deciding tests are those of §O.1, each with its measurement.
Reproduction and the novelty map
This appendix serves two purposes. The first is to let any reader recompute the flight table of §K.1 from the inputs stated in the paper, step by step. The second is to say, for each component of the paper, whether it is existing knowledge, the model’s hypothesis, or a calculation of this paper.
Reproduction of the flight table
The flight table of §K.1 gives, for each ejection velocity , the height the material reaches, the time it spends in flight, how far west of its starting point it lands, and its landing velocity. Between leaving and returning, the material moves only under the parent’s gravity, so its path is a segment of an ellipse with the parent’s centre at one focus — a Keplerian orbit. The recipe below finds that ellipse from the starting conditions and then reads off the flight. The symbols are those of equation (10): is the specific orbital energy (energy per kilogram; a negative value means the material is bound and must come back), is the specific angular momentum (the “amount of turning” per kilogram, which gravity toward the centre cannot change), is the strength of the parent’s gravity, km is the ejection radius and the rotation rate of the surface.
For each in the table one computes from equation (10):
Here is the semi-major axis, half the long axis of the ellipse; is the eccentricity, how stretched the ellipse is (0 for a circle, approaching 1 for a very elongated path); and is the mean motion, the average angular rate at which the material would go round the whole ellipse. The faster the throw, the closer is to zero, the larger and more elongated the ellipse, and the slower the mean motion.
At the ascending exit point:
The two angles locate the exit point on the ellipse. , the true anomaly, is the actual angle at the centre between the lowest point of the ellipse and the exit point; is an eccentric anomaly, and not the energy . The eccentric anomaly is an auxiliary angle that makes the time along an ellipse easy to compute (Kepler’s equation). The material leaves at , climbs through the highest point of the ellipse at , and comes back to the same radius at the mirror point . The return time and the westward displacement on the surface are:
In words: the flight time is the time to go from the exit point to its mirror point, given by Kepler’s equation. The westward displacement compares two angles over that time: the angle the surface turns, , and the angle the material sweeps round the centre, . The surface turns farther, so the material comes down west of the point it left, by the difference times the radius.
The peak height is : is the distance of the farthest point of the ellipse from the centre, and is subtracted to give the height above the ejection radius. For long flights a distinction must be made between the accumulated angle and a position on the surface modulo — after a full turn of the surface the same point comes round again — but the values in the table require no such correction. There is no general flight ceiling of 44 hours: in the limit the flight time in the Keplerian approximation can grow without bound, because as the energy approaches the escape value the ellipse grows without limit and so does the time to travel it. The perturbations of the real system — the developing body, the shape of the field, the vapour — limit the validity of the approximation.
The Hill estimate uses , and the comparison velocity . The Hill radius is the distance around the Moon within which the Moon’s own gravity holds a small body against the tidal pull of the Earth; is the Earth–Moon distance, and the masses of the Moon and the Earth, and the radius of the body. The comparison velocity is the speed of a fall from rest at to the surface of the body; in the late reference of §J.5 (17,631 km) it gives km and about 1.31 km/s. This is a circular-orbit estimate with an isolated lunar field inside the integral, not a three-body solution.
The novelty map
The table below separates what the paper takes from others from what it adds. Read it from top to bottom: the first three rows are existing knowledge — secondary craters made by returning material, the transfer of material from the Earth to the Moon, and the physics of shock and crater scaling — cited with their sources. The fourth row is the model’s own hypothesis, which this paper and Paper 3 examine. The fifth is the calculation of this paper, valid for the inputs stated. The last row is the model’s reading of the observed craters: that they came from this source. The flight calculation by itself does not establish it; the measurements of Parts C–I and L support it, study by study — the count by longitude (Study 1), the source test (Study 2), the craters melted into the floors of the maria (Studies 4 and 5), the shape of the craters by longitude (Study 6), the inside of the crater (Study 7), the missing foreign mass (Study 8) and the Earth as the last scatterer (Study 9) — as conclusion 6 states and §O.2 gathers.
|
Component |
Classification |
|---|---|
| Returning material forming secondary craters | PRIOR ART — S1 |
| Transfer of material from the Earth to the Moon | PRIOR ART — S2 |
| Shock and crater scaling | STANDARD PHYSICS — S3–S5 |
| Ejection from the openings of the attached body, by the pressure that passed from the Earth through the pear, and the return of the material onto the body | LEF hypothesis examined here and in Paper 3 |
| The flight, energy and sensitivity tables | THIS WORK — calculations conditional on the inputs detailed |
| Attribution of the observed craters to this source | LEF READING — supported by the studies of this paper (Studies 1, 2, 4–9; §O.2) |
Further work — openings for research
The seven items below are where the next calculation or measurement will strengthen or test the picture. The first four complete the physics of the landing — what the source throws, what crosses the vapour, and what the landing does to a hot, layered target; the last three extend the measured record. The broader research topics of the series are collected in Paper 12 (research topics).
Captured ejecta. The capture fraction of post-release terrestrial ejecta by a Moon at a few Earth radii, as a function of launch speed and direction; and the shock and size record on the maria that separates it from later bodies from outside (§M.1). After release the Earth went on throwing material; most fell back to the Earth, and a fraction was caught by the Moon’s gravity. How large that fraction was is an orbital calculation, and its answer sets how many of the few young craters on the maria are expected from this population.
The exit velocity from the openings. The energy of ejection comes from the pressure from the Earth, assisted by the volatiles (§J.1). A model of explosive decompression of a volatile-rich melt at the source pressures of Paper 3 would give the distribution of exit velocities and hence the fraction of material that returns at 2–8 km/s. Explosive decompression is the sudden expansion of dissolved gas when the pressure on a melt falls; this is the quantity that turns requirement 3 of the conclusions into a number.
Passage through the steam atmosphere. Coupled gravity–drag trajectories for bodies of 0.1–10 km through a hydrostatic atmosphere of 10–1,000 bar, with heating and break-up, would fix which returning bodies reach the shell intact (§J.3). The example of §J.3 treated drag alone, for one body at one pressure; the full calculation follows gravity and drag together over the range of sizes and pressures.
Shock in a hot, layered target. Impedance matching for a dense returning body on a cold sialic shell over a mobile base, and the resulting crater scaling at m/s², would replace the basalt-on-basalt estimate of §J.2. Impedance matching is the calculation of how the shock pressure is shared at the contact between two different materials, which depends on the density and stiffness of each; the sialic shell is the light crust, rich in silicon and aluminium, of the parent.
The longitude record. A manual audit of central peaks and rims in the four caps of §N.1, the join with the catalogue of lunar melt flows [S8], and the same measures by crater age, would fix how much of the difference between 90°W and 90°E is landing strength and how much is the maria. The measures of Parts F–I were made automatically on the elevation model; checking them by eye, and adding the melt flows that a hard landing produces, separates the two causes.
Siderophile signatures. A mixing model of terrestrial returning body and terrestrial target for the oldest landing melts, to distinguish returning material from asteroidal impacting bodies by their siderophile-element patterns. Since in the model both the returning body and the target are terrestrial, the melt should carry one pattern; an asteroidal body would add a second, foreign one. The individual craters of known size named in §L.5 are the natural first samples.
Rays and the cooling of the near-side floors (the author’s proposal). The near-side maria stayed liquid for a long time, warmed by the Moon’s internal heat and by the Earth’s heat; the basalt plains, such as Oceanus Procellarum, where Copernicus, Kepler and Aristarchus lie, were exposed to the same great heat of the Earth and are in this very similar to the mare floors. Material that landed on these floors while they were hot lost its record. The author proposes that rays form only when material lands on a floor that has already cooled; on a hot floor they do not form at all. The rays are a record within the ground beneath the surface, not material lying on it. As the floors cooled they came to carry rays: when they had cooled, Copernicus, Kepler and Aristarchus landed hard and left the spider-like rays; Diophantus and Delisle landed while the floor was not yet fully frozen and left no rays; many others landed on a hot floor and left no mark. The study: count the small and medium craters on the near side, on the maria and on the basalt plains, with and without rays. The author expects those without rays to outnumber those with rays, because the amount of material landing on the Moon fell as the Moon receded.
Code availability
All numerical results of this paper are reproduced by the scripts of the LEF reproduction package (Python 3, numpy, scipy), which prints the values of each section from the inputs stated in the text. The package is attached to this preprint as supplementary material (LEF_code_and_data.zip). An earlier version of the series and of the package is deposited at doi:10.5281/zenodo.22743615.
References
[S1] Xu, R., Xiao, Z., Wang, Y., Luo, F., & Ma, Y. (2024). Minimum velocity for impact ejecta to form secondaries on terrestrial bodies. Communications Earth & Environment, 5, 641. DOI: 10.1038/s43247-024-01820-x.
[S2] Armstrong, J. C., Wells, L. E., & Gonzalez, G. (2002). Rummaging through Earth’s attic for remains of ancient life. Icarus, 160, 183–196. Authors’ version: arXiv:astro-ph/0207316. Concerns material ejected in impacts; does not validate the internal ejection of LEF.
[S3] Sekine, T., Kobayashi, T., Nishio, M., & Takahashi, E. (2008). Shock equation of state of basalt. Earth, Planets and Space, 60, 999–1003. DOI: 10.1186/BF03352857.
[S4] Stöffler, D., & Metzler, K. (2016). Proposal for a unified classification system of shock metamorphosed planetary silicate rocks — call for comments. 79th Annual Meeting of the Meteoritical Society, abstract 6075. Used here for the principle of calibration by material and minerals; it does not supply a uniform threshold for every sample.
[S5] Housen, K. R., & Holsapple, K. A. (2011). Ejecta from impact craters. Icarus, 211, 856–875. DOI: 10.1016/j.icarus.2010.09.017. The scaling law is used in this paper for sensitivity only; no experimental calibration was performed for a hot, layered sialic target.
[S6] Robbins, S. J. (2019). A new global database of lunar impact craters 1–2 km: 1. Crater locations and sizes, comparisons with published databases, and global analysis. Journal of Geophysical Research: Planets, 124, 871–892.
[S7] Barker, M. K., Mazarico, E., Neumann, G. A., Zuber, M. T., Haruyama, J., & Smith, D. E. (2016). A new lunar digital elevation model from the Lunar Orbiter Laser Altimeter and SELENE Terrain Camera. Icarus, 273, 346–355. (SLDEM2015.)
[S8] Neish, C. D., Madden, J., Carter, L. M., Hawke, B. R., Giguere, T., Bray, V. J., Osinski, G. R., & Cahill, J. T. S. (2014). Global distribution of lunar impact melt flows. Icarus, 239, 105–117.
[S9] Jozwiak, L. M., Head, J. W., Zuber, M. T., Smith, D. E., & Neumann, G. A. (2012). Lunar floor-fractured craters: classification, distribution, origin and implications for magmatism and shallow crustal structure. Journal of Geophysical Research, 117, E11005. doi:10.1029/2012JE004134.
[S10] Otake, H., Ohtake, M., & Hirata, N. (2012). Lunar iron and titanium abundance algorithms based on SELENE (Kaguya) Multiband Imager data. 43rd Lunar and Planetary Science Conference, abstract 1905; Lawrence, D. J., Elphic, R. C., Feldman, W. C., Prettyman, T. H., Gasnault, O., & Maurice, S. (2003). Small-area thorium features on the lunar surface. Journal of Geophysical Research: Planets, 108, 5102. (The maps of the source test, §C.1.)
[S11] Lawrence, D. J., Elphic, R. C., Feldman, W. C., Prettyman, T. H., Gasnault, O., & Maurice, S. (2003). Small-area thorium features on the lunar surface. Journal of Geophysical Research: Planets, 108(E9), 5102. DOI: 10.1029/2003JE002050. The map used is the Lunar Prospector half-degree thorium product (PDS special products, December 2001).
[S12] Zhu, M.-H., Artemieva, N., Morbidelli, A., Yin, Q.-Z., Becker, H., & Wünnemann, K. (2019). Reconstructing the late-accretion history of the Moon. Nature, 571, 226–229. DOI: 10.1038/s41586-019-1359-0. Retention ratio, the siderophile budget of the lunar crust and mantle, and the mass of the bombardment; read here for the literature’s own numbers.
[S13] Collins, G. S., Melosh, H. J., & Marcus, R. A. (2005). Earth Impact Effects Program: A Web-based computer program for calculating the regional environmental consequences of a meteoroid impact on Earth. Meteoritics & Planetary Science, 40, 817–840. DOI: 10.1111/j.1945-5100.2005.tb00157.x. Scaling of transient and final crater diameter, used here for the literature’s reading.
[S14] Worsham, E. A., & Kleine, T. (2020). Ruthenium isotopic composition of lunar impactites. Goldschmidt Conference, abstract 2887.
[S15] Liu, J., Sharp, M., Ash, R. D., Kring, D. A., & Walker, R. J. (2015). Diverse impactors in Apollo 15 and 16 impact melt rocks: evidence from osmium isotopes and highly siderophile elements. Geochimica et Cosmochimica Acta, 155, 122–153. DOI: 10.1016/j.gca.2015.02.004.
[S16] Wang, Y., Wu, B., Xue, H., Li, X., & Ma, J. (2021). An improved global catalog of lunar impact craters (1 km) with 3D morphometric information and updates on global crater analysis. Journal of Geophysical Research: Planets, 126, e2020JE006728. DOI: 10.1029/2020JE006728.
[S17] Li et al. (2025). Discovery of a carbonaceous chondritic fragment in Chang’e-5 regolith samples. Icarus.
[S18] Chinese Academy of Sciences (2025, October 21). Scientists discover rare meteorite relics in Chang’e-6 lunar samples (CI-like chondrite relics identified by mineralogy and oxygen isotopes). https://english.cas.cn/newsroom/cas_media/202510/t20251021_1089914.shtml
[S19] Murase, T., & McBirney, A. R. (1970). Viscosity of lunar lavas. Science, 167, 1491–1493. DOI: 10.1126/science.167.3924.1491.
[S20] Hiesinger, H., Head, J. W., Wolf, U., Jaumann, R., & Neukum, G. (2011). Ages and stratigraphy of lunar mare basalts: a synthesis. In Recent Advances and Current Research Issues in Lunar Stratigraphy, Geological Society of America Special Paper 477, 1–51.
[S21] Evans, A. J., Soderblom, J. M., Andrews-Hanna, J. C., Solomon, S. C., & Zuber, M. T. (2016). Identification of buried lunar impact craters from GRAIL data and implications for the nearside maria. Geophysical Research Letters, 43, 2445–2455.
[S22] Le Feuvre, M., & Wieczorek, M. A. (2011). Nonuniform cratering of the Moon and a revised crater chronology of the inner Solar System. Icarus, 214, 1–20.
[S23] Gallant, J., Gladman, B., & Ćuk, M. (2009). Current bombardment of the Earth–Moon system: emphasis on cratering asymmetries. Icarus, 202, 371–382.
[S24] Whitten, J. L., & Head, J. W. (2015). Lunar cryptomaria: physical characteristics, distribution, and implications for ancient volcanism. Icarus, 247, 150–171.
[S25] Du, J., Fa, W., Wieczorek, M. A., et al. (2019). Thickness of lunar mare basalts: new results based on modeling the degradation of partially buried craters. Journal of Geophysical Research: Planets, 124, 2430–2459. DOI: 10.1029/2018JE005872.
[S26] Mustard, J. F., Li, L., & He, G. (1998). Nonlinear spectral mixture modeling of lunar multispectral data: implications for lateral transport. Journal of Geophysical Research, 103. DOI: 10.1029/98JE01901.
[S27] Pike, R. J. (1977). Size-dependence in the shape of fresh impact craters on the Moon. In Impact and Explosion Cratering, Pergamon, 489–509.
[S28] Melosh, H. J. (1989). Impact Cratering: A Geologic Process. Oxford University Press.
[S29] Tompkins, S., & Pieters, C. M. (1999). Mineralogy of the lunar crust: results from Clementine. Meteoritics & Planetary Science, 34, 25–41.
[S30] Korotev, R. L., Jolliff, B. L., Zeigler, R. A., Seddio, S. M., & Haskin, L. A. (2011). Apollo 12 revisited. Geochimica et Cosmochimica Acta, 75, 1540–1573. DOI: 10.1016/j.gca.2010.12.018.
[S31] Wieczorek, M. A., Neumann, G. A., Nimmo, F., et al. (2013). The crust of the Moon as seen by GRAIL. Science, 339, 671–675. DOI: 10.1126/science.1231530.
[S32] Gong, S., Wieczorek, M. A., Nimmo, F., Kiefer, W. S., Head, J. W., Huang, C., Smith, D. E., & Zuber, M. T. (2016). Thicknesses of mare basalts on the Moon from gravity and topography. Journal of Geophysical Research: Planets, 121, 854–870. DOI: 10.1002/2016JE005008.
Series manuscripts: Duran, Z. The Model (1), LEF Mechanism in Principle (2), LEF Mechanism in Practice (3), The Orbit (4), The Maria (5), The Poles (7), South Pole–Aitken (8), The Stripes (9), Mars (10), The Requirements (11), the integrated texts, September 2026. They are the source of the scenario definitions and the internal calculations of the series; they are not external observational validation. The framework for comparison with lunar data is collected in Paper 11, The Requirements.
Data availability: no new crater catalogue was created here. The measurements of Parts C–I and L were made on published catalogues, elevation models and maps [S6, S7, S10, S11, S16]. All example inputs and the equations for reproduction appear in the body of the paper and in the appendix. The atmospheric values, the ejection velocities and the sensitivity coefficients are test assumptions, not measurements of the formation conditions.
Use of AI tools: The author used AI assistants (Claude, Anthropic; ChatGPT, OpenAI; Google’s AI search assistant) to write and run the computation scripts, to analyse the catalogues and maps, to prepare figures and tables, to discuss the scenarios, and for language editing and translation. The model and its conclusions are the author’s. The author checked the content and takes full responsibility for it.