The Model
The Moon was built from the Earth while attached to it, and released where the Earth’s rotation had already given it orbital speed
This paper presents the LEF model — Lunar Elevation and Fission — as a single process: the Moon was built from the Earth while attached to it, and released where the Earth’s rotation had already given it the speed of a free orbit. The paper computes nothing new. It tells the whole process as one continuous story, presents each of the ten papers (2–11) that compute its steps, and gathers in one place what the series has measured and what the model requires.
The model is a process model, not a simulation. It proposes a sequence of physical events; for each event the series shows that standard physics permits it under the computed conditions, gives the number that sets it, and names the observation that tests it.
The story runs in stages 0–8. A hot, fast-spinning Earth, turning once in 5.5 hours with its iron still descending, holds a pressure of 150 GPa at its source — enough to lift a volatile-rich, foamed melt lighter than 3,864 kg/m³ to the corotation line, the distance at which turning with the Earth already means orbiting it. The pressure raises one bulge. On its tip sits a body fed from within by the deep melt and covered from without by the Earth’s outer shell, which rises with it as the skin of a dome: a squashed body over a 6,000-km contact, its upper dome about 3,650 km high, holding the lunar mass at 1,300 kg/m³. Material thrown from openings around the region returns at the speed it left, 5 km/s, and makes craters on that shell while it still lies on the Earth. The bulge is drawn into a pear of the Earth’s own material, about nine to twelve lunar masses by the width of its base (Paper 3); it is part of the Earth, held by the Earth’s gravity like any part of it, and is not thrown out, because its speed is not a throwing speed and it lies inside the corotation line. Its base, 9,000–11,000 km wide, stands near Kiritimati in the central Pacific, above the Pacific large low-velocity province, and its tip lags to the west. While attached, the body rounds outward, flattens — its equatorial diameter reaching 1.69 times its polar diameter at 12,994 km — and rounds inward, crowding the craters of its poles (a clean ratio of 1.20 0.05, rising with crater size to 1.53). While the body is attached, its heat comes from the Earth: it enters through Imbrium and Serenitatis, crosses the body and raises beneath the far side the dome that becomes South Pole–Aitken. Serenitatis peels away first; Imbrium stays connected and is detached last. After release the heat is the Moon’s own, with radiation from the nearby Earth that fades as the Moon recedes, and the Moon cools slowly, the maria first and its centre later. The lengthening pear slows the Earth and the gathering core speeds it up: at release the day is 5.77 hours and the corotation line lies at 16,399 km. The Moon, round and rigid, at 2,600 kg/m³, begins to separate as its centre of mass reaches that line and is torn free slightly beyond it, about 210 km past the line, 3.873 billion years ago. The system then holds 1.007 times today’s angular momentum, where classical fission needed 2.74 times. The Moon enters an orbit tilted by the latitude it left from, 22.5°, which decays to 5.145° at the present distance, the value observed. The release does not bring the pear down: the sorting that acts on it regardless gathers it back into the Earth over tens to hundreds of millions of years. Its heavy part sinks to the base of the mantle beneath the base, its leading wall is folded into the stripes of the North Pacific, and its back is gathered into the arcs of the western Pacific.
The same idea, followed on Mars by another route, gives its two small moons. The paper closes with the series’ traffic light of tested observations, the eighteen requirements of Paper 11 with their tests, the two key observations of the model with their results (the geometry of the exposure zones, and the origin of the material of the crater record), and the series of twelve papers with the work that remains open.
The Moon was built from the Earth, while attached to it, and released where the Earth’s rotation had already given it the speed of a free orbit. That is the whole of the model, and it is a process: a hot, fast-spinning Earth with its iron still descending concentrates a pressure beneath one region; the pressure raises one bulge, which is drawn into a pear; on the tip of the pear sits a body that grows from within and from without at once; the body rounds, flattens and rounds again while attached; and when its centre of mass reaches the corotation line it begins to separate, and slightly beyond it, about 210 km past the line, it is torn free — round — into orbit. The pear is then gathered back into the Earth and leaves its folds in it.
Five numbers carry the model. Each is computed in the series.
The release. The corotation line at release lies at 16,399 km, with an Earth day of 5.77 hours — about 2.6 Earth radii (Paper 2).
The budget. The system at release holds 1.007 times today’s angular momentum; the classical route needs 2.74 times (Paper 2).
The push. The pressure at the source is 150 GPa; lifting a melt of 3,500 kg/m³ to the line costs 139.78 GPa and leaves 10.49 (Paper 3).
The density. The body on the tip of the pear has 1,300 kg/m³, at release 2,600, today 3,344 (Paper 3).
The age. The separation took place 3.873 billion years ago, the age at which the norite clocks of South Pole–Aitken were reset (Paper 8).
What the model requires. A parent still nearly uniform inside when the transfer begins (moment-of-inertia coefficient ); a deep melt lighter than 3,864 kg/m³, which a volatile-rich foam is and a dry melt is not; a shell stiff enough to keep its craters ( Pa s); a pear, held like any part of the Earth by the Earth’s gravity, that stays inside the corotation line and carries the body to it; a Moon round and rigid at release (axis ratio ). Each requirement is stated with its test in Paper 11 and gathered in Part E.
The requirements of the model, and what would test it, are collected in Paper 11 (The Requirements).
Introduction — a different kind of answer
The origin of the Moon is usually presented as settled: a Mars-sized body struck the young Earth, and the Moon accreted from the debris. That model has explained much and is supported by extensive computation. But each of the Moon’s most distinctive properties has required it to add something. The Moon’s material is isotopically the Earth’s, so the impact must have mixed the two bodies completely [2, 3]. The Moon’s orbit is tilted five degrees from the plane in which a debris disk would have left it, so a resonance, a passing planetesimal or an Earth tilted past seventy degrees must have tilted it afterwards [4, 5]. The far-side crust is thicker than the near side, so a second moon must have fallen onto it [6]. These are not failures. They are the cost of a model in which the Moon is assembled from fragments in space.
The model presented here pays none of those costs, because in it the Moon is not assembled from fragments. It is lifted, as one connected body, out of the Earth, and released. Its material has the Earth’s composition because it comes from the Earth. Its orbit is tilted because it left from a latitude, not from an equatorial disk. Its far side is thick because it is built of many layers of compacted sial, which the forces of the spin carried up to the tip of the bulge, and of material that returned to it again and again; the near side was the base. What the model must pay for instead is the lifting, and that price is computed: the pressure, the angular momentum, the connection and the release.
This is a process model, and the term needs to be defined before the model is stated. A simulation solves the equations of motion for a chosen initial state and reports what happens. A process model starts from a proposed sequence of events. For each step it shows that the physics permits the event, gives the number that sets it, checks that the numbers agree with one another, and names a specific observation that tests it. The giant-impact hypothesis was a process model for many years before the first simulations ran [7]. The present model is at that stage, and the series is written so that it can be tested. No step asks the reader to accept it without its number.
How this paper is built. It tells the story first and presents the papers after. Part A states what any model of lunar origin has to explain and why the lifting route was closed for a century. Part B tells the process in stages 0–8 as one continuous account, with the central number of each stage and the paper that computes it. Part C presents the ten papers that compute the model, one after the other: the claim of each, then each of its parts in a paragraph. Part D gathers the traffic light of the series — every observation tested, in green, orange or withdrawn. Part E collects the requirements and presents the two key observations of the model with their results. Part F lists the twelve papers and what remains open.
| Part | Title | The question it settles |
|---|---|---|
| A | What has to be explained | Which properties must any model of origin account for, and why was the lifting thought impossible? |
| B | The process, in stages 0–8 | What happened, in what order, and with what number at each stage? |
| C | The papers, one after the other | What does each of Papers 2–11 claim, and what does each of its parts establish? |
| D | The traffic light of the series | What has been measured, and how did each test come out? |
| E | Requirements and the key observations | What must hold if the model is right, and how did its two key observations come out? |
| F | The series | How are the twelve papers arranged, and what is left for future work? |
The process took place on an Earth that no longer exists, and the model is stated in that environment, not in the present one. About 4.5 billion years ago the Earth was heavier by one Moon — its mass, kg, is today’s Earth and today’s Moon in one body. It was hot throughout and expanded by its heat, with a volumetric radius of 6,517 km (about 6,721 km at the equator, because a fast-spinning body bulges there). It turned once in 5.5 hours. Its iron was still descending; the organisation of its core had only begun, as the first stage of one long, continuous process. A steam atmosphere of hundreds of bars lay over a molten surface, and a cold, stiff, sialic skin floated on it.
Every number in the papers that follow is computed under these conditions. The conditions of the present Earth — a solid crust, a slow day, oceans, a Moon that recedes by centimetres a year — do not apply to it, usually by orders of magnitude. The table below sets out the environment domain by domain.
| Domain | The environment of the process | Why it matters to the model |
|---|---|---|
| The Sun | About 30% fainter than today, but far more active in wind and ultraviolet [1] | Surfaces cool faster; volatiles escape to space by hydrodynamic loss; the sky is not a heat source |
| The Earth’s mass | kg — the present Earth () and the present Moon () together, in one body | The Moon’s material is inside the parent; nothing has left yet |
| The size | Volumetric radius 6,517 km, including a thermal expansion of 120 km; on a spheroid flattened by its spin, equatorial radius 6,721 km and polar 6,128 km (Paper 2) | The expansion is a requirement: below 98 km of expansion the budget does not close (Paper 2) |
| The day | 5.5 hours at the start; 5.77 hours at release, because the lengthening pear slows the spin and the iron sinking to the centre speeds it up (Paper 2). The equatorial speed at the start is about 2.1 km/s, and the sky turns four times faster than today | The corotation line lies at 15,818 km at the start (5,020 m/s) and at 16,399 km at release — only about 2.5–2.6 Earth radii out, where today it lies at the distance of geostationary satellites |
| Gravity | About 8.25 m/s² at the equator and 9.5 at latitude 44°, on the flattened spinning parent | Gravity is not one number; it changes with latitude, with the mass leaving and with the body rising above the surface |
| The interior | Hot throughout; iron descending, the core only beginning to gather (); a magma ocean beneath a thin chilled skin | Angular momentum is stored as in a nearly uniform body; the interior can flow; a pressure of 150 GPa is available at the source (Paper 3) |
| Water | No liquid water. The present oceans are a steam atmosphere of hundreds of bars over a molten surface; volatiles are dissolved in the melt and far more abundant than today | Volatiles lower the density of the rising melt to about 1,300 kg/m³ in the body on the tip; they do not raise the pressure above the lithostatic value; there is no ocean to fill a basin |
| The outer shell | A cold, stiff sialic skin of 2,800 kg/m³ over a mobile base — the only rigid thing in the system, and the only thing that can keep a crater | Its sial, carried up to the tip of the pear and gathered there in many layers, becomes the Moon’s far-side crust and carries its earliest record; it must be stiffer than Pa s to keep its craters (Paper 3) |
| The place | The base of the pear near Kiritimati (about 1.9°N 157.5°W, central Pacific), above the Pacific large low-velocity province at the bottom of the mantle; the pear leaned back westward and north over the north-central Pacific (the earlier reading of the source, about 25°N 165°E) (Papers 3, 9) | Every position is given in today’s frame (see the box on the axes below) |
| Time | Start about 4.5 billion years ago; in the series’ rough timeline about 600 Myr from the start of the bulge to release at 3.873 Ga: about 400 Myr for the bulge and the pear, about 100 Myr of flattening, about 100 Myr to release (Papers 2, 8, 11) | A working scenario, not a measured duration; how long “the Moon” was attached depends on what one calls the Moon (Part B) |
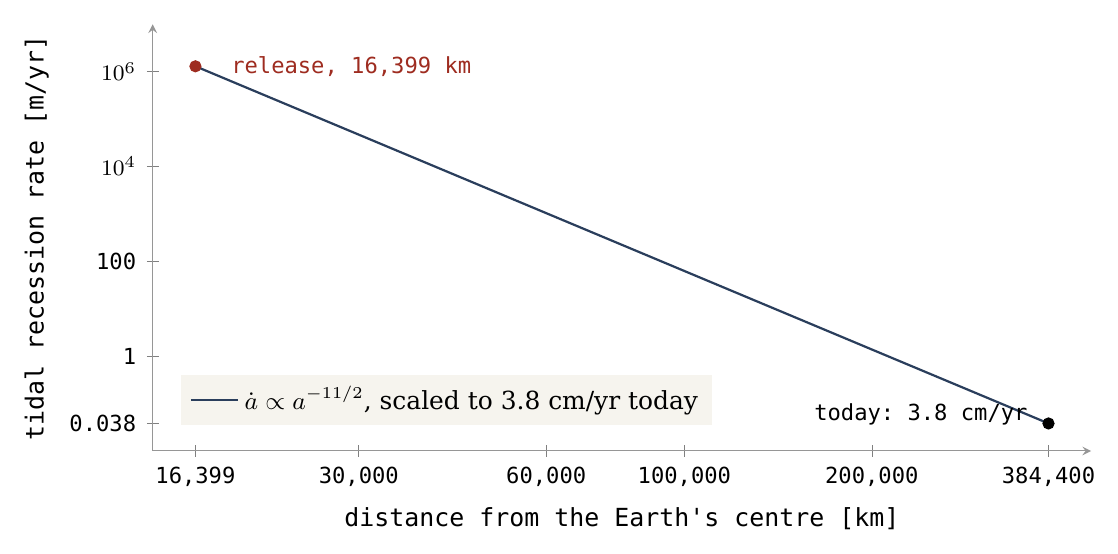
| Rates | Rates are not the present rates. The tidal recession of the Moon falls by about seven orders of magnitude between release and today, where it is 3.8 cm a year; a body released just inside corotation falls inward for billions of years and then disrupts within tens of millions (Papers 4, 10) | Processes that take billions of years now took thousands then; the order of events is set by rates that fell as the Moon receded |
The picture the table gives is of a planet turning in five and a half hours under a steam atmosphere, glowing at the surface, with a cold skin floating on it, and no Moon. Figure 1 shows the point about rates: a tidal recession of a few centimetres a year today was, close to the Earth, a recession of a very different kind. The process that follows is how the Moon came out of that planet.
The system of axes of the Earth and the Moon, from release to today, is not solved in this series. It is a problem of its own. Four planes are involved — the Earth’s equator, the Moon’s orbit, the Moon’s equator and the ecliptic. The axes move in two different ways, by slow wandering of the body relative to its spin axis and by precession of the spin axis in space, at rates that differ by orders of magnitude. The Earth’s frozen bulge keeps an unknown memory of earlier spins, and the parts feed back on one another.
The series therefore gives every position in today’s frame: the base of the pear near Kiritimati, the stripes of the North Pacific, the exits beneath South Pole–Aitken. Where a past orientation matters — the 22.5° of release, the equator of the stripes inclined at least 10° to today’s — the paper that uses it says so. The axes are future work, not a paper of the series (Part F); their solution may change parts of the model, and the model is stated in a form that lets it.
What has to be explained
which properties of the Moon must any model of its origin account for, which of them cost the assembled-from-fragments picture its additions, and why was the lifting route closed? The approach: list the seven properties that Paper 11 turns into requirements, set the additions of the collision model beside what a lifted Moon obtains from its geometry, and re-evaluate the angular-momentum objection at the place where this route actually releases the Moon.
Part A sets the target. Before the process is told in Part B, the reader should know what it has to deliver: a list of properties the Moon has, each measured, each of which a model of origin must produce. The list is short, and every item on it is examined again, with its test, in Paper 11.
A.1The seven properties of the Moon
The Moon is made of the Earth’s material: its oxygen, titanium, chromium and tungsten isotopes are indistinguishable from the Earth’s within a few parts per million [2, 8]. Isotopes are forms of one element that differ only in mass; their ratios differ from one body of the Solar System to another and are hard to change once a body has formed, so they act as a label of origin. For oxygen the Earth–Moon difference is ppm (parts per million). The Moon has a small metallic core: its seismic radius is about 330 km, about 1.4% of the Moon’s mass [9], against 32% for the Earth. Its crust is thicker on the far side than on the near side [10] — by about 10 km between the centre of the near side and the far side, and by about 8 km in hemispheric means. It keeps one face toward the Earth. Its far-side surface was closed and preserved before the fed near side quieted, and the far side is older than the near-side maria. Its early melt carried water: melt inclusions — tiny drops of magma sealed inside crystals as they formed — hold 615–1,410 ppm [11]; the volatiles have since escaped to space, and the interior measured today is dry. And its centre of mass lies about 2 km toward the Earth from the centre of its figure.
Paper 11 turns these seven properties into seven requirements, R1–R7, each with the quantity that tests it. Table A.1 lists them. To the seven one more property is added here, because it is the one a disk of debris cannot give without help: the Moon’s orbit is tilted 5.145° to the ecliptic.
| Property | What is measured | What a lifted Moon must show | |
|---|---|---|---|
| R1 | The Earth’s material | O ppm; Ti, Cr, W isotopes matching the Earth’s | A composition reachable as a mixture of the two terrestrial sources, the deep feed and the rising shell |
| R2 | A small core | Seismic core about 330 km in radius, about 1.4% of the mass | Little metal reached the Moon: the feed was mainly silicate with a little terrestrial metal, about 1.47% of the deep material counting only the metal that reached the core; most core material returned down the pear to the Earth |
| R3 | A thicker far side | GRAIL: far side thicker by about 8–10 km | Many layers of compacted sial that migrated to the tip, and of returning material, on the far hemisphere |
| R4 | One face to the Earth | Synchronous rotation | The side by which the Moon was attached is the side that faces the Earth |
| R5 | An order of preservation | Far side older than the near-side maria | The far side closed and kept its record before the fed side quieted |
| R6 | Water | 615–1,410 ppm in melt inclusions | Volatiles enough, in the right state, to foam the feed |
| R7 | The centre of mass | About 2 km toward the near side | A crust of the modelled shape gives 1.24–3.11 km for density contrasts of 300–750 kg/m³ |
| + | The tilt of the orbit | 5.145° to the ecliptic | An orbit inclined by the latitude it left from (Paper 4) |
How to read the table. Each row joins a measured property to a step of the route: R1 to the source, R2 to the feed, R3 and R7 to the building of the far-side crust and the shape of the crust, R4 to the connection, R5 to the order in which the two sides were preserved, R6 to the conditions the feed needed. Paper 11 does not count these as seven proofs: the thick far side, the offset centre of mass and the placing of the maria are one distribution of material seen several ways, and counting them separately would count one fact several times. Paper 11 adds eleven further requirements, R8–R18, that follow from the pear and from the later papers; Part E lists all eighteen.
A.2What the collision model had to add
The table below sets the collision model and the lifted Moon side by side, property by property. The middle column is what the giant-impact family must add to obtain each property; the right-hand column is what a Moon lifted from the Earth obtains from the geometry of the route.
| Property | What the giant-impact family must add | What a lifted Moon obtains |
|---|---|---|
| Material identical to the Earth’s | Complete mixing of the impactor and the Earth: a synestia or a very energetic collision [2, 3] | The material is the Earth’s; no mixing is required (Papers 3, 11) |
| Orbit tilted 5° | A later excitation: an evection resonance, planetesimal encounters, or a high initial obliquity of the Earth [4, 5] | The inclination is the release latitude, : 22.5° at release, 5.145° at the present distance by the reduced decay law, the observed value (Paper 4) |
| Far-side crust thicker | A second, companion moon accreting onto the far side [6] | The far side is many layers of compacted sial, carried up to the tip of the bulge by the forces of the spin, and of material that returned again and again; the near side was the base (Paper 3) |
| Small core | The impactor’s core sinking into the Earth, with a small fraction retained | All the Moon’s metal is terrestrial. Much iron entered the pear, less toward its tip, and the feed that reached the Moon was mainly silicate with a little metal; at detachment the heavy core material lay in the last third of the body, did not cross the corotation line and went back down the pear to the Earth (Papers 3, 11) |
| Water in the early interior | Delivery by the impactor or by later accretion, after the heat of the impact drove volatiles off | The melt was volatile-rich; the volatiles are what made it light enough to rise (Paper 3) |
| Angular momentum | Set by the impact geometry, then reduced by an evection resonance [4] | 1.007 times today’s at release, for a parent that began at 5.5 hours (Paper 2) |
The table is an argument about economy. In the collision model each property has its own cause, added for it: complete mixing for the isotopes, a resonance or an encounter for the tilt, a second moon for the far side, a loss of volatiles followed by a return of water. In the lifted model the same properties come from one cause — the route by which the material left — and the model pays instead for the lifting. The rest of the series computes what the lifting requires.
A.3Why the lifting was thought impossible
The objection. Fission — the idea that a fast-spinning Earth shed the Moon — was proposed by Darwin in 1879 and set aside within decades [12]. The reason was arithmetic: a Moon thrown off the Earth’s surface would need the Earth to spin so fast that the Earth–Moon system would have had to hold about four times the angular momentum it holds today. Angular momentum is the total amount of spin of a system — the spin of the Earth on its axis plus the Moon’s motion around it. It stays fixed unless something outside the system twists it, and since nothing outside has added any, the excess had nowhere to go. The arithmetic is correct. Paper 2 shows what it assumes: that the material leaves from the surface, at the surface speed.
Why the surface fails. At the surface of a parent turning once in 5.5 hours, the rotation carries the material at about 2,133 m/s; a free orbit at that height needs about 7,701 m/s. Material released there is about 5.6 km/s short of orbital speed and falls back. The only way to close the gap at the surface is to spin the whole Earth faster, and a faster spin costs angular momentum. At the classical point where a spinning fluid body becomes unstable — the Jacobi bifurcation — the parent turns once in 2.73 hours and holds about kg m² s, 2.74 times what the Earth–Moon system holds today. The value of about four times (4.08) comes from the original reference calculation, made at a different point of the same sequence of spinning shapes; it is the source of the familiar statement.
Why the corotation line succeeds. The LEF route closes the gap in a different way: not by spinning the Earth faster, but by carrying the material outward while it still turns with the Earth. A body that turns with the Earth goes round once in every Earth day, so the farther out it is, the faster it moves; the speed a free circular orbit needs falls with distance. The two speeds meet at one distance, the corotation radius: Here is the Earth’s spin rate ( divided by the length of the day), the gravitational constant and the Earth’s mass. In words: the corotation radius is the one distance at which a circular orbit takes exactly as long as one turn of the Earth. For a 5.5-hour day it lies at 15,818 km, where both speeds are 5,020 m/s; this value takes for the mass of the Earth alone, as for a test particle, while with the parent’s full mass, kg, the same formula gives 15,883 km (Paper 3, §A.9) — two definitions, both used in the series. Today’s geostationary satellites sit on the same line for the present day; with a day of a few hours the line lay only about two and a half Earth radii out. A mass released there is already in orbit. An everyday picture: a child who walks from the centre of a turning roundabout to its rim moves faster at the rim without anyone pushing the roundabout harder. The body rose the same way — gathering speed gradually along the climb, not in one throw. Darwin computed what is needed to throw a moon off the surface; the LEF route grows one and carries it out.
The budget at the line. The spin the Earth needs for this is the spin it would have had if all of today’s angular momentum were returned to it: about 5.5 hours. A uniform parent of volumetric radius 6,517 km, flattened by its spin to an equatorial radius of 6,721 km and turning in 5.5 hours, holds kg m² s. During the transfer the lengthening pear slows the Earth and the iron sinking to the centre speeds it up; at release the day is 5.77 hours and the corotation line, with the Moon’s own mass included, lies at 16,399 km. There the Moon’s orbit holds (17% of the budget; this is the orbital angular momentum of the pair about their common centre, with the reduced mass — counting the full lunar mass about the Earth’s centre gives ) and the Earth’s spin ; the system holds 1.007 times today’s angular momentum ( against ), the same total it held at the start. The surplus, 0.7% in the scalar sum and 1.5–2.5% against the vector sum at the angles tested, has the sign required: since the release, solar tides have removed about 1% of the system’s angular momentum. Table A.3 sets the routes side by side.
| Route | Where the speed match is made | Earth day | Angular momentum / today’s |
|---|---|---|---|
| Classical fission, original reference point | the surface | — | about 4 (4.08) |
| Classical fission, Jacobi bifurcation | the surface | 2.73 h | 2.74 |
| LEF, the conserved budget | corotation line: 15,818 km at the start, 16,399 km at release | 5.5 5.77 h | 1.007 |
Table A.3. The angular-momentum price of the same product — a Moon in orbit — by route. The red fades as the price falls: the classical route evaluates the speed condition at the surface and pays two to four times today’s budget; the LEF route evaluates it at the corotation line and pays what the system holds (Paper 2, §A.6).
How to read the table. The rows run from the most expensive route to the cheapest, and the colour fades with the price. The two red rows ask the Earth’s surface to reach orbital speed, which forces the parent toward break-up. The last row never uses that condition: the material is carried out in corotation and the speed match is made at the line, where a parent turning once in 5.5 hours already supplies orbital speed. During the transfer the pear and the core change the day and move the line, but they only move angular momentum between the Earth’s spin and the Moon’s orbit; the total is the same at the start and at release, 1.007 times today’s (an earlier version gave 1.008 for the release state, from today’s total rounded to ). The objection that closed the route was evaluated at the wrong place.
What it costs, and what it requires. The transfer is not free: about 15.6% of the initial budget is handed to the rising material in the base calculation, about 16.5% in the coupled solution; at release, with the core included, the Moon’s orbit holds about 17% of the budget (17.0–17.1%; 17.7% is the share for the pear alone, without the core). These are transfers within the system, not losses from it. The route also sets a condition that Paper 2 states as a requirement: the parent must still be nearly uniform inside, with at the start of the transfer, where measures how the mass is spread between centre and surface (0.4 for a uniform sphere, about 0.33 for today’s Earth with its core). An Earth whose iron had already gathered stores less spin at the same day, and the budget would not close.
What we now have: seven measured properties, and an eighth — the tilt — that a lifted Moon must produce from its geometry; a collision model that obtains each of them by an addition; and an objection to lifting that disappears when the speed condition is evaluated at the corotation line instead of at the surface. Part B now tells how the Moon got there.
The process, in stages 0–8
what happened, in what order, and with what numbers? The answer: one continuous process in nine stages, numbered 0 to 8, from a hot, fast-spinning Earth to the Moon and the Earth of today. Each stage is computed or measured in one of the later papers, and each carries one number that the reader can hold on to. The stages run in the environment of the process set out at the opening of this paper: an Earth of kg — today’s Earth and Moon together — expanded by heat to a volumetric radius of 6,517 km, turning once in 5.5 hours, about 4.5 billion years ago.
This Part tells the model as one story, from beginning to end, without stopping to argue each step; the arguments are in the papers named at each stage, and Part C presents them paper by paper. The story covers about 600 million years from the start of the bulge to the release of the Moon at 3.873 billion years ago (3.873 Ga). The division of that span is a rough scenario value, not a measured duration: roughly 400 million years (Myr) for the bulge and the pear, about 100 Myr of flattening, and about 100 Myr from the end of the flattening to release (Paper 3, environment table; Papers 4, 6, 7). The one fixed point in time is the end: 3.873 Ga is the age at which the clocks of the norites of South Pole–Aitken were reset, and in the model that reset is the separation itself (Paper 8). Figure B.1 lays the stages on this time axis.
How long the Moon was “attached” depends on what one calls the Moon, and the answer should be stated rather than assumed. If the Moon is its material, it began to gather when the bulge began, about 600 Myr before release. If it is a body seated on the tip of the pear, it begins at stage 2. If it is a body that holds itself together by its own gravity, it begins only at the start of the inward rounding, at about 13,000 km from the Earth’s centre (stage 4). All three are the same process seen from different points; the series uses the first when it speaks of the window of construction.
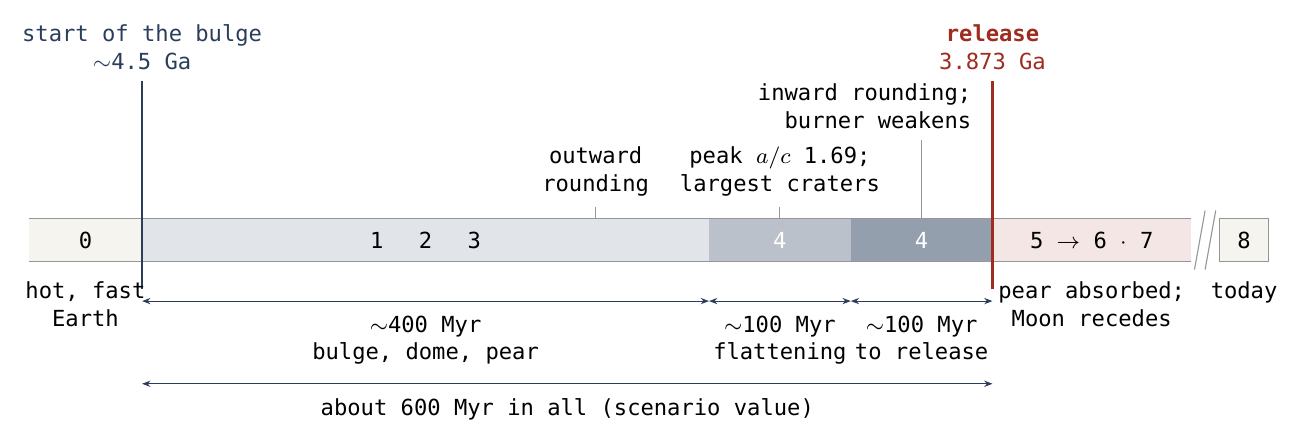
The figure is read from left to right. The pale band before the start is stage 0, the hot Earth before the bulge. The longest interval, about 400 Myr, holds stages 1–3: the bulge, the dome and the pear. The two darker intervals hold stage 4: the body flattens with the spin and makes its largest craters, then rounds inward while the heat beneath its far side weakens. The red line is the release, stage 5; to its right the pear is absorbed into the Earth (stage 6) and the Moon recedes (stage 7), until the Moon and the Earth of today (stage 8).
A word on numbering. Paper 3 numbers its own stages from the outside of the body: its stage 1 is the flat shell, its stage 2 the body on the tip of the pear, its stage 3 the outward rounding. In this Part the stages are numbered for the whole process, from 0 to 8, and the flat shell belongs to stage 1, the bulge.
B.0Before the bulge — the hot, fast Earth
The process starts from an Earth that is not today’s Earth. It holds the mass of the Earth and the Moon together, kg, since nothing is assumed to escape: the whole Moon was once part of the Earth. It is hot throughout, its iron still descending toward the centre to form the core, and the heat has expanded it by about 120 km to a volumetric radius of 6,517 km — about 6,721 km at the equator and 6,128 km at the poles, because it spins fast (Paper 2). It turns once in 5.5 hours. Its outer shell is sialic — made of sial, the light upper layer rich in silicon and aluminium, which lies over the denser sima, rich in silicon and magnesium — and it is cold and stiff (Paper 3, §B.1). An atmosphere of vapour surrounds it.
The angular momentum. Angular momentum is the quantity of rotation — mass times sideways speed times distance from the axis — and it is conserved when no outside twist acts. This parent holds , a little more than the Earth and the Moon hold together today: 0.7% more in the scalar sum, 1.5–2.5% against the vector sum at the angles tested (Paper 2, §A.6). The sign matters: four and a half billion years of tides raised by the Sun take angular momentum out of the system, so the parent must have had a little more than today, not less. The budget closes only for a parent still nearly uniform inside: its moment of inertia factor , the measure of how far its mass lies from the axis (0.4 for a uniform ball, smaller when mass gathers at the centre), must be at least about 0.397. The construction must therefore begin early in the organisation of the core, while little of the iron has yet gathered at the centre (Paper 2, §D.3). That organisation is one long, continuous process without sharp limits: a little at the start, more while the pear grows, and a very long phase with the return of the pear that continues to this day.
The corotation radius. A point on the surface of a spinning body moves sideways at a speed that grows with its distance from the axis; the speed a free circular orbit needs falls with distance. The two are equal at one distance, the corotation radius: there a body that simply turns with the Earth already moves at the speed of a free orbit. For the 5.5-hour parent it lies at (Paper 2, §A.2.1). The number matters because it removes the old difficulty of lifting a moon from a planet. At the surface of this parent the rotation gives about 2,133 m/s while a circular orbit needs about 7,701 m/s; a body released there lacks some 5,568 m/s and falls back. At the corotation radius nothing is lacking: the speed is already there, supplied by the spin. The whole model is the answer to one question — how the Moon’s material got from the surface to that line while still turning with the Earth.
The asymmetry and the source pressure. The descending iron does not descend evenly. An asymmetry of the interior concentrates the upwelling into one region, a preferred feed region north of the equator, which Paper 3 calls Lobe A (§A.4). At the source the parent holds a pressure made by the weight of everything above it: One gigapascal (GPa) is about ten thousand times the air pressure at sea level. The upwelling is a pressure, not a force: open a path from the deep interior and the squeezed material rises along it, as toothpaste rises when the tube is pressed. Lifting deep melt of 3,500 kg/m³ to the corotation radius costs 139.78 GPa and leaves 10.49 GPa to spare; the test passes for any deep melt lighter than about 3,864 kg/m³ and fails above it (Paper 3, §A.9–A.10). A melt rich in water and other volatiles meets that requirement; a dry one does not. The volatiles are what make the Moon possible.
What we now have: a hot, expanded, fast-spinning Earth, still nearly uniform inside, with a corotation radius at 15,818 km and a source pressure of 150 GPa that can lift a light, volatile-rich melt to that radius.
B.1The bulge — the pressure from inside
The pressure lifts one region of the Earth’s surface into one bulge (Paper 3, §C.7). Before the bulge stands high, the sial over the region still lies flat over an active feed, and this flat stage is where the record of the Moon begins. Deep material reaches the shell through openings and is thrown out through them at kilometres per second. Part of it comes back down on the shell (Paper 3, §B.1; Paper 6).
Out and back at the same speed. A ball thrown straight up, with no air to slow it, returns to the hand at the speed it was thrown. Material thrown up from the parent does the same: 5 km/s out, 5 km/s back. The spin adds one thing. Thrown straight up, the material keeps the sideways speed it had on the surface, but as it rises that speed carries it through a smaller angle per second than the surface turns — a child who walks outward on a turning roundabout falls behind the boards beneath her. When it comes down, the ground has moved on eastward, and it lands to the west of the opening. For a throw of 5 km/s the flight rises 1,932 km, lasts about 28 minutes and lands about 1,032 km west — about a thousand kilometres (Paper 6, §K.1).
A landing of 5 km/s is a shock. When two pieces of the same material meet head-on at 5 km/s, the pressure behind the shock front is the density times the speed of the front times the speed of the material behind it: in basalt, 2,700 kg/m³ 6,750 m/s 2,500 m/s, which is (45.6 GPa; Paper 6, §J.2), above the pressures at which the minerals of basalt begin to record shock. At 2 km/s the same calculation still gives about 13 GPa. Returning material therefore makes craters of the kind the literature reads as the mark of a body from space. Gravity does not soften the landing; it gives back on the way down exactly the speed it took on the way up.
The oldest craters of the Moon are made now. They are made on the Earth, in a shell that is still the Earth’s, before the Moon exists as a body. Nearly all the Moon’s craters, some 99%, are of returned terrestrial material; foreign material, if it is found at all, will be in very small amounts, space dust apart (Paper 6). This matters for everything that follows: the Moon’s oldest surface did not form on the Moon. It formed here, and was carried up.
The shell is gathered. The shell that will become the Moon’s skin is drawn in from a region of Pacific size — about m² without its marginal seas, m² with them, 1.4 to 2.4 times the surface of the upper dome it will cover — as a cloth laid flat on a table gathers inward when its middle is lifted (Paper 3, §B.1). The shell does not slide far: this inward gathering belongs to the flat stage, before the dome exists.
What we now have: one bulge rising under a stiff sial shell; openings in that shell throwing material that returns at the speed it left, 5 km/s out and back, 28 minutes in the air, about a thousand kilometres to the west, landing at 46 GPa; and a shell already carrying craters before the body exists.
B.2The dome — a body on a broad tip
The bulge grows into a body seated on the tip of the Earth’s rising extension. The tip is broad: the contact between the body and the tip is 6,000 km across. The body is a squashed ball on that tip, in two parts. Its lower dome lies on the curved tip and follows it — the tip, curved with a radius of about 4,000 km, enters the body some 1,350 km under the middle of the contact, as a head pushes up into a cap pulled down over it. Its upper dome rises above the lower one and stands (Paper 3, §B.2). Two-thirds of the surface is the upper dome ( m², 67%), one-third the lower dome on the tip ( m², 33%).
The density follows from the shape. The mass is the Moon’s mass; the shape fixes the volume, m³, about two and a half times the Moon’s volume today; and the two together fix the density: 1,300 kg/m³. The taller the dome over the same contact, the lower the density — a dome as high as a hemisphere gives about 2,000 kg/m³, and the lowest possible dome, 2,450 km, gives today’s 3,344 (Paper 3, Figure 7). The adopted tall dome is not a free choice. 1,300 kg/m³ is the foamed state that the pressure test of stage 0 requires — a melt full of gas bubbles, lighter than the material it is made of, as rising dough is lighter than its flour and water — and it is the density at which the flattening of stage 4 begins (Paper 7). The earlier version of this paper drew the stage as a single hemisphere on a base 6,000 km across, with a surface of 56.5 million km² ( m²), three times the Moon’s far hemisphere (Paper 2, E12; Paper 11, §B.3). Paper 3 has replaced it with the two domes on a curved tip; the density, 1,300 kg/m³, and the order of the surface are kept, and in both pictures neither number is chosen: they follow from the base.
| The same lunar mass | On the tip (stage 2) | Sphere at release | The Moon today |
|---|---|---|---|
| Whole surface | m² | m² | m² |
| Volume | m³ | m³ | m³ |
| Radius | — (two domes) | 1,890 km | 1,737 km |
| Density | 1,300 kg/m³ | 2,600 kg/m³ | 3,344 kg/m³ |
Table B.1. One mass in three states (Paper 3, §B.2). Read from left to right: the body grows smaller and denser.
The table is the history of the Moon’s density in three columns. The same mass is large and light on the tip, a sphere of 1,890 km at release, and today a sphere of 1,737 km at 3,344 kg/m³. The shading deepens down the rows toward the density, the quantity that drives the whole sequence.
The body is still held. At this stage the body’s own gravity — the pull of its own mass, holding it together — is small against the tidal stretch of the Earth, the difference between the Earth’s pull on its near and its far side. Their ratio is about 0.11: the body’s own pull is about a ninth of the stretch (Paper 3, §B.2). The body is therefore held by the Earth; it is a dome on a tip, not yet a body of its own.
The shell rises with it, and slides to the tip. The stiff sial shell of stage 1 rises with the body of the pear, as the skin of a balloon rises with the balloon; as it rises it slowly separates from what lies beneath and slides up the pear to its tip, into the body, where it becomes the surface of the upper dome and then the Moon’s crust (Paper 3, §B.3). This is why the tip separates as a body of its own. The requirement that makes it a shell is stiffness: a viscosity of about Pa s or more — viscosity is the resistance to slow flow; honey has more than water, and a cold shell vastly more than either — which keeps a crater 100 km wide from sagging in ten million years at the gravity of the parent, 8.25 m/s² (Paper 3, §B.6). A shell that holds its craters carries them: a crater made on it before it was covered or carried goes with it, and keeps its size. The thick crust of the far side is built of many layers of this sial, which migrated up to the tip during the bulge, driven by the forces of the spin, and was compacted there, together with material that returned to it again and again (Papers 3, 11). How deep it reaches is not fixed here; it may be much deeper than has been assumed.
What we now have: a light body of the Moon’s mass, 1,300 kg/m³, seated as an upper dome over a lower dome on a tip 6,000 km wide, the upper dome 3,650 km high; still held by the Earth; and wearing the Earth’s sial shell, with its craters, as its skin.
B.3 The pear — where it stood, and how it leaned
Beneath the body, the Earth itself is drawn out. The pressure draws the one bulge into a pear of the Earth’s own material: broad at its base on the Earth’s surface, narrowing outward, with the body on its tip (Paper 3, §C.7). The pear is not a pipe through which material is pumped; it is a body of the Earth, standing.
It is held by the Earth. A narrow passage cannot do this work: Paper 3 shows that a cylindrical passage of no mass fails the balance of loads, which passes only above a radius of about 1,000 km (1,017 km), where the passage already holds about half a lunar mass (§A.13). The connection must be broad, hot and massive, and it carries its sideways load by its shape. The pear meets that: it is a single arc without a waist. It is part of the Earth, and it is held by the Earth’s gravity like any other part of the Earth; it is not thrown out, because its speed is not a throwing speed and it has not crossed the corotation line. Its width is bounded from above by the energy of lifting it:
| Base of the pear | Mass of the pear | Work to lift it | |
|---|---|---|---|
| 9,000 km | 8.8 lunar masses | J | |
| 10,000 km | 10.4 lunar masses | J | |
| 11,000 km | 12.1 lunar masses | J | the order of the core’s formation energy |
Table B.2. The width, mass and lifting work of the pear at release (Paper 3, §C.7). The orange deepens with the cost.
A wider base holds more mass, and lifting more mass costs more work; at 11,000 km the work reaches the order of the energy released by the descent of the iron into the core, of order J. The series takes the base as 9,000–11,000 km. From that base width Paper 3 derives the mass of the pear: about nine to twelve lunar masses — about nine, some 11% of the Earth’s mass, for the 9,000-km base (Paper 3, §C.9; Paper 11, R10); Paper 9 allows seven to twelve. Lifting it costs about J, more than five times (about 5.4 times) the lift of the Moon itself (an earlier version said about six times) (about J). The descending iron that drives the upwelling is the same evolution that pays for the pear. While the pear stood, the Earth’s core was pulled 270–370 km toward it (Paper 3, §E.5).
It grows, and its tip narrows. Between the start and release the pear roughly doubles in length, from about 4,000 to about 8,700 km above the Earth’s surface; its tip narrows by half, from 6,000 to 3,000 km, as the body on it rounds outward (stage 4). The whole pear lies inside the corotation line. Along it the effective gravity points toward the Earth everywhere, so the pear is compressed along its length, has no waist to pinch, and — when the Moon has gone — nothing of it can stay in orbit (Paper 3, §C.7).
Where it stood. The base of the pear stood on the Earth’s surface near Kiritimati, in the Line Islands of the central Pacific, above the Pacific large low-velocity province (LLVP) — a broad region at the bottom of the mantle, seen in seismic images, through which earthquake waves travel more slowly than in the mantle around it. The point near Kiritimati lies inside the slow region in all five cluster models tested and within the contour of two tomographic models, SMEAN () and SMEAN2 (); the centre of the province lies 1,476–1,657 km south-south-west of it (Paper 3, §E.4).
How it leaned. The pear did not stand upright. Its outer part, carried away from the axis, had to move faster sideways to keep up with the Earth’s turn, and lagged — as the arms of a skater lag when she spreads them — so the whole pear tilted back, westward, its tip and the Moon on it trailing (Paper 3, §C.8). It leaned north as well, from a base near the equator to a tip at about 22.5°N, the latitude of release of Paper 4; the rotation does not give that lean, since its sideways push is always toward the equator; the oblique feed from the northern source does (Paper 3, §B.1). The pear also slowed the Earth: carrying material outward, it took angular momentum from the Earth’s spin (stage 5).
The footprint of the tip is seen today. When the pear was gathered back into the Earth, the tip came down to the west of the base, and it left its outline on the floor of the North Pacific: two bends where the outermost stripes leave their parallels and turn toward each other, at 23.8°N 164.9°E and 5.3°S 173.2°E (Paper 9, §C.1). The two bends are about 3,760 km west of the base (3,762 km by the coordinates; an earlier version gave 3,770), on the trailing side. The base and the southern edge of the tip lie on the equator of the stripe system; the centre of the tip lies about 15° north of it (Paper 9, §C.2). This footprint is not the 22.5° of release: the release latitude is the direction of the Moon’s centre seen from the Earth’s centre while the pear stood, whereas the footprint is where the tip came down as the pear was gathered back, in the frame of the stripes — two different quantities in different frames. The width falls between the 3,000-km contact at release and the 3,650-km dome: the region the stripes turn toward is as wide as the tip. Inside it, a mirror image of the near side at the size of the Moon on the tip — larger than today’s Moon by the factor 1.37, the cube root of 3,344 over 1,300 — places Serenitatis, Imbrium and the contact centre within the footprint (Paper 9, §C.3). All these positions are given in today’s frame; how the Earth’s axis has moved since is not solved in the series and is left to future work.
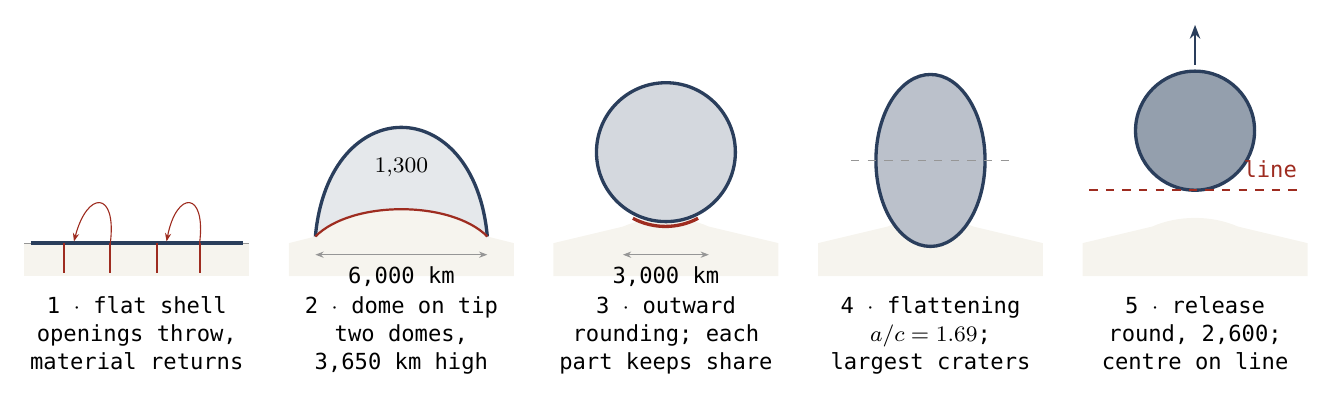
Figure B.2 is the story of stages 1–5 in five pictures. Follow the navy line: it lies flat in the first, becomes the skin of the upper dome in the second, and stays the skin of the body through the rounding, the flattening and the release. Follow the red line: the contact narrows from the 6,000-km lower dome to the 3,000-km disc and lets go at the corotation line.
What we now have: a pear of nine to twelve lunar masses, its base 9,000–11,000 km wide near Kiritimati above the Pacific LLVP, held by the Earth’s gravity as part of the Earth, inside the corotation line, leaning back to the west and north, with the body on its tip; and on the floor of the Pacific, between two bends of the stripes, the footprint of that tip.
B.4The rounding — outward, flattened, inward
While still attached and turning with the Earth, the body changes its shape three times: it rounds outward, it flattens with the spin, and it rounds inward. Each change writes something on the Moon that is read today: the outward rounding writes the near side and the far side, the flattening the largest craters, the inward rounding the crowded poles (Papers 3, 7).
The outward rounding: each part keeps its share. As the body’s own gravity grows, the squashed body on the tip becomes a ball, at constant volume. The contact narrows from 6,000 to 3,000 km and stays attached. The ring of the lower dome between the two — the annulus — peels away from the tip, from the rim inward, with the sial it sat on: the sial slides up the pear toward the tip — the direction of the outward sorting — and goes with the body; the slide is eased under shear by the “lubricated” layer between the sial and the sima. The everyday picture is a half-deflated ball pressed onto a rounded stand and then inflated: its wall peels from the stand from the edge inward (Paper 3, §C.4a). About 1,500 km of inward motion of the contact’s edge, on a weak interface. The peeling from 6,000 to 3,000 km, and the rounding with it, took millions of years: slow at the start and faster toward the end — hundreds of millions of years in the early part, tens of millions in the late part. Where each part of the surface ends up is fixed by one rule: in the outward rounding each part keeps its share of the surface (Paper 3, §B.4).
| Part on the tip | Share | From the sub-Earth point | On the Moon |
|---|---|---|---|
| The contact, 3,000 km | 7% | 0°–31° | a near-side cap about 1,900 km across, exposed only at release |
| The peeled annulus | 26% | 31°–70° | the belt, exposed during the outward rounding |
| The upper dome | 67% | 70°–180° | the far side, exposed from the start, its craters carried up |
Table B.3. The translation rule (Paper 3, §B.4). Red, orange, blue: from the part that touched the Earth to the end, to the part open to space from the start.
A share of a sphere’s surface measured from one point is a fixed angle from that point: a cap holding 7% of the surface reaches 31° from its centre, one holding 33% reaches 70°. The point is the sub-Earth point, the point of the body that faced the Earth directly. The ball has a smaller surface than the squashed body — against m², a factor 0.68 in area and 0.83 in length — but since every part keeps its share, the change is the same everywhere and moves no zone and no crater relative to another, as a photograph reduced in size keeps every figure in its place. The rule fixes the size of the zones; the map fixes where they lie today. The contact is centred on the tip of the pear, at about 22–24°N; the tests of the series measure the three zones about 24.1°N 335.2°E, the centre of the contact as the author outlined it, 34.0° from today’s sub-Earth point (Paper 11). Read on the map, the regions nest: the base of the bulge, 6,000 km, centred at 16.6°N 13.1°E, holds 99% of the area of the near side’s dark mare basalt; the last contact, 3,000 km, holds two-thirds of that area (66%) — shares of area, not counts of maria (Paper 5); and Mare Imbrium, the opening through which the feed entered, lies inside the contact (Paper 3, §B.4). The earlier version of this paper placed the edge of the contact cap at about 41°; the share rule places it at 31°.
The flattening. A soft body spinning fast takes the Maclaurin figure, the exact equilibrium shape of a spinning uniform fluid: wider at the equator, lower at the poles. The light body turning with the Earth once in 5.5 hours at 1,300 kg/m³ flattens strongly, because its own gravity is weak against the spin: where is the equatorial radius divided by the polar radius, 1.00 for a sphere (Paper 7, C.1). The distance 12,994 km is the rigid Roche limit for a body of 1,300 kg/m³ — the distance outside which a body’s own gravity can hold it together against the Earth’s tidal stretch — so the body begins to hold itself, and to round inward, at the same distance at which it becomes able to survive (Paper 7; “about 13,000 km” in Paper 3). In the flattening most of the craters form, and the largest: the separation of the deep material has advanced, the material thrown out is light and rich in water, and the poles, formed in the outward rounding, receive their share (Paper 3, §B.6). Large outflows belong to the flattening, and the far-side crust is built in it layer upon layer, from the sial and from the returning material.
The inward rounding. As the body rises along the pear it densifies; its gravity grows; the flattening relaxes and it rounds inward. The shell, stiff, does not shrink with the surface: the craters on it keep their size, and the surface between them closes, most at the poles — as the spaces between buttons sewn on a cloth close when the cloth is gathered, while the buttons stay the same size (Paper 3, §B.6; Paper 7).
| On the tip of the pear | Density | Earth day | Polar crowding it leaves | |
|---|---|---|---|---|
| Start of rounding, 13,000 km | 1,300 | 5.50 h | 1.69 | 1.59 |
| On the pear, rising | 1,600 | 5.55 h | 1.44 | 1.38 |
| On the pear, densifying | 2,000 | 5.62 h | 1.30 | — |
| Far side reaches the line | 2,300 | 5.70 h | 1.24 | — |
| Late attached stage | 2,600 | 5.77 h | 1.20 | 1.17 |
| Centre on the line — release | 2,600 | 5.77 h | 1.04, round | 1.0 for later craters |
| Today | 3,344 | — | 1.00 | — |
Table B.4. The figure of the body along the climb (Paper 3, §C.7; Paper 7). The navy fades as the flattening disappears; the last column is the pole-to-equator crater ratio that rounding from that figure leaves (Paper 7).
Read the table downward: the density rises, the Earth’s day lengthens slightly, and the axis ratio falls from 1.69 toward 1. A crater made at the peak of the flattening is carried through the whole rounding and ends 1.59 times denser in the polar caps than in the equatorial belt; one made late, on a figure of 1.20, ends 1.17 times denser; one made after release, on a round body, not denser at all. The prediction is therefore not one number but a range that rises with the age of the craters, and so with their size, since most large craters formed early. It is measured. In a clean count — the maria and South Pole–Aitken removed on both sides, so that old ground is compared with old ground, caps of 30° against the belt within 15° of the equator — the pole-to-equator ratio is — 1.09 for 20–30 km, 1.15 for 30–40, 1.26 for 40–60, 1.53 for 60–100, and 1.84 0.38 for the few of 100–300 km (Paper 7, D.1–D.2). The order and the range are what the model predicts. The craters did not shrink with the surface: the diameter at which simple bowls give way to complex craters with central peaks lies at 16.5–17.1 km on the far side and 14.3–15.1 km on the near, with no difference of scale between them, and the polar craters are, if anything, the larger (Paper 3, §B.6; Paper 7, §D.5).
The burner. While the body was attached, its near-side openings were fed from the Earth through the contact, and opposite them, beneath the far side, heat gathered: the burner of Paper 8 — heat from the Earth’s interior that crossed the attached body along the line of the openings and warmed the far side from below, as a flame warms the base of a pot. It had two exits, named after the near-side openings they face: Imbrium, the main one, and Serenitatis, the secondary. The heat reached the surface where the crust was thin. There the region rose into a dome; its softened crust slid outward to the sides, where it piled into a thickened ring; volatile material was driven off; the layers of returned material were cooked and compacted; and iron-rich material from the Earth’s interior came up to the base of the region. The craters on it were erased or relaxed: within 10° of the centre of South Pole–Aitken, on ground cleaned of the lava plains, the maria and a 200-km halo around each, the density of craters of 20 km and more is 0.51 of that just outside the rim (Paper 8). The melt that solidified above the burner is dated in the Chang’e-6 norites: million years.
The dome of SPA lies south of both exits. The position of the pear and the forces of the Earth’s rotation — the horizontal push inside the rotating pear — carried the heat out south of the point opposite the exits. On the flattened figure the centre of the dome lay about 17–21° from them (17.0° from Serenitatis, 21.2° from Imbrium; the exits are the points opposite Imbrium, 37.6°N 340.0°E, and Serenitatis, taken here at 27.3°N 18.4°E); the change from the flattened figure to the sphere opened this to the 24–29° of today (24.1° and 29.2°) (Paper 8, §C.3–C.4). The burner weakened as the peeling narrowed the passages: Serenitatis peeled away first and was cut from the Earth; Imbrium stayed connected and was detached last. After release the heat was the Moon’s own, together with the radiation of the nearby Earth, which faded as the Moon receded; everything then cooled slowly, the maria first and the Moon’s centre later, and the dome cooled, contracted and collapsed into the deep basin seen today — as a soufflé, raised by heat, sinks below its rim when it leaves the oven.
The far side seals; the near side stays open. The far side, exposed to the cold of space, lost its heat and sealed its old openings early, before release; the pressure beneath them was trapped (Paper 5). The near side faced the hot Earth: radiation from an Earth of about 2,000 K, with a view factor of 0.205, held the near-side surface near 1,345 K, above the solidus — the temperature at which the material begins to melt — so the near side could not freeze while attached, and its openings stayed open (Paper 5, §H.4).
What we now have: a body that rounded outward and so wrote its near side, belt and far side; flattened to an axis ratio of 1.69 and made its largest craters; rounded inward, crowding its poles to 1.20 0.05 and up to 1.53 for the larger craters; and, beneath its far side, a burner with two exits that raised and then dropped the dome of SPA, south of both exits, and weakened as the passages narrowed toward release.
B.5 The release — the centre of mass on the corotation line
Two processes act on the Earth’s spin while the pear stands, in opposite directions (Paper 2, §A.4). The lengthening pear carries material outward and slows the Earth, as a skater slows when she spreads her arms: alone, it would lengthen the day by 0.94 h, from 5.50 to 6.44 h, and move the corotation line from 15,818 to 17,569 km. The iron gathering into the core brings mass toward the axis and speeds the Earth up, as the skater speeds up when she pulls her arms in: with the core organised as Paper 2 computes it (concentration ), it shortens the day by 0.67 h. Together: (16,331 km for a body of negligible mass; 16,399 km with the Moon’s own mass in the two-body orbit; Paper 2, §B.1; Paper 3, §C.8). 16,399 km is about 2.6 Earth radii. Off the equator a body turns on a smaller circle about the axis and must be carried a little farther out before its speed matches an orbit: the line lies at , 888 km farther out at 22.5° than on the equator. The earlier version of this paper placed the end state at 17,570 km with a 6.44-hour day — the pear alone; with the core taken into account, the release state of the series is 5.77 h and 16,399 km.
The body is round. At release the body has the density 2,600 kg/m³ and a radius of 1,890 km. It is round, its outer shell rigid: a shell of rigidity 10 GPa or more holds its axis ratio to at most 1.04 (Paper 2, §B.7). The flattening and the rounding are over; they happened while it was attached. Its near point lies about 14,509 km from the Earth’s centre and its far side about 18,289 km; the Earth itself, flattened by its spin, is 6,701 km in equatorial radius (a little less than the 6,721 km of the 5.5-hour parent, since it now turns more slowly), so about 7,800 km separate the Earth’s surface from the Moon — the length the pear bridges (Paper 2, §B.1).
Why the centre of mass, and why the line. A body moving as one piece responds to the sum of the forces on it, as if all its mass were at its centre of mass. Inside the line the Earth’s pull is larger than the circular motion needs, so the body presses on the contact: the contact is compressed and holds. The far side reaches the line first — at 2,300 kg/m³ and a 5.70-hour day (Table B.4) — but as long as the centre is inside, the body still presses inward. When the centre crosses the line the sum reverses, and the body begins to pull on the contact (Paper 3, §C.5).
The body is pulled off. The contact is a hot, viscous layer, not a surface that breaks. It resists, but little: the body begins to peel from it as its centre of mass reaches the corotation line and is detached slightly beyond it, about 210 km past the line. It is not released gently; it is pulled outward with force — which is also what drew up the spatula ridges on the floor beneath the tip (stage 6). The internal pressure beneath the body assists. At 22.5° the radial load vanishes on the line and a sideways load of N remains, toward the equator; it is carried by the broad contact, not by a neck (Paper 3, §C.2).
Carried, not thrown. The pear lifts the body and carries it round. On the equator, at 16,399 km, the sideways speed the rotation has given it is 4.96 km/s, and the speed of a circular orbit there is the same 4.96 km/s: that is what “on the line” means (Paper 3, §C.8). A body thrown from low on the Earth has height but not the sideways speed of an orbit: thrown at 7 km/s from 8,991 km, the top of a body sitting low on a 5.5-hour Earth, it rises to 24,433 km and comes back to 854 km from the centre, deep inside the Earth. Only the carried body arrives with the speed it needs.
The budget closes. The pear passes the Moon about a sixth of the system’s angular momentum, taken from the Earth’s spin. At release the system holds — a surplus of 0.7% in the scalar sum, with the sign that solar tidal loss requires — while the classical route of fission, which needs the Earth to spin itself apart, needs 2.74 times today’s (Paper 2, §B.6, §A.6.5). The objection that closed the fission route — a budget about four times too large — was computed at the Earth’s surface, where release would need speeds so great that they would break the Earth apart. In this route the pear raises itself to the region of corotation and releases the material at its tip, here the Moon: the pear grows until the material at its tip detaches, and then the sorting draws the pear back in. The classical objection computed at the Earth’s surface; this route computes at the tip of the pear.
The body survives. The Moon’s centre lies far beyond the rigid Roche limit of a body of 2,600 kg/m³, 10,314 km — about 7,200 km outside it at 17,496 km (Paper 4). The fluid limit, the one that applies to a body with no strength, lies farther out, at 19,971 km; the rigid, round body is held by its shell, and the series requires that its interior be stiff enough to pass the – years it spends inside that distance (Paper 2, §D.3).
What the release does to the Moon. The 3,000-km contact peels from the tip. Over it the heat had already melted the sial away and smoothed the surface; the body leaves with the shell over its far side, the peeled sial over its belt, and over the contact a surface smoothed by heat and gravity (Paper 3, §C.4a). The near-side maria were, until now, open passages of the pear’s interior: through them the Earth’s pressure passed from the Earth, through the pear, into the Moon, and through the whole attachment they stayed hot, carrying magma from the pear into the Moon. At release that passage is cut. The maria do not freeze at once: at detachment they are hot and of low viscosity, which is why their floors are smooth, like a frozen lake; they freeze only after detachment, slowly and from the outside inward, over hundreds of millions of years to one or two billion, kept warm by the Moon’s own heat — not by the Earth’s pressure — and at first by the radiation of the nearby Earth. Their floors therefore froze after nearly all the returning material had already landed — Mare Imbrium holds 11 craters of 20 km and more per million km² against 205 on the highlands (Paper 5). The contact maria, which froze last, are the cleanest.
When. The norites of South Pole–Aitken crystallised above the burner million years ago; a later event reset their clocks at — strong enough to restart the radioactive clocks, not to make the material anew. In the model that event is the separation itself, the end of the attached stage (Paper 8, B14–B15). It falls at the end of the window of construction, as the model requires.
What we now have: a round, rigid Moon of 2,600 kg/m³ and radius 1,890 km, pulled off after its centre had crossed the corotation line — 16,399 km on the equator, 17,287 km at 22.5° — on a 5.77-hour Earth, with the speed of a circular orbit already given to it, the angular momentum of the system 1.007 times today’s, the near-side maria cut from the Earth’s pressure and still hot, and the date 3.873 Ga.
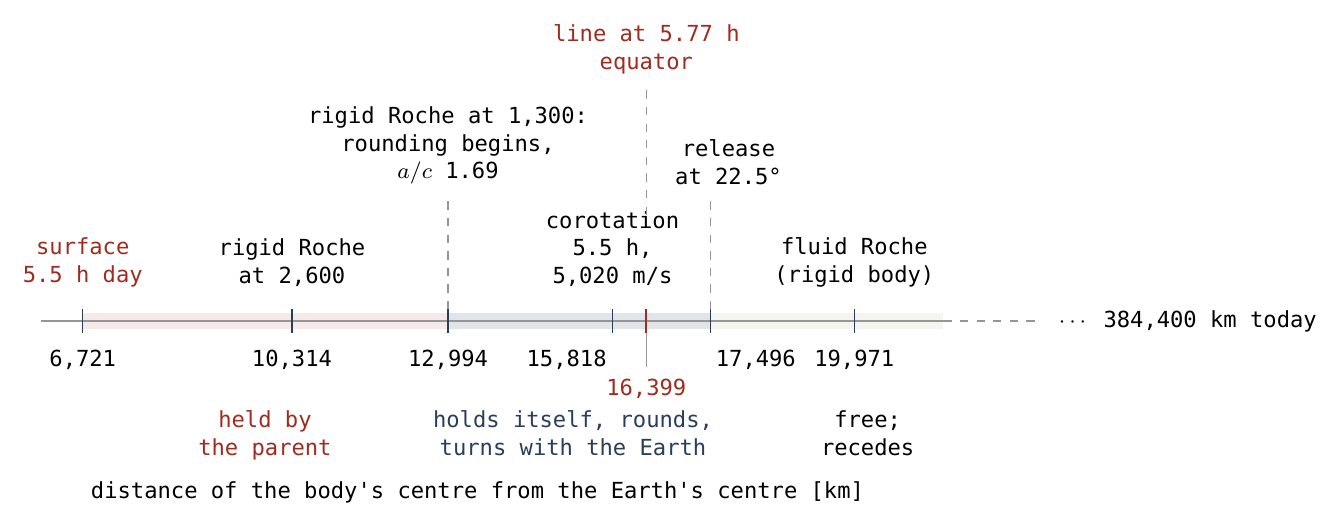
Figure B.3 is the same story as Figure B.1, told in distance rather than in time. Look first at the three bands: the red band, where the body is held by the Earth; the navy band, which begins at 12,994 km, where a body of 1,300 kg/m³ can first hold itself and the inward rounding begins; and the pale band beyond the release at 17,496 km, where the Moon is free. Then look at the two lines near the middle: the corotation line of the 5.5-hour parent, 15,818 km, and the line of the 5.77-hour Earth at release, 16,399 km. The fluid Roche limit lies beyond the release; the Moon does not obey it, because at release it is rigid.
B.6 The fate of the pear — absorbed into the Earth
The release of the Moon does not make the pear collapse or return. The sorting acts on the pear whether the Moon is on it or not, and after the release it gathers the pear back into the Earth over tens to hundreds of millions of years. The pear does not leave the Earth: it is gathered back into it and absorbed. Since all of it lay inside the corotation line, none of it can stay in orbit; no remnant of the connection is left attached to the Moon or circling the Earth (Paper 3, §C.9; Paper 11, R10). The mass moves from high outside the Earth to deep inside it, and the potential energy it gives up enters the Earth as heat. The absorption leaves three marks, each in its own place.
The heavy part sank to the base of the mantle. The pear worked as a settling column: along it the effective gravity pointed toward the Earth, so heavy, iron-rich material sank back while light material rose to the tip — which is why the Moon kept only a small core. After release the heavy part of the pear went down to the base of the mantle beneath the base of the pear, where the Pacific LLVP stands today; the position test passes in every model examined (Paper 3, Part E). We propose — with reservation, since the nature of the deep provinces is still open and the Pacific one may in part be core-related material that did not finish sorting — that this province is largely the returned pear. The model predicts the Pacific province to be denser and richer in iron than the African one, lower and broader. The Earth’s core, pulled 270–370 km toward the pear while it stood, returned as the pear was gathered back (Paper 3, §E.5).
The leading wall was folded into the stripes. The Earth turns from west to east, so the eastern side of the pear was its leading side, pushing into the rotation, and it was stretched in that one direction for as long as the pear stood. When the pear was gathered back, that wall was smeared along the floor in the direction of the rotation and folded — the long, straight, parallel stripes of the North Pacific: Mendocino, Pioneer, Murray, Molokai, Clarion and Clipperton (Paper 9). They are parallels of one equator, and the base of the pear lies on that equator, 1.6° from it. They pass beneath the volcanic ridges that cross them, unbroken: they were made by folding from the sides and from below, not cut from above. And they are as long as the pear was tall: — from the centre of the tip to the eastern end of Clipperton, 4% shorter than the pear, whose length runs from the Earth’s surface to the corotation line at release (Paper 9, §C.4). A wall laid down along the floor covers ground about as long as it was tall, as a felled tree lies across a length equal to its height.
The back was crumpled into the arcs. The western side, the back of the pear, was gathered back in no order: the crumpled arcs of the western Pacific and Indonesia — the Banda arc 8,100 km from the base, the Philippines and Sulawesi 9,040–9,070 km, Java 10,300 km, again where the length of the pear reaches (Paper 9, §B.8). East of the base the marks are parallel and straight; west of the tip they are curved, crowded and turned in many directions. As the tip itself was pulled away, the viscous layer between it and the floor was drawn up into ridges, like the ridges a spatula leaves on a wall: in the region of the detachment all the mountains were pulled up from above — these are the spatula ridges, the Marshall–Gilbert–Tuvalu chains in the west and the Line Islands in the east (Paper 9, Part D). Mountains pushed up from below are to be sought elsewhere, not in that region.
The equator of the stripes. Fitted together, the stripes are parallels of an equator inclined to today’s equator by at least 10° (first fit 11°, crossing today’s equator at 159°W, near the base; up to about 20° fits almost equally) (Paper 9, §E.2). The stripes were laid down not while the pear stood but as it was gathered back, after the release; they record the equator of that time. Until then a mass of seven to twelve lunar masses had stood high above one side of the Earth; when it was gathered into the Earth, the Earth’s distribution of mass changed, and the Earth could begin to turn toward a new orientation. How far it turned, how fast, and about which line, is the study of the axes, which this series leaves to future work.
The Earth goes on throwing. The release did not end the Earth’s activity. Its openings went on throwing material; most fell back to the Earth, and part reached the Moon, then a separate body receding from a few Earth radii. To reach it the material had to leave ever faster. All of it was very hot: the large pieces came out first, and as the magma storm calmed, small pieces, still hot, went on being ejected (Paper 3, §C.11; Paper 6). The Moon kept the record. On the highlands alone, with every mare excluded on both sides so that the comparison is like for like, the near side — which always faces the Earth — carries 1.19 times as many fresh craters of 1–2 km as the far side (1.12–1.27), and the craters on the maria grade from large and melted to small and sharp (Paper 6, Study 9; Papers 3, 5). A flux of bodies from outside predicts no near-side excess. The Earth was the last scatterer of the small craters on the Moon.
What we now have: a pear absorbed into the Earth — its heavy part in the Pacific LLVP beneath its base, its leading wall in the stripes, 9,360 km against a pear of 9,680–9,800 km, its back in the arcs of the western Pacific and Indonesia — an equator of the stripes inclined at least 10° to today’s, and an Earth that went on throwing material at the Moon after the release.
B.7The recession — the orbit and its tilt
The tilt is the latitude. The inclination of an orbit is the angle between the plane in which the body goes round and the Earth’s equator. A body released while turning with the Earth at latitude moves eastward along its circle of latitude; the orbit it enters must pass through the Earth’s centre, because that is where gravity pulls; and a plane through the Earth’s centre and through a point at latitude , running eastward there, is tilted by to the equator: — three lines of algebra from , with no mass, no distance and no spin rate in them, and nothing to adjust (Paper 4, §A.2). Released at 22.5°, the Moon begins 22.5° tilted. A disk cannot do this: a disk of debris settles onto the equator and starts with almost no tilt, which is why the lunar inclination has been an open problem and why every remedy for it in the impact picture adds something to it.
The latitude. The adopted latitude, 22.5°, is that of the centre of the contact area, about 3,000 km across, on which the Moon sat; the upper end of the opening latitude, 25°, is a sensitivity case (Paper 4). The series does not claim that the body moved in latitude on its contact before release. The base of the pear stood roughly on the equator of that time; whether that equator is today’s is a question for the study of the axes, left to future work.
Nearly circular, and outward from the start. The latitude-corrected corotation line lies at 17,287 km; the Moon begins to separate as its centre of mass reaches it and is released about 210 km beyond it, at 17,496 km, when a little more than half of the body has crossed the line. There it moves slightly faster than a circular orbit needs: the release point is the perigee of a nearly circular orbit (, apogee 18,830 km). Had it been released on the equatorial line at that latitude it would have moved too slowly for a circle: its orbit would be eccentric (), released at its farthest point, and the Earth’s tide would at first draw it in. Beyond the line the Earth turns faster than the Moon goes round, the tidal bulge the Moon raises on the Earth is carried ahead of it, and its pull draws the Moon forward along its orbit, so the orbit grows: the tide pushes outward from the first moment. The Moon recedes from its first orbit (Paper 4, §B.2). After release its own spin follows its orbit: about 6.2 hours at release, 14 hours at 30,000 km, 41 hours at 60,000 km; the small bulge that the spin and the tide raise on the rigid body, an axis ratio of 1.03 at 30,000 km, fades to 1.00 at 60,000 km (Paper 7, environment table, after Paper 4).
The tilt decays. Carried outward by the tide, the inclination falls. The reduced law of Paper 4, , takes the 22.5° of release to (Paper 4, §D.1). From 25° the same law gives 5.788°; the latitude that returns the observed angle is 22.5° itself. The law is a reduced one: it does not integrate the path through the Laplace-plane transition — the distance at which the orbit’s slow turning changes from being set by the Earth’s bulge to being set by the Sun — or the Cassini state, and these are listed in Paper 4 as requirements.
The rate. The rate of recession falls very steeply with distance, as , because the tidal bulge weakens rapidly as the Moon moves away; nearly all the time of the journey is spent in its slow, late part. Today the Moon recedes by about 3.8 cm a year, at 384,400 km. One constant dissipation cannot give both today’s rate and the age of the system: the value that reproduces 3.8 cm/yr reaches the present distance in about 1.6 Gyr; the value that fills the 3.87 Gyr since release () gives a present rate of about 1.5 cm/yr, two and a half times too small, and the value that fills 4.5 Gyr () one three times too small. The Earth’s dissipation must have varied, which is what detailed models of the tides find (Paper 4, §D.3).
What we now have: an orbit tilted at release by the latitude the Moon left from, 22.5°, nearly circular, receding from the start, and brought by the reduced law to 5.145° at today’s distance, the value observed.
B.8 Today — what is seen on the Moon and on the Earth
The process leaves a Moon and an Earth that look a particular way, and they do (Paper 11).
On the Moon.
The Earth’s material. The Moon’s oxygen isotopes agree with the Earth’s to ppm (parts per million): its mantle is the Earth’s mantle, lifted by the pressure and carried along the pear (Paper 11, R1; Paper 3, §C.10).
A small core. The seismic core reaches a radius of about 330 km, about 1.4% of the lunar mass: the feed carried silicate with little metal, because the iron was still descending and the pear sent most of what rose into it back down (Paper 11, R2).
A thick far side. The far-side crust is thicker than the near side by about 8–10 km — about 10 km between the centre of the near side and the far side, about 8 km in hemispheric means. The far side is the upper dome, built layer upon layer from the Earth’s shell and the returning material; the near side is the base, which carried only the sial it sat on and, over the contact, lost even that to heat. For a far-side crust of 55 km, the far hemisphere holds kg of crust against kg of shell on the dome: the two agree to about 10%, with no parameter adjusted between them (Paper 11, §B.3, corrected 15.10.2026). The far-side crust should grow richer in iron with depth, since its deeper layers formed earlier and less sorted (Paper 3, §B.7).
The centre of mass. The Moon’s centre of mass lies about 2 km toward the Earth from the centre of its shape; a light crust thicker on the far side moves it toward the near side, and in the example of Paper 11 the offset is 1.24–3.11 km for the density contrasts tested (Paper 11, R7).
One face to the Earth, the side that was the base of the body on the tip (Paper 11, R4).
The maria. A mare is an opening over a feed dome. Of the 34 maria of Paper 5’s catalogue (Appendix A), 33 sit on a dome of the gravity field — a result no random placement of 34 points reached in 20,000 trials — and of 73 such domes, 44 lie under bright highland, 36 of them on the far side: buried openings, which worked and were later covered, with the craters of their time, by the layers that built the land around them (Paper 5, Part D). The near-side cap that was the contact holds the great maria; the openings through which the feed passed are the dense, gravity-high basins, and Paper 5 examines which threw material out and which only carried it under cover. The crust test of Paper 5 used the 36 openings first marked by the author, of which the catalogue keeps 34 (with points 35, Copernicus H, and 36, Sinus Aestuum); the two counts are kept apart there.
The crowded poles. 1.20 0.05 in a clean count, rising with crater size to 1.53: the written record of the inward rounding (Paper 7).
South Pole–Aitken. The crater-poor centre — 0.51 of the density just outside the rim — the reduced mantle beneath it, the thickened ring of crust that slid off the dome, and the dome’s centre 24–29° south of the two exits, Imbrium and Serenitatis (Paper 8).
The craters. Nearly all, some 99%, of returned terrestrial material; the oldest made on the Earth before the Moon was a body; the last small ones thrown by the Earth after the release, 1.19 times more on the near side (Paper 6).
On the Earth.
The Pacific LLVP beneath the base of the pear near Kiritimati, slow in all five models tested (Paper 3, §E.4).
The stripes of the North Pacific, the leading wall of the pear, folded: 9,360 km against a pear of 9,680–9,800 km, their equator inclined at least 10° to today’s (Paper 9).
The footprint of the tip between two bends of the stripes, 3,360 km wide, centred at 9.3°N 169.3°E, about 3,760 km west of the base; the two chains of spatula ridges on either side (Paper 9).
The arcs of the western Pacific and Indonesia, the back of the pear, at 8,100–10,300 km from the base (Paper 9).
In the sky. An orbit at 384,400 km, inclined 5.145° to the ecliptic, receding about 3.8 cm a year (Paper 4, target state).
Each of these is a requirement of Paper 11 or a measurement of Papers 5–9, and each is gathered with its status in Part D and with the requirements in Part E.
B.9The stages in one table
The table gathers Part B in one place: for each stage, what happens, the number that carries it, and the paper that computes or measures it. The colour deepens from the hot Earth to the release, as the body gathers, densifies and rounds, and turns to red after the release, when the story passes back to the Earth and to the free Moon.
| Stage | What happens | The number | Paper |
|---|---|---|---|
| 0 Before the bulge | A hot, expanded Earth, still nearly uniform inside, its iron descending; one feed region under one region of the surface | 5.5 h; km, 5,020 m/s; 150 GPa at the source; melt kg/m³ | 2, 3 |
| 1 The bulge | One bulge raised by the pressure; openings in the flat shell throw material that returns and makes craters on the Earth’s shell | 5 km/s out and back; 28 min; 1,000 km west; 46 GPa | 3, 6 |
| 2 The dome | A body on a broad tip, upper dome over lower dome; the stiff sial shell rises with it as its skin, carrying craters | contact 6,000 km; dome 3,650 km; 1,300 kg/m³; self-gravity/tide 0.11 | 3, 11 |
| 3 The pear | A pear held by the Earth’s gravity as part of the Earth, base near Kiritimati above the Pacific LLVP; leans back west and north; tip footprint between the stripe bends | base 9,000–11,000 km; 9–12 lunar masses; tip 6,000 3,000 km; footprint 3,360 km, about 3,760 km west | 3, 9 |
| 4 The rounding | Outward rounding by the share rule; flattening and the largest craters; inward rounding crowding the poles; the burner beneath the far side, exits Imbrium and Serenitatis, weakening as the passages narrowed | 0–31°, 31–70°, 70–180°; 1.69 at 12,994 km; poles 1.20 0.05, to 1.53; SPA dome 17–21° 24–29° | 3, 7, 8 |
| 5 The release | Centre of mass reaches the line and the body is released about 210 km beyond it; the round, rigid Moon leaves on a nearly circular orbit; the 3,000-km contact peels; the near-side maria are cut from the Earth’s pressure and freeze slowly afterwards | 5.77 h; 16,399 km (17,287 at 22.5°; release at 17,496); 2,600 kg/m³, 1,890 km; 1.007 today’s angular momentum; 3.873 Ga | 2, 3, 4, 5, 8 |
| 6 The fate of the pear | Absorbed into the Earth: heavy part to the LLVP, leading wall to the stripes, back to the arcs; the Earth goes on throwing material | stripes 9,360 km vs pear 9,680–9,800 km; equator of the stripes 10°; near-side fresh craters 1.19 | 3, 6, 9 |
| 7 The recession | Inclination equal to the latitude of release; nearly circular orbit; the tide pushes outward from the start; the tilt decays | 5.145° (= observed); | 4 |
| 8 Today | The Moon: Earth’s material, small core, thick far side, 34 maria, crowded poles, SPA. The Earth: LLVP, stripes, arcs | ppm; core 330 km; far side +8–10 km; centre of mass 2 km; 3,344 kg/m³ | 5–9, 11 |
Table B.5. The process in stages 0–8. Navy deepens through the construction as the body gathers, densifies and rounds; red marks what follows the release.
Read the table downward and the model is told again in nine lines. The left half is the story; the right half is what makes it a model rather than a story: a number for each stage, computed or measured, and the paper in which the reader can check it. Part C now presents those papers one by one.
The papers, one by one
Part B told the process as one story. This Part gives the ten papers on which that story rests, in the order of the series. Each paper is presented in the same way: first its claim, in a box of two or three sentences; then each of its parts — every Part and every appendix — in one paragraph, headed by the part’s own title and carrying its key numbers. The reader who wants only the shape of the series can read the claims and stop there; the reader who wants to know what a paper actually computes, and where in it to look, reads on through its parts. The numbers are those of the papers themselves, and each paragraph names the section in which they are found.
C.2Paper 2 — LEF Mechanism in Principle
The Moon’s material left the Earth while still turning with it, and was released where the speed it already had was the speed a free orbit requires: the corotation radius, 15,818 km for a 5.5-hour parent and about 16,400 km at the 5.77-hour day of release. Evaluated there rather than at the Earth’s surface, the angular-momentum budget closes at 1.007 times today’s value (an earlier version gave 1.008), while the classical fission route needs 2.74 times; the objection that closed the door on a terrestrial origin since Darwin does not apply to this route.
Front matter — the environment, the idea and the introduction. Before any calculation the paper fixes the state to which each number belongs, so that no value is carried from one moment to another. The parent is today’s Earth and Moon together, kg, of which the Moon’s kg is counted once — inside the parent before the transfer, in the Moon after it — leaving the Earth kg. It is hot and expanded (volumetric radius 6,517 km, an adopted expansion of 120 km), essentially uniform because the organisation of its core has only begun, and it turns once in 5.5 hours; as a Maclaurin spheroid, the flattened equilibrium shape of a uniform spinning fluid, its equatorial radius is about 6,721 km. The introduction separates two questions that were bound together for a century and a half: the speed the material needs at the moment of release, and the angular-momentum budget needed to reach that state. The 5.5-hour day is not chosen; it is today’s angular momentum, kg m s, returned to the spin of a hot, undifferentiated Earth (5.54 h), plus the roughly 1% that solar tides have removed since.
Part A — The problems before us. Part A states, one by one, the conditions a body built from the Earth’s own material must meet to reach orbit whole. The first is the velocity gap that ended classical fission: at the equator of a 5.5-hour parent the ground moves at 2,133 m/s, a free orbit there needs 7,701 m/s, and material let go from the surface follows an ellipse of semi-major axis 3,495 km that runs back into the parent (§A.1). The gap closes with distance, because the speed carried by the rotation grows outward while the orbital speed falls, and the two are equal at the corotation radius, — the synchronous-orbit relation of standard mechanics, the same that places geostationary satellites, evaluated here at a new place (§A.2, A.5). The pear bridges the Earth to that line: a hill with a base about 9,000 km wide and a 3,000-km contact at the Moon, bridging about 7,800 km from the Earth’s surface to the Moon on the equatorial line (about 8,700 km for the release at 22.5, Paper 3), lying wholly inside the line (§A.3). Two processes set the day at release: the lengthening pear carries rotation outward and alone would lengthen the day from 5.50 to 6.44 h and push the line to 17,569 km, while the iron sinking into the core speeds the Earth up, as a skater drawing in her arms; with a core twice as dense as the mantle () it removes 0.67 h (§A.4). The budget is built next: a uniform parent holds kg m s, 0.7% above the sum of today’s spin and orbit (1.5–2.5% with vector addition at the angles tested; an earlier version gave 1.5–2.6%), and the transfer hands about one sixth of it to the material, 15.6% in the base calculation (§A.6). The surplus requires a parent essentially uniform at the start, , against about 0.33 for today’s Earth with its core. At the classical Jacobi bifurcation the parent would need a day of 2.73 hours and 2.74 times today’s angular momentum; the familiar “four times” (4.08) belongs to another point on the same sequence (§A.6.5). Part A closes with the Roche limits for a body of 2,600 kg/m — 19,971 km for a fluid body, 10,314 km for one that keeps its shape (§A.7; an earlier version gave 10,313 km, the same within rounding) — and the tidal watershed: outside the corotation line a satellite is pushed outward, inside it is drawn in, as Deimos and Phobos show at Mars today (§A.8).
Part B — How the problems are solved. One calculation meets all the problems of Part A with one set of numbers (§B.1). From the 5.5-hour start, the pear and the centralising core together give an Earth day at release of 5.77 h; the corotation line then lies at 16,331 km for a test particle and at 16,399 km, about 16,400 km, when the Moon’s own mass is included — about 2.6 times today’s Earth radius. The Moon begins to separate as its centre of mass reaches that line and is torn free slightly beyond it, about 210 km past the line; with a radius of 1,890 km its near side is at 14,509 km and the Earth’s equator, flattened to 6,701 km at the slower spin, lies some 7,800 km below it. There the rotation gives the Moon exactly the orbital speed, about 4,960 m/s, so no gap remains and no push is needed (§B.2). At release the Moon’s orbit holds (17%) — the orbital angular momentum of the pair about their common centre, with the reduced mass; with the full lunar mass about the Earth’s centre — and the Earth’s spin ; the system holds 1.007 times today’s angular momentum, and the Earth’s implied moment-of-inertia coefficient, , agrees with the 0.360 of a two-layer Earth with and (§B.6). No giant impact and no later removal of angular momentum are needed. The Moon at release lies well beyond the rigid Roche limit (9,484–12,994 km for 1,300–3,344 kg/m) and inside the fluid one; it is held by its rigid outer shell, which for a rigidity of 10 GPa or more keeps its axis ratio at most 1.04 — the body is round, its flattening and rounding having been completed while it was attached (§B.7; Paper 7). Separation carries its centre a little beyond the line, where the tide raised on the faster-turning Earth runs ahead of it and draws it outward from the start (§B.8).
Part C — Summary. A single table pairs each problem of Part A with its answer in Part B: the speed comes from the rotation and no gap remains on the line; the pear bridges to the line and the Moon leaves whole; the day of 5.77 h comes from both processes together; the centre of mass is released at about 16,400 km; the angular momentum closes at 1.007 times today’s and agrees with the core structure; the body is rigid and well beyond the rigid Roche limit; and it recedes from release.
Part D — Claims, tests and novelty. The paper gathers its requirements and claims in one place. Three requirements head the list: a core centralising during the transfer (); a rigid body at release ( GPa); and a continuous pear from the Earth to a 3,000-km contact, with no neck remnant carried away by the Moon. Five central claims follow, each with its status and its test — corotation (an application of standard physics), closure of the budget (a consistency test), sensitivity to structure (a computed result), the non-equatorial correction (a geometric correction) and survival (an open requirement handed to the next papers). The adopted values carry their windows: a 5.5-hour day within 4.90–5.54 h at 120 km of expansion; an expansion of 98–520 km, a volumetric radius of at least 6,495 km; a parent with at the start of the transfer, against about 0.33 for today’s Earth; and a release beyond the line, since a body released inside it spirals in. The novelty is stated plainly: the laws are old; what is new is the place where the speed condition is evaluated and the joint computation of mass, shape and spin in one connected transfer.
Part E — Conclusions. A body the size of the Moon can reach orbit from the Earth’s own material without a collision from outside. Put as a single chain: the Earth’s rotation carries the material outward; the line where carried speed equals orbital speed sets where the Moon leaves; the balance of the pear and the core sets where that line is; and the angular momentum the Earth started with is enough, with about 1% to spare for the Sun to remove later. The earlier conclusions are kept with their reference values: 15,818 km is the line before the transfer and about 16,400 km the line after the pear and the core have acted; the material gains 15.6% of the budget in the base calculation and 16.5% in the coupled solution; about 17.7% is the final orbital share of the coupled state with the pear alone (), while at release with the Moon’s orbit holds about 17.0% (an earlier version gave the 17.7% as the share at the end). The further work names six calculations for other groups: a stratified Maclaurin solution of the centralising core, the dissipation of the early Earth from the 5.77-hour day, an equation-of-state value for the thermal expansion, a tidal integration of the onset of recession, a visco-elastic survival calculation for the – years spent inside the fluid Roche limit, and a modern computation of the classical Jacobi sequence.
Appendix A — Derivation of corotation, definitions and constants. The appendix fixes the definitions on which every number rests. It keeps apart the total initial mass and the final Earth mass, and a radius measured from the Earth’s centre from one measured from the centre of mass of the pair; in the two-body case the gravitational parameter is . The value 15,818 km belongs to one stated definition (the final Earth mass, the test-particle approximation); a different definition gives a different number, not a relabelled one.
Appendix B — The rotating geometry and the coupled angular-momentum budget. The appendix derives the parent step by step: the mass, kg; the size, a cold-density radius of about 6,397 km expanded by 120 km to 6,517 km at about 5,214 kg/m; the shape, from the Maclaurin equation, , km, km; and the budget, kg m and . Its expansion scan shows where the admissible range comes from: with no expansion the budget falls 3.3% short of today’s, at 98 km it equals it, at 120 km it exceeds it by 0.7%, and at 520 km by 15%, the adopted limit of what the Sun can later remove.
Appendix C — The differentiation calculation and the sensitivity tests. The two-layer calculation behind the offset compares end states, not a path in time: an inner and an outer layer turning together, each boundary a surface of equal effective potential, the moment of inertia computed from density and shape. For the final day falls from 6.438 to 5.274 h and the line moves inward from 17,569 to 15,382 km as rises from 1 to 3; gives 5.77 h and 16,331 km, and at the core almost exactly cancels the slowing by the pear. Freeing the boundary shapes changes the radius by at most about 2.5 km; the results are reliable to the kilometre.
Appendix D — The vector correction to the budget and the hand-off to Paper 4. Off the equator the Moon’s orbital angular momentum and the Earth’s spin no longer point along one axis, and they add as arrows: . In the 25 sensitivity test the corrected release lies at about 17,177 km (test particle) or 17,240 km (two masses), with the Earth’s axis 3.85 or 3.84 from the total; the earlier 4.48 was set apart because it mixed vectors expressed in different frames. The adopted latitude, 22.5, is recomputed in Paper 4.
Appendix E — Roche calculations and the survival assumptions. The appendix gives the background to the two Roche limits and a first measure of the tidal load. At 15,818 km the tidal stretch across a body of 1,890 km is about 0.381 m/s against a surface gravity of 1.373 m/s, a ratio of 0.277: self-gravity wins. Turned into a stress, Pa, and a time, the load would change the shape of a body of viscosity Pa s by half in about 85 years; this is kept as a parametric dependence, not as a disruption time, and the deformation of the attached and released body is a stated survival requirement.
Appendix F — Prior work, novelty and record of tests. Component by component, the appendix separates standard physics (circular velocity and corotation, Maclaurin and Jacobi figures, the sign of tidal transfer, the Roche limits) from the paper’s own application, the combination of mass, shape and budget in the connected scenario. It names the bibliographic checks still owed before submission and records that the absence of a survival solution is marked open, not counted as a pass.
Appendix G — The physical environment table binding on the calculations. The full environment, rows E01–E70, records quantity by quantity what is adopted, computed, reproduced, open or a present constraint, at each of three states: before the division of mass, during construction and close to release. Two later updates by the author add the volatiles — an ancient inventory larger than today’s, dissolved, in bubbles or in vapour according to pressure and temperature — and the cooling cycle, in which volatile-rich material rises, cools and returns, like a pot of soup on a stove. A binding timeline puts the stages in order without inventing dates: as the body peels, the passages that carry the Earth’s pressure into it narrow; at detachment that pressure stops reaching the Moon, and the outward ejections stop with it; the rounding is complete before release.
C.3Paper 3 — LEF Mechanism in Practice
The Moon was fed from within and rose from without — one body, built two ways at once. From within, the parent’s own pressure, 150.26 GPa at its source, lifts a foamed melt to the corotation line with 10.49 GPa to spare; from without, the Earth’s outer shell rose with the body as the skin of its upper dome and became its crust. Beneath it the Earth was drawn into a pear, part of the Earth and held by the Earth’s gravity, and the body on its tip was released, round, slightly after its centre of mass reached the corotation line, about 210 km beyond it; the sorting then gathered the pear back into the Earth.
Front matter — the environment, the idea and the introduction. The paper treats the whole construction as one process on one body, in the environment of Paper 2: the parent of kg and 6,517 km, a 5.5-hour day at the start and 5.77 h at release, the line at 16,399 km on the equator and 17,287 km at 22.5. The scenario window is about 600 Myr from the start of the bulge to release at 3.873 Ga — roughly 400 Myr for the bulge and the pear, about 100 Myr of flattening and about 100 Myr to release — with 100 Myr kept as a sensitivity case. The picture is a balloon filled from a pipe beneath it while its skin is the stretched surface of the ground it lay on: the filling is the feed of deep, hot material; the skin is the Earth’s sialic shell — sial being the light upper layer rich in silicon and aluminium, lying on the denser, magnesium-rich sima. Neither supply alone makes the Moon. Corotation links spin to orbital speed but neither lifts material nor fixes the moment of detachment; the paper therefore asks what pressure, mass and energy balance, flow structure and connection the construction requires.
Part A — From within: the transport problem and the material balance. The first step is an account in which every kilogram has one place: the parent’s mass is divided at every moment among the Earth, the growing body, the material in transit and what has escaped, and ejected material that lands back is subtracted and added again (§A.1). Rotation alone cannot do the lifting: for a body of the lunar mass touching the parent, 8,991 km from its centre, the Earth’s pull is 4.93 m/s and the outward push of the 5.5-hour spin only 0.905 m/s; every kilogram still weighs about two fifths of its weight on today’s Earth (§A.2). The mechanism examined is therefore continuous feed under pressure, and Part A writes the balance it must satisfy: along the path the pressure must pay the weight of the column in the combined field of gravity and spin — its hydrostatic head, proportional to the density of the material — and the friction of its flow (§A.3).
Part A (continued) — A deep source, a developing body and different thermal boundaries. A feed that wandered would build many heaps, not one Moon; the source is a preferred region of the reorganising interior, Lobe A, north of the equator, which feeds the same place for a long time as a pot heated off-centre keeps boiling at one spot (§A.4). The passage is kept open by the heat of the feed and of the hot bodies on both sides; warmth keeps it fluid but does not hold its walls, which must be held by its shape (§A.5). The volatiles, held in an inventory larger than today’s, are dissolved at depth and come out on decompression, foaming the melt; their role is to make the rising material light, not to raise the source pressure above the weight of the overlying material (§A.6). A solid skin forms over the hot body quickly — a metre in about 1.9 days with a hard-cooled surface, 50 km in about 13.2 Myr (158 Myr with a warm one) — so the exterior can stiffen while the interior and the feed stay mobile (§A.7). The order is fixed: feed, rise of the dome and ejections overlap. As the peeling advances, the passages that carry the Earth’s pressure through the pear into the body narrow: Serenitatis peels first and is cut off from that pressure, and is afterwards only weakly active, through Imbrium, which stays connected. At detachment the Earth’s pressure stops reaching the Moon, and with it the Moon’s internal pressure and the ejections; the crater era therefore ends only after release (§A.8). After release, small and medium drops thrown out by the Earth are drawn to the nearby Moon and make small craters; the closing of the outer cap plays no part, and the far-side maria stop as cooling ends the internal pressure.
Part A (continued) — Are the pressure, the rate and the energy sufficient? The push is priced. At the centre of the parent the weight of the overlying material, slightly relieved by the spin, gives a source pressure of 150.26 GPa (§A.9). A column of melt from the centre to the corotation point of the whole parent, 15,882.9 km, costs 139.78 GPa for a deep melt of 3,500 kg/m foamed to 1,500 kg/m above the surface, leaving 10.49 GPa; 4,000 kg/m fails by 3.92 GPa, and the threshold is a deep melt lighter than about 3,864 kg/m — a condition a volatile-rich melt meets and a dry one does not (§A.10). Delivering the whole lunar mass needs kg/s over 100 Myr or kg/s over 600 Myr, and the flow through a passage grows as the fourth power of its radius (§A.11). Lifting the Moon from the Earth’s surface to 16,400 km costs about J, less than one per cent of the parent’s binding energy; it is paid by the same evolution that drives the upwelling, the descent of the iron (§A.12). The joint test of pressure, flow and load in one state — 22.5, 5.77 h, the body’s far side on the line — gives the sharp negative result of the paper: a thin massless pipe cannot build the Moon. The radial balance passes only from a passage radius of about 1,017 km, where the passage itself already holds 0.46 lunar masses, and a sideways load of order N remains that a fluid at rest cannot carry. The connection must be broad, hot and massive (§A.13).
Part B — From without: the body on the tip of the pear. Part B follows the Earth’s outer skin through four stages and places each piece of it on today’s Moon. At the flat stage the sial lies over an active feed and already carries craters from material ejected through its openings that returned and landed; the Pacific basin, 1.4 to 2.4 times the surface of the later upper dome, marks the region from which the shell was gathered (§B.1). The base of the pear stood near Kiritimati (1.9N, 157.5W); the region at 25N, 165E, read earlier as the source, is its back, which leaned west as the rotation made the outer part lag, and north, following a feed that rose obliquely from a source north of the equator. At the intermediate stage the body sits on the wide tip of the pear as a squashed ball on a rounded support: a 6,000-km contact, a lower dome hugging the tip ( m, 33%) and an upper dome standing about 3,650 km above the rim ( m, 67%) — the height at which the full lunar mass has the foamed density of 1,300 kg/m that Part A requires: the body then encloses m, twice the m of the sphere at release, and its upper dome is about three times the far hemisphere of that sphere (§B.2). The shell does travel: it rises with the body of the pear, and slowly separates from it and slides up to the tip, into the Moon — which is why the tip separates as a body of its own; the sial slides upward, in the direction of outward sorting, eased under shear by the lubricated layer between sial and sima. The exposed ring of the body’s underside contracts, about 1,500 km inward over millions of years, on a weak interface beneath a stiff shell of Pa s or more, the viscosity that keeps a 100-km crater from relaxing in years (§B.3). The translation rule follows: in the outward rounding each part keeps its share of the surface, so the 3,000-km contact (7%) becomes a near-side cap of about 31, the peeled annulus (26%) a belt from 31 to 70, and the upper dome the far side (§B.4). The hill and the contact can be drawn on today’s near side: the hill holds 99% of the area of the near-side dark basalt, the contact 66% (shares of area, Paper 5), and Mare Imbrium, the opening through which the feed entered the body, lies inside the contact. The openings are of two kinds — vents on the crown and flank that threw material out, and covered conduits under the lower dome that only carried it (§B.5). The craters made on the exposed shell travelled with it and kept their size; most and the largest formed in the flattening, and in the inward rounding the poles gathered them (§B.6). The far-side crust is many layers of compacted sial, which migrated up to the tip under the forces of the spin, and of material that returned again and again, its iron content rising with depth; taken at 55 km and 2,550 kg/m over the far hemisphere it is about kg, 3.5% of the lunar mass, and with the near-side crust, about kg, it makes kg, about 5.6% — within the 4–6% that GRAIL gives for the whole crust; the remaining 94–96% is the deep material of Part A (§B.7). The far side is thicker, by about 8–10 km, because the two sides were built differently; the near side is thinnest under the maria because they are openings.
Part C — The connection and the release. The deep source pressure does not press on the body’s cap: it is spent on the column, and the body’s own weight gives only about 3.37 GPa at its centre (§C.1). At the corotation line, at 22.5 and 17,287 km, the radial requirement on the connection vanishes, but a sideways load of 0.559 m/s remains, N — 5.74 GPa of shear over a disc 1,500 km in radius — which a narrow, hot neck cannot carry (§C.2). The corotation line is where the radial pull turns over: beyond it the rotation pulls the body outward (§C.3). Over the ring between the 6,000-km rim and the 3,000-km disc the body peels away slowly with the sial it sat on, as an inflating ball peels from a rounded stand; over the central disc the heat melted the sial and smoothed the surface (§C.4, C.4a). The hot layer over the disc resists the separation, but only a little: the body begins to peel as its centre of mass reaches the corotation line and is detached slightly beyond it, about 210 km past the line, pulled outward with force rather than let go gently — the pull from above that drew up the spatula ridges (§C.5). The base of the pear stood roughly on the equator of that time; whether that equator is today’s is a question for the axes, future work, and the release latitude is the 22.5 of Paper 4. The release state handed to Paper 4 is the corotation line at 16,399 km on the equator or 17,287 km at 22.5, with release about 210 km beyond it, at a 5.77-hour day (§C.6); an earlier release at 20,595 km followed the lengthening pear alone, and with the centralising core the line lies at about 16,400 km. The release distance is set by the search of §C.5a, where two reduced tests — the present inclination and the present eccentricity of a hot young Moon — meet near 210 km beyond the line, when a little more than half the Moon has crossed it. Beneath the contact lies one bulge drawn into a pear — wide at the base, narrowing in a single arc without a waist to the contact, wholly inside the corotation line. The pear is part of the Earth and is held by the Earth’s gravity like any part of it; it is not thrown out, because its speed is not a throwing speed and it has not crossed the corotation line. At release it is about 8,700 km long and its base 9,000–11,000 km wide; from the width of the base the paper derives 8.8–12.1 lunar masses, lifted at a cost of to J, the order of the energy released by the formation of the Earth’s core (§C.7, C.9). Along the climb the body on its tip flattens to an axis ratio of 1.69 near 13,000 km and rounds inward to 1.20 late in the attached stage; at release it is round. The pear lifts the Moon radially and, because the Moon is attached, gives it the sideways speed of an orbit, 4.96 km/s on the equator; a body thrown from low on the Earth, even at 7 km/s, falls back, because a push adds height but not sideways speed (§C.8). The pear sorted what it carried: the sial drained to the tip and became the crust, the Earth’s mantle became the Moon’s mantle, and the iron sank back down the pear, which is why the Moon’s core is one to two per cent of its mass (§C.10). After release the Earth went on throwing material at the Moon — all of it very hot: the large pieces first, and, as the magma storm calmed, small, still hot pieces — and the near-side highlands, every mare excluded on both sides, carry 1.19 times as many fresh craters of 1–2 km as the far side: the Earth was the last scatterer of small craters on the Moon (§C.11).
Part D — Predictions, tests and conclusions. The requirements are collected in thirteen rows that one Earth, one feed and one body must meet at once, not counted as independent votes: feed under pressure, construction rate, energy, a stable attached body, a stiffening exterior over a mobile base, a connection that carries the load and then fails, and the order of stages; then the share rule (zones at about 31 and 70), the carried record (the oldest craters densest on the far side, less in the belt, least in the cap, with no difference of scale), the layered far-side crust (iron rising with depth, tested by central peaks), the release on the line, the northward lean of the pear, and its gathering back whole into the Earth, with no residue in orbit (§D.1). The paper ends with one negative result — a massless cylindrical passage transmitting pressure alone cannot build the Moon — and one geometric result that answers it: the broad, hot, massive connection the negative result demands is the wide tip of the pear (§D.3–D.4).
Part E — What the pear left in the Earth. The pear did not follow the Moon. The release did not bring it down: the sorting, acting on the pear whether or not the Moon was there, gathered it back into the Earth over tens to hundreds of millions of years. Its heavy, iron-bearing part sank to the base of the mantle beneath the base of the pear, its leading side was folded into the stripes of the North Pacific, and its back was gathered into the arcs of the western Pacific (§E.1–E.2). The model reads the two large low-velocity provinces at the base of the mantle as two different things: beneath the Pacific, largely the returned pear — part of the sorted material that went back into the Earth — on a drained lobe; beneath Africa, a lobe never disturbed — where the reading of an impact model sees remnants of the colliding body and requires no relation to the Moon’s source (§E.3). The position test has been made and passes: the base near Kiritimati lies inside the Pacific province in every model tested — five of five slow votes, inside the contour of SMEAN () and SMEAN2 () at 2,800 km, 1,229–1,584 km from the edge — some 1,500 km north of the province’s centre. Composition, shape and isotopes are the further tests (§E.4). While the pear stood, its gravity drew the Earth’s core a few hundred kilometres toward it — 270–370 km for bases of 9,000–11,000 km — and after the pear was gathered back the core returned; the east–west asymmetry of the inner core is the first record to compare (§E.5). The further work lists nine calculations, from the motion of the body on the contact layer to a three-dimensional simulation of the connected body and the equation of state of the deep melt.
Appendix A — Sources, assumptions and novelty. The components of the paper are sorted by standing: standard physics (gravity, pressure and momentum balance; Poiseuille flow in a passage; Stefan’s law for the separation of two surfaces joined by a viscous layer), prior observations used as constraints (water in lunar melt inclusions, the GRAIL crust, the lunar core), calculations made here (the joint test of pressure, flow, load and passage mass; the body on the tip and the share rule) and elements of the model proposed for testing (the connected feed and Lobe A). No priority is claimed beyond what a dedicated review would support.
Appendix B — Constants and limits of reproduction. The appendix states the constants and the inputs that are test values rather than measurements — viscosity, segment densities, passage width, feed duration, the thermal inputs of the cooling estimate. The 5.77-hour day and the release distance are taken from Paper 2; everything the paper computes from them can be checked from its own equations. A value such as 10.49 GPa is printed to four digits so that the reader can repeat the calculation exactly, not because the margin is known to that precision.
C.4 Paper 4 — The Orbit
The tilt of the Moon’s orbit is the latitude it left from: a body released while turning eastward with the Earth at latitude enters an orbit inclined by exactly to the Earth’s equator, with no parameter to adjust. Released at 22.5, about 210 km beyond the latitude-corrected corotation line (17,287 km), at 17,496 km, the Moon enters a nearly circular orbit and recedes from the start; the reduced tidal law carries its 22.5 to 5.145 at the present distance, the value observed.
Front matter — the environment, the idea and what the paper proposes. The paper takes over at the moment the Moon is let go. Its environment is that of Papers 2 and 3: masses of and kg after the division, a gravitational parameter of the pair m s, an Earth day of 5.77 h at release, a released body of 2,600 kg/m and 1,890 km, and a broad viscous contact 3,000 km across. The release latitude is the latitude of the centre of that contact, 22.5: a body has one velocity, and the width of its base does not spread its inclination. Three places are kept apart: the base of the pear near Kiritimati, its back at 25N, 165E, and the release latitude of the Moon’s centre. The opening the body rose from is identified between about 10 and 25N. The base of the pear stood roughly on the equator of that time; whether that equator is today’s is left to the axes, future work. 25 is kept as the demanding sensitivity case. The destination is today’s orbit: 384,400 km, eccentricity 0.0549, 5.145 to the ecliptic, recession about 3.8 cm/yr.
Part A — Which inclination results at the moment of release? The inclination is the angle between the plane of the orbit and a reference plane, here the Earth’s equator at release. A body carried round on a circle of latitude moves parallel to the equator; let go, it must move in the one plane that contains both its velocity and the Earth’s centre, and that plane is tilted by the latitude — as a stone let go from a raised ring of a merry-go-round leaves in a plane dipping through the centre. In three lines, gives , ; mass, distance and spin rate cancel (§A.2). A disc that settles over the equator starts with almost no tilt and must have it added later; here the tilt follows from where on the turning Earth the body was attached (§A.1). A radial velocity changes the shape of the orbit but not its tilt; a northward or southward component would only make the orbit steeper. At release the Earth’s spin holds and the Moon’s orbit kg m s; the 22.5 between them divides into 3.78 between the Earth’s axis and the total and 18.72 between the orbit and the total. None of these is the ecliptic inclination or today’s 23.44 obliquity; how the axes of the Earth and the Moon evolved together after release is future work, not solved in the series (§A.3).
Part B — Does the body enter an orbit that survives and recedes? A body at latitude circles the spin axis at , not at , and so moves more slowly than an equatorial body at the same distance. On the equatorial line, 16,399 km at the 5.77-hour day, it is too slow: its orbit has eccentricity , it is released at apogee, its perigee falls to 12,209 km, and the tide raised on the Earth draws it in. Carried a little farther, to km (), the corotation line for its latitude, it has exactly the circular speed (§B.1). The Moon begins to separate as its centre of mass reaches this line and is released about 210 km beyond it, at km (). There it moves slightly faster than a circle needs: the release point is the perigee of a nearly circular orbit (, apogee 18,830 km), and the tide pushes outward from the first moment and goes on pushing as the Moon recedes (§B.2). The body lies about 7,200 km outside the rigid Roche limit of 10,314 km; the rigid limit applies because the Moon at release is round, its outer shell rigid, its axis ratio at most 1.04 (Paper 2, §B.7). The starting orbit is therefore km, with the perigee at the release point, to the equator of that time (§B.3). An earlier version placed the release farther out, at 20,595 km; with the core that centralises during the transfer the day at release is 5.77 h, and the release just beyond the latitude-corrected line replaces it.
Part C — How does the orbital plane change on the way out? The 22.5 is measured from the Earth’s equator; today’s 5.145 from the ecliptic, the plane of the Earth’s orbit round the Sun. Close to the Earth the equatorial bulge makes the orbit precess about the equator; far out the Sun makes it precess about the ecliptic; the Laplace surface bends from one to the other (§C.1). An order-of-magnitude scale for the transition, with the bulge scaled to the 5.77-hour day, is about 17.07 Earth radii; the release lies at about 16.1% of it, well inside the region where the equator governs the plane. Whether the orbit follows the turning plane smoothly depends on the tilt of the Earth’s axis, the line of nodes, the eccentricity and the recession rate, and requires an integration of the axes system (§C.2). The Moon’s fossil figure and its Cassini state are further constraints, not stages fixed by the release latitude; a published thermal-orbital model finds the figure frozen before about 16 Earth radii (§C.3).
Part D — How much of the inclination survives, and in what time? The simplest law of tidal damping, , integrates exactly to : a law in , not , which matters at a starting angle of 22.5. From km to 384,400 km the distance grows about 21 times and falls about 4.6 times: 22.5 becomes 5.145, today’s value, so the latitude that returns the observed angle is 22.5 itself; a release 8% beyond the line gives 5.282, and a start at 25 gives 5.788. The final angle is governed by the release latitude, not by the starting distance (§D.1). Because the same rate multiplies both the recession and the damping, the Earth’s tidal quality factor cancels from this law — but not from the thermal history, which decides how strongly the Moon itself dissipates at each distance (§D.2). The clock test supplies time: with a constant the present recession rate comes out at about 3.70 cm/yr but the present distance is reached in about 1.60 billion years; a of 33.8 fills 4.5 billion years but gives a present rate about three times too small. The time available after release at 3.873 Ga is about 3.9 billion years, not 4.5; against 3.87 billion years the clock fits at , where the present rate falls to about 1.5 cm/yr, and the conclusion is the same. No constant fits both; the Earth’s dissipation must have varied with time, as ocean-resonance models find (§D.3).
Part E — What has been proved and what will be tested? Seven claims are set out by status, from what is fixed to what is still to be computed: the source of the inclination, a geometric identity that holds for a release without a north–south velocity or a torque at separation; the initial ellipse, two-body mechanics; initial recession and survival, computed, the deformation check open; and the present inclination, the distance with its clock, and the geographic link of the release latitude to a place on the Earth, each requiring an integration or an independent reconstruction. The identity stands independently of the geographic link, which bears on the source site alone. The contribution is stated: the identity is standard mechanics; what the model adds is that the starting orbit is fixed by the construction of Papers 2 and 3, not chosen to fit. The further work begins with a coupled thermal-orbital integration from the release state through the Laplace-plane transition and the Cassini state with a time-dependent dissipation, and continues with the Earth’s dissipation history from the 5.77-hour day, the obliquity channel opened by the 3.8 tilt at release, the solidification of a magma ocean under a one-sided lid, and the fossil figure.
Appendix A — Formulas for reproducing the tidal test. In the constant-time-lag framework the tide raised on the Earth pushes the Moon outward when exceeds a factor that depends only on the eccentricity and equals 1 for a circle: the Earth must turn, in the plane of the orbit, faster than the Moon goes round. The test gives on the equatorial line (contraction), equality on the corotation line, at the adopted release about 210 km beyond it (expansion), and at (expansion); the sign was also checked by integrating the tidal forces along one orbit. A short code reproduces the ellipses, the tidal sign and the angles 5.145 and 5.282.
Appendix B — Scope of verification and availability. The appendix states what was checked and what was not. An independent Newtonian integration of the reference orbit returned to its starting point within about of its distance, confirming the orbital arithmetic of the monopole approximation; it does not test the connection or the rheology. The full coupled thermal-orbital integration is not included and is not reported as if performed.
C.5 Paper 5 — The Maria
A mare is an opening in the Moon’s shell over a feed dome: a body pushed up from a focus beneath the surface, through which the material rose, was thrown out, and came back as the returning material that made the craters. The dark basalt plain is only the last layer that froze in the opening. Counted in this way, the maria are not where the basalt is: 33 of the 34 maria sit on a dome in the gravity field, and 44 of its 73 domes lie under bright highland, 36 of them on the far side.
Paper 5 asks what a mare is, if not a basin dug by a body from outside and flooded much later by lava. It answers with a definition and then tests that definition in five independent records: the gravity of the domes, the height of the floors, the craters on and around the floors, the iron and titanium of the ground, and the thorium. The paper has fifteen Parts and one appendix.
Part A — Terms and definitions. The literature uses the one word mare for a dark surface, for the hole beneath it and for the story of how the hole was filled. Part A gives each its own name. The feed dome is the dense body beneath; it is not an intrusion that came to rest but the shape the flow built as it passed upward, as a strong spring raises a mound over its outlet while it runs. The opening is where the feed reached the surface; it is not a pipe with walls but a region of runny melt inside stiffer material, through which pressure passes. An exit threw material outward; a mouth passed material while still covered and was exposed later, so one structure can begin as a mouth and end as an exit. The mare is the opening with its last surface, and the basin is the margin it built of its own returning material. A second rule separates the place a crater’s material came from and the place it landed: the craters seen on a surface are the background, plus those made by a nearby opening, minus those the opening melted or covered while it was active. A crater count is therefore a sum of three processes, not a simple clock.
Part B — What the series has fixed. Two inputs are taken and not derived again. From Paper 3 comes the body on the tip of the pear: the tip 6,000 km across when the rounding began and 3,000 km at release; the hill, the 6,000 km region that rested on the tip, centred today at 16.6°N 13.1°E and holding 99% of the area of the near-side dark basalt; the contact, the last 3,000 km that still touched the Earth at release, centred at 24.1°N 335.2°E and holding 66% of it, with Imbrium inside it (14.8° from its centre); the zones of exposure, a cap of 31° and a belt to 70°, carried onto today’s Moon by the rule of proportional share; and the light, foamed body of 1,300 kg/m³. From Paper 6 comes the origin of the craters: some 99% are of returned terrestrial material. The near side is thin-crusted because its openings and the heat beneath them removed its upper, light layer, not the other way round.
Part C — What a mare is, how many there are, and the mare as the source. The literature counts dark basalt: 646 mapped units under 97 names, 189 of 1,000 km² and more, 20 basins of 500 km and more. The model counts openings over feed domes. The author identified 34 maria on the gradients of the GRAIL gravity field (14 on the near side, 20 on the far side); separately, an automatic search took every round high of 100 km and more standing 50 mGal and more above its ring as a feed dome, and found 73. The two catalogues were made independently, and 33 of the 34 maria sit on a dome (Study 1). In 20,000 random sets of 34 points not one reached 33; points fall on a dome about 8 times in 34 by chance. The one exception, Ingenii, lies over South Pole–Aitken, whose heat cooked its dome away. The dark plains without a dome beneath them — Procellarum, Tranquillitatis, Nubium, Frigoris and others — are not maria but plains: crust melted in place by the heat of the Earth, with no channel to depth. The second half of the Part reads the ground. Around six maria and three plains, 11,574 craters of 5–60 km were chosen and frozen before any chemistry was read, with 5,922 controls more than 600 km from any basalt (Study 2). Around the maria the ground carries 5.96 wt% FeO within 50 km and still 3.40 at 300–600 km, against 2.30 in the controls; around the plains it falls to 2.60, near the controls. A mare threw its material far; a plain only spilled over its edge. Each crater is a little poorer than its ground ( wt% within 50 km, in the controls): it threw aside the thin iron-rich veneer the mare had laid and opened the poorer base beneath, as Dionysius beside Tranquillitatis shows.
Part D — The openings, visible and buried. If the opening and not the basalt is the mare, openings must exist where no basalt is seen. Gravity sees them through their cover. An opening is told from a crater by the crust beneath it: a dome pushed from below thins the crust over its centre, a crater made from above does not. Of the 36 marked openings, 26 show this crust jump of 8 km and more (Moscoviense km, Orientale ), against 4 of 169 ordinary craters (Study 3); the six without it, Tsiolkovskiy among them, are craters that landed on a lava area. Sorted by cover, 36 of the 40 far-side domes are buried and 22 of the 33 near-side domes lie under a mare; counted by domes, the far side has more openings than the near side, 40 against 33. Over a buried dome the iron and thorium equal those of the land around ( wt% FeO, ppm), the crust is thicker by 8–13 km, and no crowd of craters gathers on it (Study 4): it is an opening with a blanket over it, buried together with the craters of its time. Two of the near-side buried domes, Balmer–Kapteyn and Schiller–Schickard, coincide with cryptomaria already known. Procellarum is the contact disc itself, holding several domes. The generations of openings, and the reading of each as exit or mouth, are recorded twice, by appearance and by position, and both readings are kept.
Part E — The feed dome. When the feed stopped, the material left in the dome froze into a body richer in iron and titanium, and denser, than the crust around it; its strength is the excess of gravity at its centre over its ring. Among the open maria Orientale reaches 740 mGal, Moscoviense 689, Nectaris 538; the buried far-side domes are as strong (Freundlich–Sharonov 519), so a buried mare is not a failed opening. The floor above a dome should be lowest over its centre, the more so the stronger the dome. The candidate causes are the weight of the dome, suction from beneath, and thermal expansion and contraction with heat and cold — in the model the most significant — which acts the more strongly the larger the mass in diameter and depth; which of them acts is a test still to be made. On the open maria the centre lies below the margin in 10 of 12 (median m), and the rank correlation between dome strength and the height of the centre is (Study 5). The two exceptions are Serenitatis and Imbrium, the large maria of the contact, whose centres stand slightly above their margins ( and m). Through the attachment they were hot, carrying magma from the pear into the Moon. Serenitatis froze first, very close to the Earth, and the Earth’s gravity drew it outward more; Imbrium froze later, after detachment, as the Moon receded, and the pull acted on it less — hence against m, Imbrium the lower of the two. The literature expects a similar sag from the load of a mascon; the model agrees on the shape and names the dense body differently — the frozen feed dome, found also under the 44 openings without basalt.
Part F — The floor, the floors and the last scatterer. A liquid at rest cannot hold a slope, so a floor that froze as one body of melt shows one level. All 16 large floors show one level, and 188 of 189 smaller units; all 16 lie below their rim, by about 3 km (median 3.4 km), and below their land (median 1.6 km), which by chance would happen once in 65,000 (Study 6). Wrinkle ridges lie at 0.71–0.77 of the radius and graben at 0.76–1.22: the margin was stretched and the interior squeezed as the centre sank. In the contact, Imbrium, Copernicus H and Sinus Aestuum stand at the level of the plains beside them (, and km), with no step at the edge; Serenitatis lies 0.84 km lower, its margins being the layers of craters that came out of it. Beyond the contact, 9 of the 13 floors with a measurable plain lie below it (median km): the six large basins — Nectaris, Crisium, Humboldtianum, Smythii, Orientale and Moscoviense, the last from only 21 pixels of plain — lie one to two kilometres below (1.0–2.2 km), Humorum and Apollo about half a kilometre, Grimaldi ( km), Poincaré, Crüger–Sirsalis and Schiller–Zucchius within 0.2 km, and Ingenii, over South Pole–Aitken, stands 2.1 km above; the depth below the plain belongs to the large basins, not to the small maria (an earlier version said that every mare beyond the contact lies one to two kilometres below its plain). Around the far maria the ground rises in a collar built of their own returning material, m around the buried maria against m in the control (Study 16). Every floor is far cleaner than its land: of craters of 2–5 km a floor carries a twelfth of its land’s density (Study 7). The few craters the floors carry order them by when they froze, the contact last: beyond the contact the floors carry 83 times the density of craters of 10 km and more that the contact floors carry, and the hill floors 33 times, the catalogue entries of the basins themselves left out (Study 12; an earlier version, which counted them, gave 58 and 24). The source of these last craters is the last scatterer, the Earth, which after release went on throwing material from all sides.
Part G — Size and state: the maria and the craters in time. This Part is shared with Paper 6 (its Part E), and its main study is numbered jointly: Study 8 here, Study 5 there. Within Imbrium three craters show three states — Sinus Iridum melted in half, Plato smeared, Kirch sharp. Every crater of 3 km and more on the near-side basalt (3,478 in all) was measured against highland craters of its own size. Within the contact the floors carry a third of the small craters of the plains beside them (263 against 836 per million km² at 2–5 km): the rest vanished into the active maria. On the floors the sharp share falls from 71% at 3–5 km to none at 20–40 km, and the melted share rises from 17% to 85%. Two clocks run together: the maria cooled (a frozen lid thickens as the square root of time, so a mare ten times deeper stays liquid a hundred times longer), and the material arriving from the Earth grew smaller, though still hot, since reaching the Moon took 8.8 km/s at 17,000 km and 10.6 km/s at 60,000 km. A large crater is therefore an early crater on a soft floor. On the plains of the contact, heated from the Earth beneath, the rims of large craters were lost on the plain side ( of directions) and their surviving crests blunted, while on the plains beyond they were only flooded (Study 15).
Part H — The engine. An opening lives while its melt is fed and can flow. The force is carried by liquid: a solid would have to bear 13–16 GPa against a strength of about 0.2 GPa, as the fluid of a brake line passes the push of a pedal without resisting it. At that time enormous amounts of volatiles were in and around the material: they lightened and expanded the melt and drove out the material that built the margins. They have since escaped to space, and the dry interior measured today is the Moon after they left. The flux through an opening divides into what stayed in the body and what was thrown, and only the thrown part made craters. An opening seals when its flux falls below the critical flux, at which the heat it brings no longer balances its cooling, as a tap left running keeps a pipe from freezing; computing that flux is a stated requirement. While attached, the near side faced an Earth of about 2,000 K that filled a fifth of its sky (view factor 0.205), which held its surface near 1,345 K, above the solidus: through the whole attachment the near-side openings stayed hot and open, carrying magma from the pear into the Moon, while the far side, facing space, froze. At release the near-side maria were still hot and of low viscosity, which is why their floors are smooth like a frozen lake; they froze only afterwards, slowly and from the outside inward, over hundreds of millions of years and up to one or two billion.
Part I — The geometry of exposure, and the generations. As the tip narrowed from 6,000 to 3,000 km, the edge of the contact moved inward across the shell like a front, and an opening’s distance from the contact centre reads when it was exposed — as a deflated ball inflated on the floor lifts its faces off one by one, the centre last. A covered opening was a mouth and became an exit when the front passed, provided it was still active; the condition is boxed in the paper as . Three generations follow: I on the far side, open from the start; II in the belt, mouths first and exits later; III in the contact, the last mouths, exposed toward release. The maria threw the most during the flattening; the far side sealed in the inward rounding; the near side was still hot at release and froze only after it, which is why Imbrium carries 11 craters of 20 km and more per million km² against 205 on the highlands. Some openings of the limbs and the far side stayed active a little longer. The size of an opening is a memory of its feeding: the six largest feed domes, 450–909 km across, all lie on the near side, and the median diameter is 375 km there against 227 km on the far side, where the largest is Orientale, 435 km (an earlier version said that the openings of 200–1,200 km lie almost all on the near side).
Part J — Chemistry. Iron and titanium fall in rings around every mare: pooled over six maria, from 6.9 wt% FeO at 0–25 km to 3.1 at 100–150 km, holding at 3.3–3.4 out to 600 km, against 2.3 in the controls; around Procellarum they fall to the controls (Study 9). The fall also records sealing: light, volatile-rich material flew far early, and heavy, iron-rich material landed near late. Thorium, which stays in the last liquid of a cooling melt, is held by the contact: the contact disc, 17.5% of the surface, holds 95% of the thorium above 3 ppm. A cap of the same size moved over 16,200 centres puts the contact centre, fixed before the thorium was read, third, 47 km from the best (Study 10). Within the contact the plains and the highland carry nearly the same thorium (5.62 and 5.48 ppm) and the maria the least (3.99): the last thorium-bearing liquid sank back down their channels. Every mare of the contact is poorer than its ring (Study 13). Read as basins of external impacting bodies, the maria require about kg of foreign mass, yet the Imbrium melts match no chondrite group and the late basins added little (Study 11).
Part K — Dating. An opening carries five clocks: when it formed, when it was exposed, when it began to throw, when it sealed, and the age of its surface today — as a well is dug, uncovered, flows, is capped, and leaves a last puddle at its mouth. The radiometric ages (Apollo 3.1–3.9 Gyr, Chang’e-5 about 2.0 Gyr, Chang’e-6 about 2.8 Gyr) date when the sample cooled enough to hold its daughter atoms, not when the opening formed. Crater counts are used only to order surfaces, never converted to years, because the constant rate of arrival that conversion assumes is what Paper 6 replaces. The order of sealing read from the floors is: the buried far-side openings first, the open maria of the belt next, the maria of the contact last.
Part L — Statistics. Every comparison of the ground is like for like: the maria are removed from both sides, and the comparison says so. Areas are computed on the sphere, craters are assigned by their centres, and every dome is checked on two filterings of the gravity field. One table gathers every measured result with its sample and uncertainty, among them the sign test of 16 of 16 (), the collar of m against m (Mann–Whitney ) and the sharp craters of the contact floors, 82% against 56% (Fisher ).
Part M — Predictions and tests. Four ideas held during the work were changed by measurement: a peak of craters on every rim (found only as a property of the volatile-rich maria), a moat along the walls (the lowest point lies at 0.57 of the radius), a lava flow building the far margins (basalt covers 0–7% of the ring), and mare area as a measure of ejection. Of the fifteen studies, thirteen are green and two amber: in Study 13 the thorium part held and the titanium part did not separate the zones; in Study 16 the collar does not separate from the control around the open far maria alone. The studies are numbered 1 to 16; Study 14 was cancelled and the other numbers kept. Twelve predictions follow, each with its test — among them an opening above every feed dome in some stage, a dense body beneath every sunk floor, ground near a mare richer in its signature than ground far away, and basin melts carrying by their isotopes no meteoritic mass of a body of the literature’s size.
Part N — Discussion. The five records tell one sequence. The openings were exposed in the order the narrowing contact set; each threw material over the land around it while it was open; when its feed stopped, its floor froze as one level and sank over its dome; the far openings were buried by the layers they built, the near ones stayed hot and open while the body was attached and froze slowly after release; and the contact holds the thorium. The literature’s readings explain parts of this — the round basins, the thorium of Procellarum, basalt in low places — but not the 44 domes without basins, thorium shared by basalt and highland within the contact, or floors sunk only over strong domes. The tests that decide are the buried domes, the floors over them, the iron rings and the foreign mass.
Part O — Conclusions. Eight conclusions, in order: a mare is an opening over a feed dome; counted so, 73 domes, 44 buried, 33 of 34 maria on a dome; the buried domes carry the cover of the land and 8–13 km of extra crust; every floor is one level below its rim and sank over its dome; the maria are the source of the iron around them; the floors are clean, the contact cleanest; the contact holds the thorium; and the basins read as external bodies require a foreign mass their melts do not carry. Further work names the critical flux, the rim ring against measured volatiles, the last scatterer by distance, ruthenium and osmium isotopes of each basin, thorium at 26 km, and the youngest basalt against a centre fixed in advance.
Appendix A — The catalogue of openings. The appendix lists the 34 maria with position, distance from the sub-Earth point, zone and generation, the feed dome beneath each, and its cover: 4 in the contact (generation III), 11 in the hill (II) and 19 beyond (I); three of them — Ingenii, Apollo and Bailly — over South Pole–Aitken. The author first marked 36 openings by eye, numbered 1 to 36, point 35 being Copernicus H and point 36 Sinus Aestuum; these 36 marks are the sample of the crust test. Six marks did not hold as maria and four were added later (37–40), so the catalogue holds 34 and keeps the original numbers. Where Paper 1 speaks of the 34 maria it means this catalogue; where it speaks of the crust test, the 36 marks.
C.6 Paper 6 — The Craters
The oldest craters of the Moon were made on it while it was still on the Earth: material thrown from the openings returned to the shell at the speed it left — 5 km/s out, 5 km/s back, 46 GPa on basalt — and the craters rose with the shell. Some 99% of the Moon’s craters are of returned terrestrial material, thrown by the maria. The turning of the attached body sorted the landings: the trailing half collected the most craters, the leading half the hardest.
Paper 6 asks two questions: can returning material land fast enough to make a crater and leave the marks of shock, and do the craters of today’s Moon read as the record such landings would leave? It answers the first with the physics of the flight and the second with measurements on the whole Moon. The paper has seventeen Parts and an appendix; its studies are numbered jointly with Paper 5.
Part A — Terms and definitions. The words crater, impact and depth carry the literature’s reading, so they are fixed first. Returning material is material thrown from an opening that came back to the surface; a landing is its arrival, the word impact being kept for external bodies; a crater is the place where returning material landed. The word depth hides three heights, each with its own reference: the rim above the land, the floor below the land, and the rim to the floor, which is their sum — as a bowl set into a table has a lip above the tabletop and a bottom below it. Two craters can share the third and divide it differently between the first two, and that division is what the longitudes record. The rims are not equally kept: 43% of the craters at 90°W fall in the better-preserved half against 57% at 180°, so rims and floors are compared in the deeper, better-kept half of each size bin.
Part B — What the series has fixed. The craters were made in the three stages of Paper 3. In the outward rounding the craters on the shell changed with it, alike everywhere; in the flattening most craters formed, and the largest, from light, water-rich material; in the inward rounding they kept their size and the poles gathered them (Paper 7). A crater made on the shell rode with it and is not to be recomputed as if it had formed in today’s lunar gravity. Craters of 5 km and less, which mix primary landings, lumps of ejecta and spray, are not compared.
Part C — The craters, how many there are, and the crater as a record of the returning material. The source is the maria of Paper 5 together with the buried feed domes; on the parent their material landed at the speeds of the flight, and later, from the body itself, at the body’s escape speed or less, about 2.0 km/s at 1,300 kg/m³ and 2.3 km/s at release. Most of what a mare throws falls back into it, as most drops of a pot boiling over fall back into the pot; the drops that fall outside make the craters. The craters of 20 km and more were counted in four equal caps, maria and South Pole–Aitken removed: 249 per million km² at 90°E, the trailing half, against 139 at 90°W, the leading half; the ratio 1.79 (1.56–2.05) stays far from one, and the excess lies below about 70 km (Study 1). The literature expects the opposite, an excess on the leading half. The source test (Study 2) finds the mare’s iron in the ground and in the craters, falling with distance, as in Paper 5, with thorium following from 2.16 ppm near the edge to 1.02 in the controls. A last section asks how heavy a returning body had to be: on the parent, at 8.25 m/s² and 5 km/s, the same crater needs about 7 to 23 times the mass of a body at 15 km/s on today’s Moon, a sensitivity of the scaling law that a calibration of the target must turn into a mass.
Part D — The craters, visible and buried. Craters were lost in two ways, and the paper keeps two words for them. Buried is used only on the far side: a source that worked early was covered with its craters by the layers of the far side. On the 44 buried domes the density of craters is 0.48–0.95 of that on the ring around them, never above it, and the large craters are denser far from the visible maria (1,040 per million km² beyond 1,000 km against 467 within 150 km): they come from the buried domes and the visible maria alike (Study 3). Melted is used for the floors of the maria: a crater that landed on an active floor sank into it and closed. Of 79 craters of 10 km and more on the floors, 49 are melted (62%); one crater of 20 km and more on all 1.2 million km² of floor is sharp, 0.8 per million km² against 207 on the highlands (205 in Paper 5, on a slightly different highland area); on the 703,000 km² of the contact floors none of 20 km and more remains (Study 4). Beneath the melted craters the base of the crust stands km above their own floor in 13 of 16, with no sharp edge in the gravity: the material sank into the liquid mare and spread, and left no body in the shape of the crater (Study 14).
Part E — Size and state: the maria and the craters in time. This is the shared Part of Papers 5 and 6, the same text as Part G of Paper 5 (above): its main study is Study 5 here and Study 8 there, and its study of the plains of the contact is Study 15 in both. It shows the melted share of the floor craters rising with size and the small craters of the contact sharp, and reads both through two clocks: the maria cooling, and the material from the Earth arriving smaller, though still hot, after release.
Part F — The rim. The rims of 1,457 craters of 20–100 km were traced along 72 azimuths in four caps, maria and South Pole–Aitken removed. The rim records the forces at the moment of landing. The signs of a hard landing point to the leading half: in craters of 20–30 km its rims are a quarter more irregular than the trailing half’s (9.2 against 7.4 thousandths of the diameter), jump more between neighbouring azimuths (3.9 against 3.5), and are more often elongated (17% against 12%). The rim above the land is highest on the far side, a fifth to two fifths above the trailing half above 30 km, and lowest on the leading half among the craters of 20–30 km. The model reads four forces: on the far side the outward push of the shared rotation lifted the thrown-up material, on the leading half the ground ran into it, on the trailing half the landing was ordinary, and on the near side, facing the Earth, the same push pressed it down. Between the two halves it is the rim that differs, not the floor.
Part G — The bottom of the crater below the ground. The floor records the ground the material landed on. In craters of 20–30 km the floor lies 54 thousandths of the diameter below the land on the far side against 27 on the near side: deep in the crushed and melted layers of the far side, near the surface on the near side, filled from below by the maria. On the near-side basalt the floors of the large melted and smeared craters stand at its level, not at the depth of a crater, and a third of them stand above the basalt outside — a rise frozen before it could settle, which a floor filled from outside could not do (Study 10). The high floors are poorer in iron and titanium than the low (13.3 against 14.4 wt% FeO, 1.5 against 2.5 wt% TiO): they froze with the light, volatile-rich material, while the low ones settled with the heavy (Study 11).
Part H — The floor of the crater. The surface of the floor records what shook it and what filled it. In the better-kept craters of 20–30 km the leading half’s floors are 1.5 times rougher than the trailing half’s, and crater by crater a rough floor goes with a jagged rim, most strongly at 90°W (correlation 0.40) and least at 0° (0.02): the shock of the landing. The near side has the largest share of flat floor in every size bin: the maria filled them from below. A third reading, that the leading half met more space dust, predicts a larger excess on the shallower craters and is not supported.
Part I — The central peak. The peak records the energy of the landing. Below 50 km the leading half carries the most peaks, most clearly near the threshold size (60% of craters of 20–30 km against 49% on the trailing half); at 50–100 km nearly every crater has one; the height of the peaks follows the rims, highest on the far side and lowest on the near side, the mark of the rotation the shell shared with the parent. Rim, floor, roughness and peak together form one study (Study 6): the leading half carries the marks of a hard landing, the far side the highest rims and lowest floors, the near side the lowest rims and highest floors.
Part J — The engine. To be thrown at speed each kilogram needs at the opening: 2, 4.5, 12.5 and 32 MJ/kg at 2, 3, 5 and 8 km/s. The pressure that lifted the deep material (the lift cost of 139.78 GPa in Paper 3) was spent on the lift, as a pump’s push is spent in raising water to a roof tank; the ejection energy must come from the volatiles expanding at the opening. A landing of like on like at 5 km/s drives material behind the shock front at 2.5 km/s; on basalt (front speed 3.5 km/s plus 1.3 times that speed, density 2,700 kg/m³) the contact pressure is density times front speed times material speed, 45.56 GPa, and 12.96 GPa at 2 km/s — above the thresholds at which basalt minerals record shock. On the way back a body a kilometre across crossing a vapour column of 100 bar keeps about half its speed. A lump and a cloud of the same mass do not deliver the same shock, and the receiving surface must be stiff enough, to a depth comparable with the crater, to keep it. Every throw below about 10.748 km/s stays bound to the parent and returns.
Part K — The geometry. Material thrown straight up from the turning parent keeps its energy and its turning motion; when it returns to the same radius gravity has given back the speed it took, and the ground beneath turns at the same rate, so it lands at exactly its ejection speed. Higher up it turns more slowly than the ground, as a skater turns more slowly with arms out, and lands to the west: at 5 km/s it rises 1,932 km, flies 28 minutes and lands 1,032 km west. On a higher target the landing speed falls with height up to the corotation radius, about 15,883 km here, and rises beyond it, so a trend of shock in time belongs to one path and is not a property of the mechanism. Earlier versions of the series gave shock ceilings of 113 and 97 GPa and a trend of 102 to 86 GPa; reading the flights path by path showed that these held for one family of paths only, and they are no longer claimed. The last section turns to the body’s own ejecta: thrown from the trailing half, they fall back while the ground moves away and land softly; from the leading half the ground moves on into them and the landing is hard, as a runner meets rain on the face and not on the back; from the far side they fall back toward 170°E to 100°E. The trailing half therefore holds the most craters, and the leading half the hardest.
Part L — The chemistry. Around every mare its iron and titanium are highest next to it and fall outward, with an excess to 600 km, ten times and more the reach of sideways mixing by later craters (Study 2, in full here). The crater is poorer than its ground because it threw the veneer aside. Thorium halos the maria as well, but its map is too coarse for single craters. Inside the crater, from centre to rim, one material lies at every longitude, the same on the halves landed on hard and soft (Study 7): the crater is filled with the returning material that made it. Read as external bodies, the visible craters require – kg of foreign mass, two thirds of it for South Pole–Aitken alone; at the literature’s retention that leaves 2–6% of the upper 5 km of the crust (an earlier version gave 2–5%), which holds 0.9–2% at most — up to 6.7 times less than required; the literature’s whole bombardment requires kg against – in crust and mantle together, fourteen to eighteen times more, and the ruthenium isotopes of the crater melts, where measured, are the Earth’s (Study 8). The ejecta of the craters on the basalt are poorer in iron than the basalt, as the lighter material the Earth could throw after release requires (Study 12). The small fresh craters of 1–2 km are 1.19 times more numerous on the near side than on the far side, while the older craters of 10–20 km are only half as many there: the Earth, always in the near side’s sky, was the last scatterer (Study 9).
Part M — Dating. The paper orders the crater populations without converting counts to years: first the craters buried with the far-side sources; then the craters made while the body was attached, which rose with the shell; then the craters that landed on the active mare floors and melted; last the sharp craters on the frozen floors and the small fresh craters on the land. The last population is the material captured after release: with release the Earth’s pressure no longer reached the Moon and the Moon’s own ejections stopped, while the Earth went on throwing small and medium drops, some of which the Moon drew to it. Material from the Earth arrived at a few km/s plus the Moon’s own escape speed of 2.4 km/s at today’s radius (2.3 km/s at release), not at the 15–20 km/s of an asteroid, and is made of the Earth’s material. Hence the predictions for the maria: craters small for the mass that made them, shock below the asteroidal range, and no contrast of composition between the returning body and the ground it landed on.
Part N — Statistics. The shapes were measured on 1,457 craters of 20–100 km on the SLDEM2015 elevation model at about 60 m, compared only within the same size bin and the same cap. Peaks and crests are read by fixed rules set before the comparison and applied alike to every region. Intervals are bootstrap intervals; the counts of Studies 1 and 9 were also resampled by whole cells of 5° by 5°, so that craters clustered around one source are not counted as independent, and stayed clear of one. The chemistry is read against the calibration scatter of the maps, 0.81 wt% FeO and 0.43 wt% TiO.
Part O — Predictions and tests. Fourteen focused tests are set out, each with its claim and its measurement: among them ejection and flight, the trend in a series of events, the terrestrial source, the maria as the source, the ring of active spray, the buried feed domes, the longitudes, the missing foreign mass, and the record carried on the shell. Fourteen studies are listed, eleven green and three amber. In Study 6 some intervals of the rims of the larger craters include zero; in Study 11 the iron difference, read against the basalt just outside each floor, is not beyond chance; in Study 12 the craters that stayed within the basalt do not yet separate the model’s reading from the literature’s. The numbering is joint with Paper 5: Study 5 here is Study 8 there, Study 15 is the same study in both, and Study 13 of this paper (like Study 14 of Paper 5) was cancelled, the other numbers kept.
Part P — Discussion. The records of the paper tell one process in three records: where the material landed, set by the turning of the attached body; how hard it landed, written in the centre and the rim; and what ground it landed on, written in the floor. The trailing half carries 1.4 to 1.8 times the leading half’s large craters; a flux from outside would give a leading-half excess of some tens of per cent and no reason for the trailing half’s gentler craters, while the body’s own ejecta give both. The size distribution of the craters remains a constraint to be met by carrying the sizes and speeds of the thrown material through break-up, landing, saturation and burial. What is new is the difference between the return speed and what the source can throw, the speed relative to a turning surface, and the parent’s gravity and vapour as part of the crater’s conditions.
Part Q — Conclusions. Nine conclusions, five on the physics and four on the record: a returning body lands as fast as it was thrown; at 2–5 km/s the landing makes 13–46 GPa; the source must throw fast, the material must cross the vapour and arrive whole; a shock trend or ceiling belongs to a path, not to the source; a crater made on the parent must be computed at the parent’s gravity of about 8.25 m/s², five times the Moon’s today; the craters carry no foreign mass; the maria are the source, and craters were lost by burial on the far side and by melting on the mare floors; and the two halves record the body’s own ejection. The tests of Part O decide the attribution measurement by measurement.
Appendix — Reproduction and the novelty map. The flight table is recomputed step by step as a segment of a Kepler ellipse from an ejection radius of 6,721 km: semi-major axis, eccentricity and mean motion, the exit angle, the flight time, and the westward landing as the difference between the angle the surface turns and the angle the material sweeps. There is no general flight ceiling of 44 hours; near the escape energy the flight lengthens without limit. The novelty map separates prior art (secondary craters, transfer of material from the Earth to the Moon, shock and crater scaling) from the model’s hypothesis (internal ejection onto the shell of the body attached to the pear) and from the paper’s own calculations, and places the attribution of the observed craters with the tests of Part O.
C.7 Paper 7 — The Poles
The Moon’s poles carry more craters per unit area than its equator because the young Moon was flattened by its fast spin while it stood on the pear, received its craters evenly on that flattened figure, and then rounded at constant volume while still attached, so that its polar surface closed up and the craters on it were gathered toward the two ends of the spin axis. The crowding expected is not one number but a range that rises with the age of the craters — about 1.6 for those formed at the peak of the flattening, about 1.2 for those formed late in the attached stage, 1.0 for those formed after release — and the clean count, maria and South Pole–Aitken removed on both sides, gives 1.20 0.05, rising with crater size from 1.09 to 1.53.
Part A — The observation. Part A measures, before any explanation, where the craters stand. The counts use the Robbins (2019) catalogue, craters of 20 km and more (6,973) and of 40 km and more (2,329); a density is always a number of craters divided by an area, so that regions of very different size can be compared. In the raw count the caps of 30° about the two poles hold 219 craters per million km² against 166 in the equatorial band , a ratio of 1.32, and 1.51 for craters of 40 km and more; the band adjoining the north pole reaches 300 (1.80 times the equator). Cut by longitude the Moon is even more uneven (84 to 251, a factor of 2.97), but this is a separate east–west pattern: a latitude band contains every longitude, so the two profiles must be kept apart, and removing the basins and maria narrows the longitudinal range to 1.68 while it leaves the polar density in place. The mask is the 20 basins of 500 km and more and the LROC mare polygons, with their area removed from the denominator as well as their craters from the count — as one counts trees per hectare on dry land, not on the pond. After it the two bands adjoining the poles stand at 305 (south) and 300 (north). The caps of decreasing radius show how the excess is arranged: about the north pole, where no basin or mare reaches within 20°, the density rises from 189 in the cap of 60° to 300 in the cap of 15° and stays at 298 in the cap of 10°; the south looks flat in the raw count only because South Pole–Aitken occupies it, and once the basin is removed it too rises toward its pole (305 at 15°, 348 at 10° on 36 craters). The excess is larger for the larger craters at both thresholds. Counted in equal caps of 30° about the six ends of the Moon’s three axes, after the mask, the sub-Earth point is the sparsest (148), the leading point next (174), the poles and the far side above them (221–246) and the trailing point highest (252): the order of a body flattened by its spin and stretched along the Earth line by the tide. The trailing excess (1.45 in the caps, about five counting standard deviations, but only about one in the pole-to-pole bands) lies about 90°E, on the side that carries more maria of its own; the model reads it as returning material from the openings landing about them, , and the link from mare area to craters is a requirement. Inside South Pole–Aitken the ring within 10° of its centre holds 132 craters per million km², 0.59 of the ground just outside its rim; the finding is measured here and passed to Paper 8. The comparison on which the paper rests is like for like: the maria (22% of the belt, 1% of the caps) lower the equator and inflate the ratio, South Pole–Aitken (24% of the caps) lowers the poles; removed on both sides, the ratio goes from 1.32 to 1.11 0.04 (maria removed) and to 1.20 0.05 (maria and South Pole–Aitken removed). The figure after is one counting standard deviation; with 95% confidence the clean ratio lies between 1.10 and 1.30 (an earlier version read the as the 95% interval).
Part B — What we tried before the answer. Six readings were examined and set aside, each held to four questions in order — sign, size, shape on the axis, survival of the mask — and each left something to the account. Preservation on old highlands is real and orders the Moon at large scale (219, 164 and 99 craters per million km² on the far side, the limb belt and the contact disc), but the excess survives the mask, the crown of the far side (221) stands below the poles, and the north pole has a centre. Rotational flattening of a surface already cratered has the wrong sign: it gives , 0.83 and 0.59 for the figures of the attached stage; behind the scenes this is where the method changed, from looking for what makes a flattening to looking for what undoes one. The tidal stretch into the Roche figure () likewise thins the poles and crowds the sub-Earth point, the reverse of the counts; the figure is kept as the shape to be undone. Stronger gravity at the pole moves nothing sideways: on the spinning body the pole is a hilltop of the effective potential, about J/kg or 120 km above the equator, and it becomes the engine only when the densifying body can no longer carry its flattening. A sink at the pole asks for a peak at a point, but the northern density levels off inside 15° and every force of a rotating body is symmetric about the axis, which makes a ring, not a point. A uniform change of size leaves every ratio at 1.00. What remains is one change of shape: a flattened body returning to a sphere, which passes all four questions and alone makes the excess depend on crater size.
Part C — The mechanism. A soft spinning body takes the Maclaurin figure, whose flatness depends only on the spin and the density: the relation between and the eccentricity rises to a maximum of 0.4493 (), and at 5.5 hours no fluid body lighter than 1,070 kg/m³ can hold together. When the body first held itself, at the rigid Roche limit for 1,300 kg/m³ (12,994 km; 10,314 km at 2,600), it turned with the Earth once in 5.5 hours and its axis ratio was 1.69; as it densified on the pear the same spin could hold less (1.44, 1.30, and about 1.20 late in the attached stage, 71% of the flattening gone), and at release it was round, its shell rigid (axis ratio at most 1.04, Paper 2 §B.7) — a requirement of the model, not computed in this paper. The free tidal figure at 2,600 kg/m³ ( at 20,595 km, just beyond the fluid Roche limit of about 20,000 km for that density) is used only to illustrate the tide’s share; at release, 16,400 km, no fluid figure exists and the body is held by its rigid shell. When a flattened figure rounds at constant volume the polar surface shrinks by and the equatorial surface opens by , so craters formed evenly end crowded at the pole point against the equator by exactly ; averaged over caps of 30° against the belt the factors are 1.59, 1.38, 1.26 and 1.17 for figures of 1.69, 1.44, 1.30 and 1.20. The poles are the standing points because the spin axis passes through them: every meridian returns to them as the flattening relaxes, as spokes meet at the hub, and the whole ring 90° from the sub-Earth point is crowded, the poles most. Compaction from 1,300 to 3,344 kg/m³ shrinks every element alike (0.53) and changes no ratio. The engine is the body’s own gravity growing as it compacts — falls from 0.37 to 0.17 at nearly the same spin — and the rounding releases – J, 2.4% of the binding energy, enough to warm the interior by 30–40 K. The rigid shell, strained by ten to twenty per cent, would carry 2–12 GPa against a strength of about 0.1 GPa; the pressure escapes through the existing vents of the maria, the material thrown out returns and lands as craters, strongly while the figure is flattest and weakly later: large craters early, small ones late, so that crater size is a clock. Along the time line the tide measure falls from 2.01 at the hemisphere and 0.67 at the start of rounding to 0.17 at release, never below the fluid threshold of 0.09; the base, narrowing from 6,000 to 3,000 km, carried what the body’s gravity could not, and at the start of rounding the effective gravity at the two ends of the tidal axis was negative. The body did not slip gently off its base: it was pulled off with force slightly after its centre of mass reached the corotation line, about 210 km beyond it, where the month is born equal to the day (5.77 hours). In the series’ rough time line about 600 Myr separate the start of the bulge from release at 3.873 Ga — some 400 Myr for the bulge and the pear, about 100 Myr of flattening, about 100 Myr of inward rounding — so the rounding was paced by densification, not by relaxation; the figure was fixed well before 16 Earth radii (Paper 4 §C.3), and the fossil flattening of today, , is four hundred times smaller than the 0.4 of the peak. The material demands of two layers meet in one requirement: an interior of – Pa s that follows its figure within – years, under a shell of Pa s or more (the shell Paper 3 requires to keep the craters made on the Earth) on which the craters ride whole, like tiles on a floor pushed together at the joints, shortening toward the poles and fracturing toward the equator.
Part D — Tests. Five tests were set with their pass lines before the counts, every ratio given with its 95% interval (exact binomial for counts, a bootstrap of 20,000 resamplings for medians). The density ratio: predicted 1.1–1.6, measured 1.20 0.05 on the clean count (95% interval 1.10–1.30); below 20 km no comparison is made, since secondaries, spray and saturation govern there. The size clock: the ratio rises with diameter — 1.09 (20–30 km), 1.15 (30–40), 1.26 (40–60), 1.53 (60–100), 1.84 0.38 (100–300) — and read backward through the geometry of Part C these point to figures of 1.10, 1.17, 1.31, 1.63 and 2.00; the craters of 60–100 km recover the peak of 1.69 computed from spin and density alone. Because the size law has , craters that shrank with the surface would hide the crowding at any fixed threshold; the measured excess is itself the mark that they kept their size, and at the same threshold the polar median is the larger, 1.06 (1.01–1.12). Behind the scenes, an earlier reading had the polar craters shrink by 9% and compared medians at a lowered threshold; that comparison measured the threshold, and the paper follows the stiff shell instead. The young craters, formed on the round body, must show no excess: 0.92 on the Copernican craters of the LPI database and 1.12–1.16 on the physically dated sample of Mazrouei et al. (2019), consistent with 1.0 but too few to exclude 1.2 (probabilities 0.22–0.52); separating the two needs about 150 dated young craters in the caps and 300 in the band. The young population is also uniform in longitude (3.11 against 2.84 per million km², far side against near), so whatever crowded the old craters had stopped before the young ones formed. North and south: after the mask the south-to-north ratio is 1.02 (0.78–1.32) at 15° and 1.02 (0.94–1.10) at 60°, equality inside every interval. Five tests of size ask whether the polar craters shrank by the factor of 0.79 the deformation would give: the largest craters per equal area are larger at the poles, 1.16 (1.04–1.29); the hump of the size distribution stays at 80–113 km, with a scale factor of at least 1.09; old against fresh craters give a double ratio of 1.02 (0.89–1.16); the ellipticity at mid-latitudes exceeds that of caps and belt by about 0.01, a tenth of what deformation would leave; and the simple-to-complex transition gives 16.4 or 14.0 km in the caps against 16.8–16.9 in the belt, where shrinkage predicts about 13. Four find the size kept; none finds the shrink.
Part E — What remains. One process accounts for six observations, each with a number computed before the count: the polar excess and its rise with size, the larger polar median, the equality of the two poles, the order of the six axes, the absence of an excess among the young craters, and the recovery of the flattest figure from the largest craters. Five observations are measured but not derived, and are stated as such: the trailing-side excess (1.96 raw, 1.45 after the mask), whose link to the openings about 90°E awaits the ejection-and-return calculation; the crown of the far side, dense (221) where the geometry asks for less, stated as a requirement that the crown of the dome did not contract as a free end; polar craters of 20–100 km shallower than equatorial ones (depth-to-diameter about 0.062 against 0.074 at 20–30 km); a meridional alignment of the most elongated craters at 30°–60° (45–51% against 20–25%), with the lighting of the images as the first suspect; and the crater-poor centre of South Pole–Aitken, passed to Paper 8. The further work turns requirements into calculations: the figure of a body with strength; a verified and larger list of young craters (the published table of Mazrouei et al. and the 1,615 rayed craters of Werner & Medvedev); the two-layer relaxation solved along the attached stage; the trapped pressure at detachment; the tide’s share of the crowding on a body held by its base; the spacing of polar craters as a direct measure of the contraction; the shortening and extensional structures the shell should have left; the yield of craters from the openings about 90°E and 90°W; and the innermost caps with the next catalogue below 20 km.
C.8Paper 8 — South Pole–Aitken
The crater-poor centre of South Pole–Aitken records a heat source beneath the far side — the burner — opposite the openings of the near side, with two exits, Imbrium the main one and Serenitatis the secondary. While the body was attached the heat came from the Earth, entering through Imbrium and Serenitatis; after release it was the Moon’s own, with the radiation of the nearby Earth fading as the Moon receded, and everything cooled slowly. Its heat reached the surface where the crust was thin: the region rose into a dome whose softened crust slid outward, volatile and even refractory material was driven off, the layers of returned material were cooked and compacted, iron-rich material from the Earth’s interior came to the base, and when the heat calmed the dome cooled and collapsed into the basin seen today. The dome lies south of both exits, a direction set by the pear and the rotation, and the change from the flattened figure to the sphere enlarged the distance from 17–21° to the 24–29° of today.
Part A — Introduction: the basin and its enigma. South Pole–Aitken (SPA) is the largest basin on the Moon, about 2,400 by 2,050 km, its floor 6–8 km below the surrounding highlands, the deepest ground on the Moon, and the oldest large basin that can still be recognised (about 4.25 Ga from its samples). Chang’e-4 landed on its floor and Chang’e-6 returned the first far-side samples from it. Craters are the Moon’s clock, and a surface this old should be full of them; its centre is not. Counted in rings outward from the middle, on ground cleaned of the lava plains and the maria, the centre holds about half the craters of the ground just outside the rim, the place where they are fewest — the minimum — lies about 270 km north-north-east of the centre, and the craters that remain are shallow under high rims. The basin is set apart in other records as well: thin crust ringed by thickened crust, an iron- and thorium-rich floor with little visible lava, a dense mass deep beneath it, a mantle dried and poor in oxygen, melt rising for some two billion years, and strong crustal magnetism on its margins. The accepted reading is a giant oblique impact about 4.25 Ga — from the north in most readings, toward the south in Andrews-Hanna et al. (2025) — with each feature given its own explanation; six things remain unexplained or strained: a deficit concentrated in the centre that sharpens when the lava is removed, its off-centre position and its loss of the middle sizes, the scarcity of lava in the thinnest crust, an east–west rather than north–south asymmetry of the ring, a span of melts of two billion years, and a field that is weak at the minimum. The model proposes one process instead. The burner is heat from the Earth’s interior that crossed the attached body along the line of the openings and gathered beneath the far side, warming the ground from below as a flame warms the base of a pot. At the burner’s time SPA lay about 27° from the far tip of the elongated body — the point opposite the centre of the contact — and on the sphere of today the same separation reads about 39.5° (southward 22° 33°, eastward 15° 22°), a change from the flattened figure to the sphere and not a motion over the surface (an earlier version, measured from the point opposite the old reference point 23°N 320°E, gave 34–36° 48.6°). An antipodal relation survives both the turning of the body and its rounding, so a point and its opposite still face each other through the centre.
Part B — The anomalies of SPA (overview). Part B takes the anomalies one by one, each in six steps: what is measured and by whom; why it is strange; what science says; where that falls short, closed by a verdict (explains, explains partly, explains with difficulty, does not explain); what the model says; and how the measurement fits it, closed by its own verdict (fits, fits partly). The two verdicts stand in separate boxes and neither compares itself with the other. Where the paper made the measurement itself, a study in the seven steps of a research report follows (Studies 1–5). All crater comparisons are like for like on old ground: the lava plains of the LROC map, the 34 maria of Paper 5 with the core of the feed dome beneath each, and a halo of 200 km around each mare are removed from counts and areas on both sides, and every density is divided by that of the ring just outside the rim (39.57–50° from the centre at 53°S, 191°E).
B1 — The crater record (Study 1). SPA as a whole holds 7% fewer craters of 20 km and more than the rest of the Moon on the same ground (213.9 against 230.2 per million km²), 11% fewer than ground at the same latitudes, and the shortfall sits in the centre: 0.51 of the outer density within 10°, 0.81 in the next ring, about nine tenths from 20° out. The cleaner the ground, the stronger the deficit (0.59 on all ground, 0.56 without lava plains and maria, 0.51 without the halos too), so young surfaces blur it rather than cause it; it survives on the basin’s ellipse (122–132 in the core). A continuous density map places the minimum at 45.4°S, 197.9°E, record strength 0.45, on the meridian of the point opposite Serenitatis (197.9° against 198.8°) and 212 km from the Chang’e-6 site; the poorest of eight sectors are the north-east and north. The middle sizes are missing most (0.47 at 20–40 km, 0.91 at 10–20 km; 4.62 small craters per larger one in the centre against 2.13 elsewhere), and the craters of 40–80 km in the central 20° are 18% shallower than in the rim belt (4–33%), with rims standing higher than in a matched control (1.35 against 0.92). Science: does not explain. Model: fits — heat from below erased and relaxed the craters, later craters landed on compacted ground with high rims, and a late spray of small fragments fell on top.
B2 — Shape and depth (Study 2). SPA is the lowest region of the Moon: its intercrater floor lies at km and 6–9 km below its rim, depending on how the rim is defined. Measured only on the ground between craters (every crater of 20 km and more removed with a margin, and the openings — the 36 original marks of the series — with them), the basin is deeper than its thin crust explains by isostasy by 1.1–1.8 km at the centre, falling to about 0.2 km at the rim, the same for every margin. Science: explains. Model: fits — a dome that collapsed, with compaction strongest at the centre; a column of 9–15 km that lost 12% of its voids sinks by 1.1–1.8 km, and the lowest ground lies above the dense mass.
B3 — Thin crust. In all four GRAIL crustal models the crust is 15–28 km at the centre against 41–51 km outside: the basin has lost about half its crust or more. The thinnest crust (about 61°S, 184°E), the lowest intercrater ground (61°S, 199°E) and the dense mass (62°S, 200°E) lie within about 230 km of one another in the south (an earlier version gave about 200 km). Science: explains (a southward-travelling impact; Apollo by a blow of its own). Model: fits — the crust slid off the heated dome, was pushed outward by the expanding hot material and melted from below, with small domes of thin crust over the two exits, Ingenii and Apollo. Why the weakest crater record lies on the northern side of the thin zone, about 450 km from its thinnest point, is left open.
B4 — The outer ring (Study 3). With the regional far-side trend removed, the crust around SPA is thickened in all four models by 3.8–5.7 km at 50–55° from the centre, about 320–470 km beyond the rim (an earlier version gave 350–430 km), about 450 km wide; the ring stands above the crust farther out in seven of eight directions, thick to the east (7.8 km toward 97°) and missing to the west, and it holds about 37% of the crust missing from the basin. Science: explains partly — an asymmetry along the east–west axis is predicted by neither impact direction. Model: fits — the material that slid off the dome piled at the margins, narrow and close where it met the thick far-side crust in the north-east, wide in the west and south-west.
B5 — The inner ring (Study 4). A second ring of thickened crust, found in 22 of 24 directions, is centred at 51.4°S, 196.8°E, about 118 km east-north-east of the ellipse’s centre, its inner wall steepest to the north-east (30.7 m/km) and gentlest to the south-west (11.5 m/km). Science: explains partly. Model: fits — the ring is the edge of the dome, its centre the dome’s centre, 29° from the Imbrium exit and 24° from the Serenitatis exit today; both rings follow the thickness of the surrounding crust, piling steeply against the firm crust of the north-east as snow against a kerb.
B6 — Density and porosity (Study 5). At the surface SPA is as porous as the highlands (19.7% against 20.3%); at 10 km depth its pores are nearly closed, 2.9–4.4% at the centre against 6.2–7.9% in the far-side highlands and 9.6–12.8% in the rest of the far side, rising steadily toward the rim in both depth models; the grains are denser at the centre (3,005 against 2,897–2,920 kg/m³). Science: explains partly — composition gives the density but not a compaction at depth that weakens from the centre outward, since overburden closes pores alike everywhere. Model: fits — heat held long beneath the centre cooked and compacted the porous returned layers, and the porosity difference over 0–20 km accounts for 0.5–1.2 km of the subsidence of B2.
B7 — An unusual floor. Lunar Prospector gamma-ray maps show iron falling steadily from the centre (9.5, 8.6, 6.6, 4.9, 4.4%), thorium low at the centre (1.7 ppm) with its maximum at 10–20° and hot spots of 4–5 ppm in a crescent to the north-west, and a potassium-to-thorium ratio of 451–455 across the whole interior, 16–20% below the comparison regions. Science: explains, each finding by its own cause. Model: fits — a melt lake above the burner south of the two exits, heavy material raised with the heat, thorium carried off with the melt toward the trailing side, and volatile loss across the whole heated zone.
B8 — Little visible lava. Only 4.1% of SPA is mare, against 30% of the near side (an earlier version gave 32%); the cover is 14.6% in the inner 300 km and 0.7–1.3% at the margins, and a central cap of near-side basin size holds 8.4%, less than any of the eight near-side basins with similar crust, limb basins excluded (22–74%, mean 51%; an earlier version gave a mean of 42%, which included the two limb basins). Science: explains partly. Model: fits — the basin was heated and melted from below rather than flooded; only at the hot centre did melt reach the surface, and the vast heated area dilutes the percentage, which accounts for most of the gap.
B9 — Buried basalts and the central mare. The buried lava of Wang et al. (2024) lies almost wholly inside a circle of 15° about the dome’s centre (13.6–24.1% of it), together with most of the visible lava, and thorium forms a one-sided crescent at 12–32°, a layer weakening with distance. Science: explains. Model: fits — the dome first held a large, ordinary mare, later closed and buried; the burner’s exits lie at 37.6°S, 160.0°E and 27.3°S, 198.4°E, the antipodes of the centres of Imbrium (37.6°N, 340.0°E) and Serenitatis (27.3°N, 18.4°E) — the crater counts use the antipodes of the opening points, 37°S, 161.5°E and 25.4°S, 198.8°E — and the outflowing liquid was turned by the rotation toward the trailing side, as a simulation at the 5.77-hour day reproduces only while the body turns fast.
B10 — The dense mass. GRAIL gravity shows a diffuse density excess of at least kg in the mantle beneath SPA, deeper than 300 km in the preferred bound (James et al. 2019), in the southern half of the basin. Science: explains partly — dense material held in a stiff mantle, but its source rests on a cored striking body and its southern position is not derived. Model: fits — iron from the Earth brought by the burner, pushed up over the mare zone (radius about 12.4° against 15°), sinking while the mantle was hot and freezing in place as it stiffened, leaning toward the warm, soft south.
B11 — A mantle that lost its volatiles. The Chang’e-6 samples, about 11.6° from the dome’s centre, carry isotopically heavy potassium and iron (Fe 0.13–0.21), and the potassium-to-thorium ratio is low and flat over the whole heated region against 563 in the highlands and 537 in the rest of the far side. Science: explains partly — a brief impact flash gives heavy potassium but not a uniform deficit over 2,400 km nor heavy iron. Model: fits — strong, concentrated and sustained heating, a low flame under the pan rather than a blowtorch passed once, drove off moderately volatile elements and even part of the iron’s light atoms.
B12 — An oxygen-poor mantle. Two independent methods on 23 Chang’e-6 basalt fragments give IW beneath SPA against beneath the near side, about thirteen times less available oxygen: the most reduced mantle known. Science: explains partly — two mechanisms are possible and not yet separated. Model: fits — prolonged heat drove off the oxygen-bearing substances and metallic iron from the Earth consumed the rest, as steel wool rusts in water, and the iron sank with it (B10).
B13 — A depleted source. At Chang’e-6 the same region gave a KREEP-rich basalt at 4.2 Ga () and an ultra-depleted source at 2.8 Ga (). Science: explains. Model: fits — material arrived from the Earth rich in the escaping elements and was washed out by repeated melting from below, like a tea bag used again and again; the elements that left are found in the thorium crescent, and the refractory residue explains the scarce late lava of B8.
B14 — Metal in the ancient norites. Two norite clasts of about 4.25 Ga carry iron–nickel metal with Ni/Co of 8.5–11, above the metal of lunar basalts (below 5) and below the Earth’s mantle (18.7), the Earth’s core (about 20) and primitive meteorites (21.0). Science: explains, as material of the striking body. Model: fits partly — all metal on the Moon is of terrestrial origin, and so is this; its ratio was lowered by re-melting in a reduced setting and by mixing about half and half with low-ratio metal that is itself terrestrial (giving about 10–12); the ratio cannot decide between a terrestrial and a foreign source, the isotopes of Cr, Ti, Mo, Ru and Os can, and this is the sharpest test of the paper.
B15 — Prolonged volcanism. The dated record runs from the norites (4.25 Ga) and the rich basalt (4.20 Ga) through a reset at Ga to thin late deposits of 3.7–2.2 Ga, the visible lava peaking at 3.6–3.2 Ga. Science: explains with difficulty, through two impacts at one point and two mantle sources. Model: fits — one sequence: the burner while attached, fed by the Earth’s heat; the separation at 3.873 Ga that closed the attached stage; and then the Moon’s own heat, with the fading radiation of the receding Earth, cooling slowly in shrinking volumes. The buried lava of the central circle is predicted to be 3.87–3.6 Ga old.
B16 — The magnetism of SPA. In the field model T2015_449 at 25 km, the centre is nearly bare (0.8% of the area above 5 nT within 10°, 2.0% at 10–20°), the ring holds 14%, the north, west and north-west 32–42%, the east and south none; at the minimum the field is 1.9 nT (0.85 nT at a test point about 20 km from it, the value an earlier version gave for the minimum itself). Science: explains partly — the weak centre and the strong rim each get an explanation, but the side and its coincidence with the thorium rest on chosen assumptions. Model: fits — the heat erased the centre’s magnetisation and much of its iron sank out of reach, while iron carried with the fluid to the trailing side sank there; magnetism and thorium share the side, not the place (the magnetic peaks lie some 8° north of the thorium centre). Who magnetised the iron is future work.
B17 — The light swirls. The bright, reliefless swirls sit on magnetic anomalies; Mare Ingenii, inside the crescent near the Imbrium antipode, has a mean field of 5.9 nT with 48% of its area above 5 nT, while Mare Moscoviense, a far-side mare with flows, has 1.3 nT and none. Science: explains partly — the brightening is explained, the source and place of the iron are not. Model: fits — swirls form where a flow froze over metallic iron from the deep Earth, in the crescent, and not where there was flow without that iron.
B18 — The anomalies together. Of the seventeen anomalies, science explains six fully, nine in part, one with difficulty and one — the crater record — not at all; the model fits sixteen and one in part (B14, which the isotopes will decide). The difference lies in how the answers are built: science gives each anomaly its own cause, while in the model all are ordered about one long-lived centre and in layers by depth, the exits with their small domes (Ingenii 12–16 km, Apollo 5–9 km of crust) in the north, the dome and the hot centre south of them, and the crescent of thorium, magnetism and swirls on the trailing side — as a flame kept under a pot leaves a pattern about the hottest point, where one hard stir would not.
Part C — The antipodes: from a flattened figure to a sphere. The points opposite Imbrium (37°S, 161.5°E) and Serenitatis (25.4°S, 198.8°E) both fall in the northern part of SPA, 1,022 km apart, their midpoint about 650 km from the basin’s centre (an earlier version gave about 700 km). A rigid copy of the near-side basins printed about their antipodes gives envelopes of km (axis ratio 1.60) from the rings and km (1.72) from the 19 mare polygons, against km (1.17) for SPA, with orientations that do not agree; the negative result is kept, because the burner sets where craters were erased, not the outline of the basin, which belongs to the dome and its collapse. Set on one map, the centres of Part B fall in three groups along one north–south line: the two exits with their small domes in the north; the dome’s centre, the basin’s centre, the magnetic peak nearest the minimum and the crater minimum within 6° of the dome’s centre (within 9° of one another; an earlier version said within 6° of one another) in the middle; the lowest ground, the dense mass and the thinnest crust within about 230 km in the south. The line from the Earth’s centre through the contact centre (24.1°N, 335.2°E) leaves the far side at 24.1°S, 155.2°E, 41.8° from the dome; inside the rotating pear, however, the push is perpendicular to the Earth’s spin axis, so the heat entered the contact disc north of its centre, where the two burners lie, and left the far side up to about 22.5° south of the point opposite — the pear stood at 10–25°N, and the outward push of rotation is level at any height, as on a carousel. The exits and the dome were laid out on the elongated body (); when it became a sphere, distances from the end of its long axis opened without anything moving over the surface: the Imbrium exit changed coordinates by 5.5°, the Serenitatis exit by 11.8°, the dome’s centre by 13.0° and the minimum by 12.6°, and the dome’s distance from the exits grew from 17° and 21° to the 24° and 29° of today. The rotation decided that the dome lies south; the change from the flattened figure to the sphere decided how far. A change of the Earth’s axis after the separation may make SPA appear out of line with the burner; the axes are left for future work.
Part D — The dynamic version: column, rotation and angle. Part D asks whether the numbers allow material and heat to cross from the Earth’s interior to the far side. Conservation of angular momentum gives radial speeds of 1.8–2.6 km/s and transit times of 1.2–1.5 hours, a fraction of one turn; the kinetic energy, 1.6–3.4 MJ/kg, converts ideally to 5–10 GPa at 3,000 kg/m³. The effective potential rises from the surface to a hilltop at the corotation radius; from the local radius of the flattened Earth at the source latitude, 25°N (6,602 km), to 16,399 km at the 5.77-hour day, the barrier is 26.2 MJ/kg, which a parcel rising alone falls short of by a factor of seven to sixteen. The model’s material is not a lone parcel but a continuous body under positive pressure: the part beyond the corotation radius lowers the pressure beneath it, and material from below is pushed up as in a siphon, while the engine remains the source pressure of about 150 GPa of Paper 3 — the relief acts only at the late stages, and the effective barrier and the reduced base pressure for a body of Paper 3’s shape are a requirement. On the far side the rotation helps material out of the vents, stripping a late spray of small fragments that return as small fresh craters on the large ones; material leaving below the escape speed of about 2.3 km/s at the radius of then, 1,890 km, and rising less than about 700 km stays within the Moon’s Hill sphere (about 2,600 km from its centre at 16,400 km, 1.4 radii of the Moon of then) and lands back on it (an earlier version, with today’s radius, gave 2.4 km/s and 900 km). A Coriolis deflection cannot place both exits relative to the basin (the antipode of Serenitatis lies 7.8° from the centre in its sense, that of Imbrium on the other side), so the geometry comes from the horizontal push of Part C; a small exit angle of 1–3° kept over a path of 9,447–11,199 km places the heat 165–590 km from the point straight opposite.
Part E — Challenges and responses. Seven published findings that seem to stand against the proposal are answered from the paper’s own material. Iridium and gold in Chang’e-6 metal grains (Liu et al. 2026) lie in undated regolith fragments, where fine space dust later drawn onto the surface layer is allowed, and element ratios do not separate an asteroid from the Earth’s metal-rich interior. The Ni/Co of 8.5–11 in the norites (Su et al. 2025) places the metal above the metal of lunar basalts, but the Earth’s mantle (18.7) and CI chondrites (21.0) both lie above it, and a grain’s ratio moves each time it re-melts, so the ratio cannot tell the two sources apart; the isotopes decide. The dense mass lies about 500 km south of the minimum because the minimum marks where heat erased craters at the surface and the mass where heavy material sank. The nearest strong magnetic peak lies about 230 km from the minimum, where the field is weak (1.9 nT), as heat that erases magnetisation at its core and leaves it at the cooler margins requires. The crust at the minimum (19–28 km) is not the thinnest (15–24 km at the nominal centre), because the claim is that the deficit lies inside the zone of thin crust, its place set by the direction of the exits. The buried basalts of Wang et al. (2024), at least km², are a product of the burner, not a rival; the test is whether the shallowing of craters persists outside them. And the rule “except in the regolith” concerns the source of a sample, not where it was collected: foreign material in an ancient sample, if found at all, is expected only in tiny amounts.
Part F — Predictions and tests. The sharpest is that the Moon’s ancient samples hold no material of non-terrestrial origin: the metal in the two dated norites must carry a terrestrial signature in Cr, Ti, Mo, Ru or Os. If foreign material is found at all, it is expected in tiny amounts — space dust, or one or two meteorites landed over four billion years. Further: volatile loss and reduction strongest near the minimum and weaker toward the rim; shallow craters persisting outside the buried basalts; floor-fractured craters concentrated in the deficit; magnetisation strongest at the margins of the heated core and sourced at depth; a deficit that follows the antipodes of the near-side openings; a large early mare, closed and buried, with a gravity signature of its fill; a late spray of small fragments, the small craters on large hosts fresh while their hosts are degraded (a frozen sample of 20 hosts inside SPA and 20 in a control, 2,634 candidate small craters, awaits inspection); two crater populations of different age; and young craters higher-rimmed inside SPA than outside. Two predictions are already measured in the paper: the rings of crust that slid outward are confirmed, and the compaction at depth is supported. The tests that need new data are listed: the spatial minimum of depth after the mare mask, a count of floor-fractured craters, thorium, iron oxide and hydroxyl sampled along the crater profile, the depth and direction of the magnetisation, a null test for the choice of Serenitatis among all the openings, and an out-of-sample test.
Part G — Conclusions and further work. The five studies were each stated with a threshold fixed before the measurement, and all five came out green: the crater record (0.51 at the centre, the minimum on the Serenitatis meridian, the middle sizes missing, shallow craters with high rims; limit: small central counts); the depth remainder of 1.1–1.8 km (limit: the dense mass can fill part of it); the outer ring in seven of eight directions (limit: it holds about 37% of the missing crust); the inner ring in 22 of 24 directions; and the closure of pores at depth (limit: extrapolated from published inversions). The conclusions follow in the order of the argument: the centre is poor in craters and holds shallow ones, the deficit leaning toward the point opposite Serenitatis; this is read as a heat source beneath the far side, fed through Imbrium and Serenitatis during the attached stage — at least about years, and in the model about 600 Myr from the start of the bulge to release at 3.873 Ga — which, as a feed from the Earth, ended at release, after which the Moon’s own heat and the fading radiation of the receding Earth acted and everything cooled slowly; the depth, the rings, the closed pores, the chemistry of Chang’e-6, the reduced mantle, the long volcanism and the magnetism fit the same reading; a rigid mirror of the near side does not make the basin’s shape, and that result is kept; the centres lie on one north–south line in three groups; the southward direction is set by the pear and the rotation and enlarged by the rounding; the Earth’s axis is left for future work; and the sharpest prediction can be decided by isotopes. Further work: a physical model of the heat path and its energy budget; a redox budget for the reduction; the dynamic tests recomputed with the series’ constants, giving the effective barrier and base pressure of Part D; the tests of Part F; and, as future work outside the series’ papers, the Moon’s and the Earth’s axes at the time of the rounding.
C.9 Paper 9 — The Stripes
The long, straight stripes on the floor of the North Pacific are the leading side of the pear on which the Moon was built: stretched in the direction of the Earth’s rotation while the pear stood, and folded into stripes when it was gathered back into the Earth. The pear’s tip — the place where the Moon was formed — lies west of the base, on the trailing side, and left its outline in two bends of the stripes, a mirror imprint of the near side and two chains of ridges drawn up as it was lifted away.
Part A — Introduction: the stripes. Six stripes — Mendocino, Pioneer, Murray, Molokai, Clarion and Clipperton — cross the floor of the North Pacific for thousands of kilometres; Clipperton alone runs for some 7,240 km, more than the radius of the Earth. They are seen best on maps of the vertical gravity gradient, which show where the pull of gravity changes sharply over a short distance and so pick out narrow folds and troughs whether they lie at the surface or beneath younger material. All six are parallels of one equator: each keeps a constant distance from one tilted great circle, as the lines of latitude keep a constant distance from today’s equator. Lines of this kind are what one turning motion about one axis leaves behind, and six of them sharing one equator, from 33.6° north of it (Mendocino) to 1.8° (Clipperton), is a strong constraint on how they were made. Part A then recalls the pear of Paper 3: one bulge of the young Earth, broad at its base near Kiritimati (1.9°N 157.5°W), narrowing to the tip on which the Moon sat, and leaning back against the rotation, as a child walking outward on a turning roundabout is pushed backward. Its front, facing the rotation — the leading side, on the east — was stretched; its back, the trailing side, lay beneath the leaning tip. The Moon’s release did not make the pear collapse: the sorting, which acts on the pear whether or not a Moon sits on it, gathered it back into the Earth over tens to hundreds of millions of years after release. The mass did not leave the Earth; it moved from high outside to deep inside, and the leading wall was laid along the floor and folded back on itself as the stripes.
Part B — The observations. Eight observations, each stated first as what the map shows and then as what the model expects. The stripes form one belt about one equator (B.1), with two further stripes about 6° and 14° south of it (B.4), so that the base lies inside the system, not at its edge. The base of the pear, placed in Paper 3 from the deep mantle before the stripes were considered, lies 1.6° from that equator, beside Clipperton at 1.8° (B.2): a finding, not a choice, since a body rising from a spinning planet rises where the outward pull of the rotation is greatest, on the equator of its time. The stripes run from the base eastward to America and do not continue as straight parallels to its west (B.3). At four crossings — near 36°N 178°W, in the Line Islands near 6°N 159°W, near the Phoenix Islands at 2°S 175°W and near 13°S 152°W — the stripes pass beneath the volcanic ridges, and the ridges stand whole (B.5): a groove cut from above would cut the ridge, as a knife drawn across a tablecloth meets the book lying on it, whereas a fold made from the sides and from below passes beneath it, as a rucked cloth lifts the book whole. West of the ridges the outer stripes leave their parallels and turn toward each other — about 14° and 8° in oblique views with vertical exaggeration of 30 and 200, a first reading to be measured on a flat map (B.6). Beneath the base the lowermost mantle is slow in all five models of the seismic vote maps, and the centre of the Pacific low-velocity province lies 1,480–1,660 km to the south-south-west (B.7). West of the tip the floor and its margins are crumpled in every direction — the Philippine and Mariana arcs, the arcs of Indonesia, the hooked Banda arc — at 8,100 to 10,300 km from the base, about one pear-length (B.8): the back of the pear, which had no single pull of its own and was gathered back in no order, as a rug pushed into a heap crumples rather than lying flat.
Part C — The pear tip: the place where the Moon was formed. West of the base the northern stripe bends down at 23.8°N 164.9°E and the southern stripe bends up at 5.3°S 173.2°E. The two bends are 3,360 km apart (3,040–3,700 km when each mark is moved by 15 pixels), between the 3,000-km contact on which the Moon sat at release and the 3,650-km dome above it; their centre, 9.3°N 169.3°E, lies about 3,760 km west of the base (3,762 km by the coordinates; an earlier version gave 3,770 km), on the trailing side, where a pear that leaned back would bring its tip down. The base and the southern edge of the tip lie on the equator of the stripes; the centre of the tip lies about 15° north of it (14.4°–16.4° for inclinations of 10°–14°). That is not the release latitude of 22.5°, which is the direction of the Moon’s centre from the Earth’s centre: the two are different quantities in different frames, and relating them belongs to the future work on the axes (C.1–C.2). Inside that region lies the imprint of the near side as a mirror image — two faces pressed together exchange east and west and keep north, as a rubber stamp prints the reverse of its face — enlarged by , the factor by which every length on the Moon has shrunk since its density rose from 1,300 kg m on the tip to 3,344 today (a second route through the stages of the series gives 1.31). With Imbrium kept at the author’s mark, 13.19°N 179.04°E, the mirror places Serenitatis on the Marshall chain 410 km from the centre of the tip and the contact centre 1,260 km from it, both inside the footprint of radius about 1,680 km; Nectaris, far south on the Moon as well, falls just outside, at 1,970 km (C.3). A first reading by eye had marked Imbrium, Serenitatis and Nectaris as a direct image; the requirement that two faces in contact leave a mirror showed that the three marks could not all be right, and the rule of the mirror, applied from Imbrium alone, replaced it. Finally the stripe system, from the place of the tip to the eastern end of Clipperton near America, is 9,360 km long, against a pear that reached 9,680–9,800 km from the Earth’s surface to the corotation line at release (16,399 km, a day of 5.77 h): a wall laid flat covers about as much floor as it once stood tall, as a felled tree does, and the two lengths agree to 4% with nothing fitted between them (C.4).
| One width, measured four ways | km |
|---|---|
| The contact on which the Moon sat at release (Paper 3) | 3,000 |
| The spatula ridges, island pair to island pair (Part D) | 2,800–3,500 |
| The two bends of the stripes (C.1) | 3,360 |
| The dome above the contact (Paper 3) | 3,650 |
| The tip to the base (C.2) | 3,760 |
How to read the table: the rows are ordered by size, and the shade deepens with it. Two rows come from the pear of Paper 3, three from the floor of the Pacific; all five lie within about three and a half thousand kilometres, the width of the place where the Moon sat.
Part D — The spatula ridges. On either side of the mirror imprint stand the large ridge chains of the central Pacific: the Marshall–Gilbert–Tuvalu chains in the west, with the Mid-Pacific Mountains and Wake farther north-west, and the Line Islands in the east, with Palmyra and Kiritimati. The paper reads them as ridges drawn up from above at the separation. The picture is a plasterer pulling a flat spatula straight off fresh plaster: the soft layer clings to both surfaces, is stretched as the gap opens, and is left in ridges along the edges of the spatula. Here the spatula is the tip with the Moon on it, the wall is the floor, and the plaster is a viscous layer between them. The chains are 2,800–3,500 km apart (Majuro–Kiritimati 3,490 km, Tarawa–Palmyra 2,810 km, middle to middle 3,290 km); the western chain passes through the centre of the tip, Kwajalein lying 180 km from it, and the eastern chain carries the base itself. A ridge drawn up in one moment should not show the steady age progression of a plume track — the line of volcanoes a fixed column of hot material leaves as the floor moves over it, like scorch marks from a candle beneath a sheet of paper drawn across it. The Line Islands erupted in two episodes, 81–86 and 68–73 Ma, each at once over 1,200 to more than 4,000 km, and the literature reads them as stretching of the outer shell, not a source rising beneath; the Marshall Islands span 66–140 Ma with no simple order; Hawaii–Emperor alone shows a clean progression, 0 to about 81 Ma. A comparison with ridges read as built from below outside the Pacific — Ninetyeast (5,000 km long, 77 Ma in the north to 43 Ma in the south), Walvis and Chagos–Laccadive — in ages, shape, flexural moat (the trough the shell bends into under a load), crustal root (the thickened keel beneath a ridge) and orientation is set out for Study 7.
Part E — The equator of then. Every stripe measured rises northward toward the east: Mendocino +2.4°, Murray +12.7°, Clarion +9.0°, Clipperton +11.0°, the southern stripe +11.7° (E.1). Lines of this kind are what the parallels of a tilted equator look like on today’s map. Fitted together, the stripes are parallels of one equator inclined to today’s by at least 10°: a line near a tilted equator rises at most at about the angle of the tilt, so a smaller inclination cannot produce Clipperton and the southern stripe; inclinations up to about 20° fit almost equally well, because the points span only some 55° of longitude (E.2). At 10°–14° the base lies on the equator of the system; the first fit, 11°, crosses today’s equator at 159°W, 1.5° from the base. The stripes were laid down as the pear was gathered back, after the release (E.3). Until then a mass of nine to twelve lunar masses (Paper 3, from the width of the base) stood high above the surface on one side of the Earth; moved from high outside to deep inside, it changed the arrangement of the Earth’s mass about its axis, as a lump of putty pressed into a spinning ball makes the ball roll slowly to a new balance. The stripes therefore record the equator at the time the pear was gathered back, and perhaps the beginning of that turn. How far and how fast the Earth turned is left to future work on the axes.
Part F — Challenges. Three objections are answered. First, the floor between the stripes is dated to at most about 180 million years. In the model the floor gathers layers: a new layer is laid on top while the layer beneath is taken back and renewed from below, so what is dated is the last layer, not the stripes — as dating fresh snow on a ploughed field gives the date of the snowfall, not of the furrows that still show through it. The maps agree with this: on the topography the stripes are faint, on the gravity gradient, which sees density contrasts beneath the surface, they are sharp, as remnants beneath new material would be. The requirement is that where drilling or seismic profiles cross a stripe, the fold continues below the youngest layers and the layers above it are thinner over its crests (Study 9). Second, that the stripes pass beneath the ridges does not by itself fix which came first; a ridge that already stood above a forming fold should be shortened where the fold passes (Study 6). Third, the Hawaiian–Emperor chain has a clean progression; if it is a spatula ridge, the dated lavas must record a later sequence of eruptions on a ridge that already stood, and Hawaii remains the open case among the three chains.
Part G — Predictions, tests and the studies to come. Nine studies, each with the result it expects: (1) the equator refitted on full traces of the stripes, a common equator that passes through the base; (2) a test of chance for the base within 2° of the equator; (3) one side only — stripes that do not continue west of the base; (4) steps in depth and age across each stripe, ordered about the base; (5) the east–west asymmetry of the Pacific about the base; (6) continuity beneath the ridges on a flat map without exaggeration, the stripes unbroken by the ridges and the ridges disturbed where a fold passed beneath; (7) the spatula ridges against the three ridges built from below, distinguishable from plume tracks; (8) circular features at the mirrored places of Serenitatis, Nectaris, the contact centre and the other near-side maria at the scale 1.37; (9) the stripes beneath the dated layers in seismic profiles and drill holes, continuing below the youngest layer, with layers that change thickness across the fold.
Part H — Conclusions. The traffic light of the paper has five green rows — the base on the equator of the stripes, the width of the tip, the length of the stripes, the near side inside the tip as a mirror image, the stripes beneath the ridges at four crossings — and four orange rows waiting on the studies: the trailing side, the convergence west of the ridges, the spatula ridges and the age of the sea floor. Read as one picture: a pear of the Earth’s own material stood on the Pacific, its base near Kiritimati and its tip some 3,760 km to the west with the Moon on it; after the Moon left, as the pear was gathered back, its leading wall was laid eastward toward America as 9,360 km of stripes, its back crumpled into the arcs of the western Pacific, the tip drew up the ridge chains on either side of it, and the face of the Moon left its mirror image on the floor at the scale 1.37. The stripes record the equator of that time, tilted by at least 10° to today’s.
C.10 Paper 10 — Mars
The moons of Mars were made of Mars, not gathered from debris. A young Mars, 1.5 times its present radius and turning once in five hours, fired two plugs of its own crust from one volcanic conduit at Pavonis Mons, pushed by trapped gas. A ring that Mars had built earlier from its own steam gave each plug the sideways speed it lacked, rounded its orbit and drew it into the equatorial plane; the same friction ground it. The tide of the soft young Mars then pushed both moons outward. Deimos, first and long in the ring, passed the final corotation line and recedes, smooth; Phobos, second and braked, met only the thin edge of a waning ring, kept its grooves, was caught by the moving line and has been falling since.
Part I — What happened. Phobos and Deimos are small (27 and 15 km across), dark and porous, on near-circular orbits above the equator, on the two sides of the corotation radius of Mars, 20,428 km. Deimos is smooth and rounded; Phobos is scored by long grooves. Capture fails to give equatorial circular orbits; an impact disc, the leading account, mixes Mars with the impactor; in both, the surface features need separate causes. The paper takes the shared idea of the series — a body made of its parent’s interior, given its speed by the parent’s rotation — and follows it on Mars by another route. Mars built no pear and no closed dome. A young Mars of radius 5,084 km, turning in five hours, gave everything leaving its equator a free sideways speed of 1.78 km s, and held it down with only a quarter of today’s gravity, 1.04 m s; its corotation line stood at 7,057 km, less than 2,000 km above the ground. Beneath a sealed crust the planet held water and gas. A soft, warm plug sealed a conduit a few kilometres below the vent, and trapped gas at 0.25–0.5 GPa pushed it along a path of 200–300 km from a deep chamber, the walls held by the weight of the material around them. A free volcanic blast is limited to about 1 km s; a confined push of this kind gives 2.4–2.9 km s. One conduit fired twice: the first plug, Deimos, small, light and wet, left cleanly; the second, Phobos, larger and harder, dragged on the walls and was braked.
| Shot | Top, km | Outward, km s | Sideways at top | Orbit there |
|---|---|---|---|---|
| Phobos, braked, lower | 10,000 | 2.44 | 0.90 | 2.07 |
| Phobos, braked | 11,000 | 2.57 | 0.82 | 1.97 |
| Deimos, to the ring | 15,000 | 2.89 | 0.60 | 1.69 |
| Deimos, straight to its orbit | 23,463 | 3.19 | 0.38 | 1.35 |
Read from top to bottom: the higher the shot, the more the gas must give (shaded, deeper with speed), and the further the sideways speed at the top (km s) falls short of an orbit there. Each plug needs only to reach the ring; the ring and the tide do the rest.
A plug fired from the surface reaches the height of the ring but not its orbit: alone it falls back within one revolution. The missing speed came from a ring that Mars had built in its first stages from the steam of every fissure. Near the hot surface the steam stayed a clear gas; higher up it froze into ice crystals and dust circling at orbital speed, and beyond about 13,000 km, the Roche limit for ice, it gathered into clumps. A body crossing it is dragged forward toward the ring’s speed: it gains its orbit, rounded and equatorial, and the same friction grinds it. The ring must give at least about 0.6 of each body’s mass in perfect coupling, of order kg in practice; the account stands or falls with it. Beyond the line the tide of the soft, fast young Mars, dissipating 8 to 20 times more than today, pushed each moon outward. Deimos was carried from about 15,000 to 23,463 km in half a billion to a billion years, passing 20,428 km before the line arrived there, and was ground smooth, mostly in the clumpy outer ring at the end of its climb. Phobos reached only the thin, gaseous edge of a waning ring: it gained enough speed not to fall, was etched by gas and not smoothed by water, and receded more slowly than the line, which moved outward as Mars slowed. The line caught it near 19,000 km, when the day was about 22 hours, and it has been falling since; running its fall backwards at today’s dissipation places it at 19,100–19,500 km 3.9–4.5 Gyr ago. The inner ring fell back as dust; the rest evaporated. The mass that left through the line, of order 5–20% of the starting mass and mostly volatiles, took about 92% of the spin with it, and Mars slowed and contracted to its present state. The water that never left stayed sealed beneath the crust, where InSight found it.
Part II — The evidence. Pavonis Mons, at 1.48°N, the closest of the four Tharsis volcanoes to the equator, has a single circular summit pit 47 km wide and nearly 5 km deep, a steep-walled barrel with depth to width about 0.10; its volume, 8,300–8,700 km, is of the scale of the two moons together, 6,740 km — the roof of a chamber that collapsed after the shots. Olympus, at 18.65°N, would have started a moon on an orbit tilted by about 19°. Deimos is smooth and rounded, its hollows shallow (median depth about 2% of width, against 5.5% on Phobos); it left larger than it is now, having lost 30–60% of its mass, but not larger than Phobos. Phobos lost about 1%: its grooves are the scrapes of the conduit, its wrinkles the contraction of a cooling body, and Stickney the mark of a solid body that stood in the ring and struck a warm Phobos. Both moons have a sharp end and a blunt end, the blunt end facing Mars: the tip formed by the flow from behind, and tidal locking turned them later. The hollows on both were folded inward, struck while the bodies were warm and plastic; the moons are samples of a young Mars soaked with water beneath its surface. The Earth’s Moon never passed through a ring, and kept its craters.
Part III — The predictions. Seven predictions give a value, an instrument and a date, against what the accepted account expects at the same place: Phobos material on the Martian line in oxygen, chromium and titanium, with no impactor component, no evaporation shift in zinc and potassium, and closed vesicles of a cooled foam; pits that never cross grooves, and sharp groove rims; Deimos’s shallow hollows and its composition, the same as Phobos; a mass deficit beneath the Pavonis caldera; the centre of mass of Phobos displaced toward Mars, toward its blunt end; a water-saturated mid-crust beneath Tharsis; and in the Martian dust an ancient component, older than 4 Gyr, with grains carrying solar-wind helium and neon, most abundant in the equatorial band. The Martian Moons eXploration mission of JAXA, launched in October 2026, lands on Phobos in 2027 and returns its samples in 2031; an appendix lists fourteen proposed measurements, mission by mission. The account requires a fast, expanded young Mars, a soft one, the confined gas push — its critical step — and the ring.
C.11Paper 11 — The Requirements
A Moon built this way must look a particular way, and it does. Paper 11 states eighteen requirements — seven classical properties, the three exposure zones, seven that follow from the pear and three added by the later papers — each with the quantity that tests it, and reports them one by one rather than adding them into a score. The strongest of them, the ordering of the crust and the old craters about the axis of the old contact, was run against the data with thresholds fixed in advance: two of its tests passed; in the third, the crust is thinnest at the contact and thickest on the far side in all four crustal models, as predicted, and the contrast, about 10 km, is a number for calibration.
Part A — The seven requirements and their assumptions. A requirement is a property the Moon or the Earth must have if the Moon formed by this route; to each, the paper attaches the physical assumption needed to derive it, so that each test points to the part of the model it concerns. R1, affinity to terrestrial material: the Moon’s isotope ratios, a label of origin that later processing barely moves, must be reachable as one mixture of the two terrestrial sources of Paper 3, the deep feed and the rising sialic shell. R2, a small metallic core: all the Moon’s metal is terrestrial; much iron entered the pear, less toward its tip, and the feed that reached the Moon was mainly silicate with a little metal. The core is small because most of the core material returned to the Earth: at detachment the heavy core material lay in the last third of the body, did not cross the corotation line, and went back down the pear. For a core of 1.4% of the mass and a deep share of 0.95, the metal that reached the centre must have been about 1.47% of the fed material, so that “little metal” becomes a number Paper 3 must explain. R3, asymmetry linked to the aperture: the far side carries a thick crust of many layers of compacted sial, which migrated up to the tip during the bulge by the forces of the spin, together with material that returned to it again and again; the near side was the base. R4, orientation: the connection side faces the Earth, as two dancers holding hands face each other while both turn relative to the room. R5, an order of preservation: the far side kept its record before the fed side quieted, its maria falling still as cooling ended their internal pressure. R6, volatiles in the amount and phase the feed needed, at each depth. R7, the centre of mass: light crust thickened on one side moves the balance point toward the other, as a ball with a thick patch of cork on one side balances off-centre. Paper 10 is a separate test; its outcome does not change the parameters of the Earth–Moon case.
Part B — The requirements against the measurements. Each requirement is set beside its measurement, with “consistent”, “open” and “failed” used in a strict sense. The Earth–Moon oxygen difference is O ppm: for LEF this is what is expected, not what must be explained; the multi-system balance is open (B.1). The seismic core reaches a radius of about 330 km, about 1.4% of the mass (B.2). GRAIL finds the far side thicker; the shell on the dome of Paper 3, kg (3.9% of the lunar mass), matches the far-side crust of a 55-km far hemisphere, kg, to about 10% with no parameter adjusted between them, while the near-side crust, the sial of the base peeled away with the body, about kg, is a separate term (B.3). Present synchronism is a weak test (B.4). Four clocks — crystallisation, the literature’s impact age, basaltic fill and exposure — may be compared only within one kind, as the firing of the bricks, a later fire, a coat of paint and the weathering of a facade are four true dates of one house (B.5). Melt inclusions hold 615–1,410 ppm water, sealed in when they formed: the Moon was wet then, when enormous amounts of volatiles were in and around its material; these have since escaped to space, and the interior measured today is dry. The amount the feed needed is still to be derived (B.6). A crust of the modelled shape displaces the centre of mass toward the near side by 1.24–3.11 km for density contrasts of 300–750 kg m, against about 2 km observed — a sensitivity range, not a prediction (B.7). Then R8, the exposure zones (B.8): the contact was exposed last, the ring of the base during the rounding, the dome’s surface from the start, so the Moon is ordered in three zones about the near side. Five tests were fixed before the data were touched, and the maria are not masked, because they are part of the prediction. The tests were run in September 2026 on the four GRAIL crustal-thickness models and the Robbins catalogue, about the sub-Earth axis with the boundaries of that time: the contact disc (0–41°), the limb belt (41–90°) and the far side (90–180°). T5, the thickness trend in twelve belts of 15°: a rank correlation of on all four models, from 26.8 km at 30–45° to 45.6 km at 165–180°, monotonic over ten consecutive belts, against and about the poles — the predicted axis orders the crust better than any control; passes. T2, craters of 20 km and more: 99, 164 and 219 per km in the three zones, ratios 1.34, 2.21 and 1.65, each above its pass threshold; passes, and the order survives the conventional mare mask. T1, the contrast between far side and contact disc: 9.65, 10.0, 10.3 and 10.6 km on Models 1–4, and the ordering disc belt far side holds in all four; the prediction is the ordering, and the size of the contrast, about 10 km, is a number for calibration. The other conditions fixed in advance — far/limb at least 1.1, a monotonic order, no control axis with a sharper trend — were met. Recomputed on the current geometry — the contact centre at 24.1°N 335.2°E, the contact cap 0–31°, the belt 31–70° and the far part 70–180° as the translation rule of Paper 3 places them — the crater densities, maria and South Pole–Aitken removed on both sides, are 53, 187 and 220 per km (far/belt 1.17, far/cap 4.15, belt/cap 3.55), and the crust of Model 1 is 26.3, 30.3 and 36.2 km with the maria kept (far minus cap 9.9 km) and 31.3, 33.0 and 38.9 km with the maria and South Pole–Aitken removed (7.5 km): the ordering holds on both counts. Because a thick far side, an offset centre of mass and maria on the thin side are one distribution of material seen several ways, the rows are not added into a score (B.9).
Part C — Further signatures of the rise and the connection. Signatures that only this route predicts. The rigid shell carried its craters whole and kept their size — the polar median diameter is 1.06 times the equatorial — while the rounding crowded them, from 1.09 at 20–30 km to 1.53 at 60–100 km (C.1). The source region on the Earth is the base of the pear near Kiritimati, with the tip at 9.3°N 169.3°E (Paper 9); on the Moon the hill from which the body was built is centred near 16.6°N 13.1°E and the last contact near 24.1°N 335.2°E, with Imbrium the main exit and Serenitatis the secondary — close to the latitude of 22.5° at which Paper 4 finds the Moon left (C.2). The openings fall into three groups — on the crown, on the flank and under the base — by how long each was open to space (C.3). The body rounded while attached and left round with a rigid shell, by peeling: over the 6,000-km base the sial slid up the pear toward the tip, the direction of outward sorting, its slide eased under shear by the lubricated layer between sial and sima, and parted from the sima as tape lifted from a painted wall takes the paint and leaves the plaster; over the 3,000-km contact the heat melted the sial away; and slightly after the body’s centre of mass reached the corotation line, about 210 km beyond it, the last of the contact was pulled free with force. There was no neck (C.4). A link between the feeding lobe and the present deep structure remains a research direction (C.5). The pear adds seven requirements (C.6): R9, a pear about 9,000 km wide inside the corotation line, part of the Earth and held by the Earth’s gravity like any part of it, not thrown out because its speed is not a throwing speed and it has not crossed the corotation line; R10, nine to twelve lunar masses, derived in Paper 3 from the width of the base, gathered back whole into the Earth with nothing left in orbit; R11, the base above the Pacific low-velocity province, which we propose is largely the returned pear, part of the sorted material that went back into the Earth; R12, the thorium of the contact, brought from the Earth’s depths; R13, the core as a gauge of how close the feed came to the descending iron; R14, no foreign material beyond tiny amounts; R15, polar crowding by size, measured and passed. The papers closed after the pear add three (C.7): R16, the 34 maria as the openings and the source of the returning material, supported by 0.8 sharp craters of 20 km and more per million km on mare floors against 18.3 on the plains and 207 in the highlands (Paper 6); R17, two exits beneath South Pole–Aitken with the dome south of both, at 17–21° on the flattened figure and 24–29° on today’s sphere (Paper 8); R18, the Tharsis source on the Martian equator when Deimos left (Paper 10).
Part D — Consistency among the papers and conclusions. A table lists what each paper hands to this one and the condition it still leaves: corotation does not by itself prove release (Paper 2); the radial balance passes only from a passage of about 1,000 km radius holding 0.46 lunar masses under a sideways load of order N, which is why the connection is the broad base of the dome and not a stem (Paper 3); the shell’s viscosity, Pa s, is required, not measured (D.1). The chronology is a central constraint: the hafnium–tungsten clock, with a half-life of 8.9 million years, leaves about of its parent after the 600 Myr of the series’ timeline — some 400 for the bulge and the pear, about 100 for the flattening and about 100 more to release at 3.873 Ga — so the tungsten signatures were set early and must be carried through the window without resetting; a consistent reservoir history is to be computed (D.2). A map gathers every claim with its test and the branch of the model it bears on (D.3). The novelty is the combination, not any single process: an interior fed from below while its skin was the Earth’s own shell lifted on the dome (D.4). Seven conclusions follow, each with what it means; R8’s T5 and T2, R15, R16 and R17 have passed or are supported (D.5).
Appendix A — Reproduction of the centre-of-mass calculation. The short integration behind the offset: the symmetric part of the Moon contributes nothing, and only the denser mantle that reaches higher under the thin crust moves the balance point. With kg, km, a mean crust of 45 km and an amplitude of 15 km, the offset is the amplitude scaled by the ratio of the density contrast to the mean lunar density. The appendix also shows that the contact centre, 24.1°N 335.2°E, lies 34.0° from the sub-Earth point, so the computed offset need not point straight along the mean Earth line, and the test compares a direction as well as a length.
Appendix B — Map of prior research and novelty. Each component classed as standard physics, prior observation, prior art, model hypothesis, this work or open prediction. The measurements of oxygen, core, crust, basalt and water belong to the cited studies; the idea that a hot Earth heated the near side belongs to Roy and colleagues, and Procellarum as a magmatic system to Andrews-Hanna and colleagues; what the series adds is the simultaneous internal feed and rise of the outer shell, and the joint test of thickness, mass and offset in one model.
What Part C establishes. Read in order, the ten papers tell one process and leave a measured trace at each step. Papers 2 and 3 show that a body built from the Earth’s own material on the tip of a pear was released where the motion it already had was the motion of an orbit, and Paper 4 carries it from 22.5° and 17,496 km to today’s orbit. Papers 5 to 8 read the Moon as the record of that construction: the maria as openings, the craters as returning material that landed and was carried on a rigid shell, the poles crowded by the rounding, and South Pole–Aitken as the far-side mark of the burner. Paper 9 finds the other end of the same event on the Earth — the pear’s leading wall folded into the stripes and the place of the tip between their bends — and Paper 10 follows the same idea on Mars by another route — two plugs of crust fired from one conduit, their orbits completed by a ring — and gives two small moons and the reason one of them falls. Paper 11 gathers what all of this requires and states the test of each requirement; the key test, the ordering of the crust and the old craters about the old contact, has been run: two of its tests have passed, the ordering holds in every model, and the size of the crustal contrast, about 10 km, is left to calibration. Part D now gathers the series’ traffic light.
The traffic light of the series
ten papers have each measured or computed their own part of the process, and each has judged its own results. A reader who wants to know where the model stands as a whole should not have to open ten papers. The approach: every study and observation that a paper of the series has given a status is set in one table, with its number and its light; then the data the series used are listed, so that the reader can see what was measured by the series itself and on what.
Part C presented the papers one by one. This Part looks across them. It does not judge anything anew: each light below is the one the paper gave its own result, or, for Papers 2–4, which compute rather than measure, the status the paper itself states for each claim. The purpose is a single view — the whole series on one table — and an honest count of what has been measured and fits, what fits in part or waits for a study, and what was cancelled.
D.1 One table: every study and observation, with its light
The three colours. Green means that the hypothesis of the study, stated before the measurement, held in full on the measured sample — or, in Papers 2–4, that the calculation closes on the stated inputs. A green row may still name a limit (a small sample, a sub-test not yet beyond chance) when that limit does not contradict the hypothesis. Orange means that one part held and another did not yet separate, or that the result is stated as a requirement and waits for the calculation or the measurement that will decide it. Grey marks a study that was cancelled; its number is kept so that the numbering of the paper is not disturbed. No study of the series is red. T1 of Paper 11, whose predicted ordering holds in all four GRAIL models while the size of its crustal contrast, about 10 km, is left to calibration, is marked orange, as a result in which one part held and another waits for calibration.
How the rows were taken. Papers 5, 6, 8 and 9 each close with a traffic-light table of their own (Paper 5, §M.2; Paper 6, §O.2; Paper 8, §G.1 and the verdicts of §B18; Paper 9, Part H); their lights are copied unchanged. Paper 7 gives a result for each of its five tests (§D); “passes” is green, “consistent; not yet decisive” orange. Paper 10 grades the links of its account in a feasibility map (§G.5); links computed and holding are green, links computed on a stated input, stated as a requirement or waiting for data are orange. Paper 11 gives the state of each requirement (§B.9) and the results of the exposure-zone tests (§B.8). Papers 2, 3 and 4 state the status of each claim in their summaries and test tables (Paper 2, §C.1 and §D.1; Paper 3, §D.1 and §E.4; Paper 4, Part E). The number in the third column is the one the paper reports; the section where it is set out is named in that paper’s own table.
fits measured or computed, and fits partial / awaiting not yet decided cancelled
| Paper | Study or observation | Result | Status |
|---|---|---|---|
Paper 2 — LEF
Mechanism in Principle 7 green · 1 orange |
|||
| 2 | The velocity gap | On the corotation line the speed of rotation is the orbital speed: 15,818 km, 5,020 m/s for a 5.5-h parent (at the surface 2,133 against 7,701 m/s) | fits |
| 2 | The pear | A continuous pear bridges the Earth to the line; the Moon is released whole | fits |
| 2 | The offset of the day | Pear and sinking iron together: 5.77 h at release (the pear alone, 6.44 h) | fits |
| 2 | Corotation at release | Centre of mass on the line: 16,399 km (two-body; 16,331 km test particle) | fits |
| 2 | Angular momentum | 1.007 times today’s (an earlier version gave 1.008); the classical route needs 2.74 times | fits |
| 2 | The Roche limit | Rigid and round: axis ratio for GPa; 16,400 km lies beyond the rigid limit (9,484–12,994 km) | fits |
| 2 | Tidal evolution | The Moon recedes from release; margin beyond the line | fits |
| 2 | Core centralisation | during the transfer — a requirement: the Earth differentiates during the transfer, not after release | awaiting |
Paper 3 — LEF
Mechanism in Practice 4 green · 3 orange |
|||
| 3 | The pressure test | 150.26 GPa at the source; a deep melt lighter than about 3,864 kg/m³ reaches the corotation line (3,500 kg/m³ leaves 10.49 GPa) | fits |
| 3 | The body on the tip | A hemisphere on a 6,000-km base holding the lunar mass has 1,300 kg/m³ without adjustment; dome 3,650 km; surface three times the far hemisphere | fits |
| 3 | Release on the line | Viscous contact lets go about beyond the line: about 210 km for a contact about 105 km thick (Paper 3, §C.5a) | fits |
| 3 | The base over the Pacific province | 5 of 5 tomographic models slow beneath Kiritimati; inside the contour of SMEAN () and SMEAN2 () | fits |
| 3 | The joint test of pressure, flow and load | Radial balance only from a passage of about 1,000 km, already 0.46 lunar masses under a lateral load of order N: a thin pipe fails, the broad base is required | partial |
| 3 | The two provinces | Composition, shape and plume isotopes of the Pacific province against the African — to be measured | awaiting |
| 3 | The requirements handed on | Three-dimensional stability, deep equation of state, energy balance, time of failure of the contact — to be computed | awaiting |
Paper 4 — The
Orbit 3 green · 4 orange |
|||
| 4 | Source of the inclination | : release at 22.5° gives an orbit inclined 22.5° to the equator of that time | fits |
| 4 | The initial orbit | Nearly circular release from 22.5° at 17,496 km, about 210 km beyond the line (equations 6–7) | fits |
| 4 | Initial recession | from the first orbit | fits |
| 4 | Survival | About 7,200 km beyond the rigid Roche limit of 10,314 km — Roche test passed; deformation check open | partial |
| 4 | The present inclination | Reduced law: 5.145° at today’s distance, equal to the observed value — the full integration is required | partial |
| 4 | Distance and clock | About 384,400 km and 3.8 cm/yr today; no constant fits both ( gives the rate, the 3.87 Gyr since release) — requires integration | awaiting |
| 4 | Geographic link | The ancient latitude of the centre of mass, reconstructed independently of the orbit | awaiting |
Paper 5 — The
Maria 13 green · 2 orange · 1 cancelled |
|||
| 5 | 1. The maria on the feed domes | 33 of 34 on a dome; none of 20,000 random sets of 34 points reached 33 | fits |
| 5 | 2. The source test | Craters carry the iron of their ground, falling with distance: 6.9 to 3.1 wt% FeO within 150 km, control 2.3 | fits |
| 5 | 3. Basin or crater: the jump of the crust | The jump under 29 of 36 marked openings, against 4 of 169 ordinary craters | fits |
| 5 | 4. The buried domes | 44 of 73 domes buried; iron and thorium equal to the land around; crust thicker by 8–13 km | fits |
| 5 | 5. The centre sank over the dome | 10 of 12 open maria (median m; ); the exceptions are Serenitatis ( m) and Imbrium ( m), the two maria of the contact: Serenitatis froze first, very close to the Earth, and was drawn outward more; Imbrium froze after detachment as the Moon receded | fits |
| 5 | 6. One floor | 16 of 16 one level, below rim (median 3.4 km) and land (median 1.6 km); by chance once in 65,000 | fits |
| 5 | 7. Clean floors | A twelfth of the craters of 2–5 km of the land around; every floor cleaner at every size | fits |
| 5 | 8. Size and state | Craters vanished into the floors; melted share rises with size; sharp small craters on the contact (shared with Paper 6, Study 5) | fits |
| 5 | 9. Rings of iron and titanium | The excess of the maria reaches 600 km | fits |
| 5 | 10. Thorium and the contact | The contact, 17.5% of the surface, holds 95% of the thorium above 3 ppm; its centre, fixed in advance, third of 16,200, 47 km from the best | fits |
| 5 | 11. The foreign mass | Read as basins of outside bodies, the maria require about kg of foreign material; the melts carry no known one | fits |
| 5 | 12. The order of freezing | Ordered at every size from 2 km; the maria of the contact the cleanest | fits |
| 5 | 13. Thorium and titanium | Thorium held: the floors of the contact a third poorer than their plains; the titanium part did not separate the zones | partial |
| 5 | 14. — | Cancelled; number kept | cancelled |
| 5 | 15. The plains of the contact | Rim lost, and the surviving crest blunted, on the hot-plain side only in the contact; matched crest comparison on four pairs | fits |
| 5 | 16. The collar of the far maria | Above the control around the far maria, most around the buried; around the 10 open far maria (median 207 m) not separated | partial |
Paper 6 — The
Craters 11 green · 3 orange · 1 cancelled |
|||
| 6 | 1. How many craters, by longitude | 249–252 per km² at 90°E against 139–175 at 90°W; ratio 1.79 (1.56–2.05) | fits |
| 6 | 2. The source test | FeO 5.96 wt% within 50 km of the six maria, against 2.30 in 5,922 controls; excess to 600 km | fits |
| 6 | 3. The buried domes and the large craters | No excess on the buried domes; the large craters come from visible maria and buried domes alike | fits |
| 6 | 4. Craters melted into the floors | 49 of 79 of 10 km and more melted, the share rising toward the contact (chance about 3 in a million); no crater of 20 km and more on the 703,000 km² of the contact floors | fits |
| 6 | 5. Size and state on the maria | 0.8 sharp craters km per km² on the floors, against 18.3 on the plains and 207 in the highlands | fits |
| 6 | 6. Rim, floor and peak by longitude | Hard landing at 90°W (toothed rims 1.14–1.25 times 90°E); some intervals of the larger rims include zero | partial |
| 6 | 7. The inside of the crater | One material from centre to rim; 1,214–1,235 pairs, every interval includes zero between the halves | fits |
| 6 | 8. The foreign mass | The visible craters require – kg; the crust holds 0.9–2% against 2–6% required (an earlier version gave 2–5%); the ruthenium is terrestrial | fits |
| 6 | 9. The Earth as the last scatterer | Near-side excess of the last small craters, 1.12–1.27, secondaries removed | fits |
| 6 | 10. The raised floors | About a third of the large floors above the basalt outside; 84 of 86 on the plains | fits |
| 6 | 11. Iron of the high and low floors | Low floors richer; against the basalt just outside, against wt%, not beyond chance | partial |
| 6 | 12. The material after release | Ejecta poorer in iron than the basalt; among craters within the basalt, inside the scatter of the maps | partial |
| 6 | 13. — | Cancelled; number kept | cancelled |
| 6 | 14. The mass under the melted craters | More mass than their own floor in 13 of 16 (Wilcoxon, ); none under the plains | fits |
| 6 | 15. The rim: worn by heat or flooded | Lost on the hot-plain side only in the contact; crest comparison on four pairs | fits |
Paper 7 — The
Poles 4 green · 1 orange |
|||
| 7 | D.1 The density ratio | clean (maria and SPA removed on both sides); 1.09 at 20–30 km rising to 1.53 at 60–100 km | fits |
| 7 | D.2 Diameters | Polar median 1.06 (1.01–1.12) at the same threshold: the craters kept their size | fits |
| 7 | D.3 Young craters | 0.92 (0.39–2.04) and 1.12 (0.60–2.03): consistent, not yet decisive | partial |
| 7 | D.4 North and south | South/north 1.02 (0.78–1.32) at 15° | fits |
| 7 | D.5 Crater size | Largest per area 1.16 (1.04–1.29); old/fresh 1.02 (0.89–1.16); 4 of 5 size tests pass | fits |
Paper 8 — South
Pole–Aitken 6 green · 1 orange |
|||
| 8 | 1. The crater record | Central ring 0.51 of the density outside, like for like; minimum 45.4°S 197.9°E, on the meridian opposite Serenitatis | fits |
| 8 | 2. Depth against the thin crust | A remainder of 1.1–1.8 km at the centre, falling to 0.2–0.3 km at the rim | fits |
| 8 | 3. The outer ring | Thickened crust in 7 of 8 directions, thick to the east; holds about 37% of the missing crust | fits |
| 8 | 4. The inner ring | Present in 22 of 24 directions; centre 51.4°S 196.8°E, 118 km east-north-east of the basin’s centre | fits |
| 8 | 5. Porosity at depth | At 10 km: 2.9–4.4% at the centre, 7.1–8.8% at the rim, 6.2–12.8% around | fits |
| 8 | The anomalies B1–B17 | The model fits 16 of 17 (science: 6 fully, 9 in part, 1 with difficulty, 1 not) | fits |
| 8 | B14 Metal in the norites | Ni/Co and iron–nickel grains; ages 4.247 and 3.873 Ga — fits in part; the isotopes decide | partial |
Paper 9 — The
Stripes 5 green · 4 orange |
|||
| 9 | The base on the equator of the stripes | 1.6° from it, for an inclination of 10°–14° | fits |
| 9 | The width of the tip | 3,360 km, against the 3,000-km contact and the 3,650-km dome | fits |
| 9 | The length of the stripes | 9,360 km from the tip to the eastern end, against a pear of 9,680–9,800 km | fits |
| 9 | The near side on the Earth | Mirror image at with Imbrium in place; Serenitatis and the contact centre inside the tip | fits |
| 9 | The stripes beneath the ridges | Observed at four crossings | fits |
| 9 | The trailing side | Crumpled arcs west of the tip, 8,100–10,300 km from the base | partial |
| 9 | Convergence west of the ridges | First reading on oblique views | awaiting |
| 9 | The spatula ridges | Line and Marshall without plume age progression; comparison to be made | awaiting |
| 9 | The age of the sea floor | The dated surface is the last layer; the fold beneath it to be tested in seismic profiles | awaiting |
Paper 10 —
Mars 4 green · 6 orange |
|||
| 10 | The speed budget | Energy and angular momentum: 2.44–2.89 km/s outward to reach the ring, from the 1.78 km/s of the equator | fits |
| 10 | The equatorial site | Pavonis 1.48°N; both moons within 2° of the equator; Olympus would give about 19° | fits |
| 10 | The scale of the pit | Pavonis caldera 8,300–8,700 km³ against the two moons, 6,740 km³ | fits |
| 10 | The two faces | Hollow depth to width: Deimos median 1.9%, Phobos 5.5% (shape models) | fits |
| 10 | The gas push | 0.25–0.5 GPa along 200–300 km, against a confining pressure of 0.26–0.39 GPa; the critical step, to be modelled | partial |
| 10 | The ring | At least 0.6 of each body’s mass in perfect coupling, of order kg in practice; a requirement | partial |
| 10 | The climb of Deimos | 15,000 to 23,463 km in 0.5–1 Gyr for a Mars dissipating 8–20 times today’s | partial |
| 10 | The race of Phobos | Caught by the moving line near 19,000 km, day about 22 h; 19,100–19,500 km at 3.9–4.5 Gyr at today’s dissipation | partial |
| 10 | Spin and mass lost | About 92% of the spin, with 5–20% of the starting mass through the line; a requirement | awaiting |
| 10 | Material, centre of mass, dust | Seven predictions; awaiting the MMX samples (2031) and the returned Martian regolith | awaiting |
Paper 11 — The
Requirements 3 green · 5 orange |
|||
| 11 | R8, T5: axis specificity | Spearman () about the sub-Earth axis in all four GRAIL models; controls to | fits |
| 11 | R8, T2: oldest craters | Far/limb 1.34, far/disc 2.21, limb/disc 1.65 (Robbins, 6,973 craters km) | fits |
| 11 | The crust balance | Shell kg against far-side crust kg at 55 km: about 10% | fits |
| 11 | R8, T1: crustal thickness | Far minus disc 9.65 / 10.0 / 10.3 / 10.6 km in Models 1–4; the ordering holds in all four; the size of the contrast is a number for calibration. On the current geometry (contact centre 24.1°N 335.2°E; 0–31°, 31–70°, 70–180°), Model 1: 26.3 / 30.3 / 36.2 km, far minus contact 9.9 km, ordering holds | partial |
| 11 | R8, T3 and T4: mascon basins | Not yet run | awaiting |
| 11 | R7: centre of mass | 1.24–3.11 km for contrasts of 300–750 kg/m³, against about 2 km; the joint density model to be made | partial |
| 11 | R1–R6 | Oxygen ppm; core 1–2% of the mass; water 615–1,410 ppm in melt inclusions — each lacks its closing calculation | partial |
| 11 | R9–R14, R18 | Stated with their tests (§C.6–C.7); the position of R11 measured in Paper 3 | awaiting |
How to read the table. Read it first by colour, then by paper. The green rows of Papers 5–9 and 11 are measurements made by the series on public data, each against a hypothesis and a pass line fixed before the count; the green rows of Papers 2–4 are calculations that close on stated inputs; the green rows of Paper 10 are links of the Martian account that close by calculation. The orange rows are of two kinds, and the table keeps them apart in the wording of the status cell. “Partial” marks a result in which one part held and another has not yet separated — the titanium of Paper 5, Study 13; the larger rims of Paper 6, Study 6; the crustal contrast of T1, where the ordering holds in all four models and the size of the contrast, about 10 km, is left to calibration. “Awaiting” marks a requirement or a prediction that no measurement or calculation has yet decided — the plume isotopes of Paper 3, the thermal-orbital integration of Paper 4, the seismic profiles of Paper 9, the samples of MMX. No row is red.
Three rows need a word of bookkeeping. Study 5 of Paper 6 is Study 8 of Paper 5 — one measurement of the craters on the mare floors, counted by each paper in its own table; the series therefore has 88 distinct studies and observations (an earlier version gave 89), and two cancelled numbers. Paper 11’s requirements R15, R16 and R17 have already passed, but their measurements are those of Papers 7, 6 and 8 and are counted there (Paper 7, D.1–D.2; Paper 6, Study 5; Paper 8, the anomalies and Figure C.1). And the T2 count of Paper 11 keeps the maria in all three belts by design: the maria are the thinnest and youngest ground of the contact disc, which is the prediction itself; with the conventional mare mask applied to all three belts alike the ratios are 1.13, 1.37 and 1.21 — the same order (Paper 11, §B.8).
The count, paper by paper. The table below sums the lights. The bar in the last column draws each paper’s rows to the same scale, so that the reader sees at once where the series has measured most and where it still waits.
| Paper | Subject | Green | Orange | Cancelled | Rows | |
|---|---|---|---|---|---|---|
| 2 | LEF Mechanism in Principle | 7 | 1 | — | 8 | |
| 3 | LEF Mechanism in Practice | 4 | 3 | — | 7 | |
| 4 | The Orbit | 3 | 4 | — | 7 | |
| 5 | The Maria | 13 | 2 | 1 | 16 | |
| 6 | The Craters | 11 | 3 | 1 | 15 | |
| 7 | The Poles | 4 | 1 | — | 5 | |
| 8 | South Pole–Aitken | 6 | 1 | — | 7 | |
| 9 | The Stripes | 5 | 4 | — | 9 | |
| 10 | Mars | 4 | 6 | — | 10 | |
| 11 | The Requirements | 3 | 5 | — | 8 | |
| The series | 60 | 30 | 2 | 92 |
The bars show the shape of the series. The papers that read the Moon’s surface — the maria, the craters, the poles, South Pole–Aitken — are mostly green: they were built as measurements, each with its threshold set first, and they were run. The papers that build the mechanism (2–4) are green where the calculation closes and orange where they hand a requirement to a calculation not yet made: the stability and the equation of state of the feed, the integration of the orbit. Mars is more orange than green, because its links wait for a model of the gas push and for one mission. Of the 92 rows, 60 are green, 30 orange and none red. The count is not a score: as Paper 11 explains (§B.9), linked results must not be added as though they were independent experiments, and the table is read row by row, by the test of each row.
D.2What the series measured itself
The green rows above are, for the most part, measurements the series made with its own scripts on public data, not results borrowed from the literature. This matters for the reader’s trust in a new model: an account that only collects published findings that agree with it proves little; an account that states a hypothesis, fixes a threshold, and then runs the count itself puts the hypothesis to a real test, and here it did so. The list below names what was measured and on what data. Every comparison was made like for like — the same terrain removed on both sides, the same size bins, the same latitudes — and each paper says so in its study.
| Data set | What the series measured on it | Papers |
|---|---|---|
| Robbins crater catalogue [14] | Crater densities by zone, longitude, latitude and size; the oldest-crater test T2 (6,973 craters km); the polar crowding; the floors of the maria; the crater deficit of SPA | 5, 6, 7, 8, 11 |
| Wang et al. crater catalogue [15] | Depth-to-diameter, rim height and crater state; the melted craters | 6, 7 |
| LPI crater database; young and rayed crater lists [16, 17] | The young population of the poles (Test D.3) | 7 |
| GRAIL gravity: Bouguer field and gradients [18, 19] | The 73 feed domes; the 34 maria on the gradients; ringed and unringed mascons; the dense mass under the melted craters | 5, 6, 8, 11 |
| GRAIL crustal-thickness models [10] | The jump of the crust; the buried domes; T1 and T5 on all four models; the rings of SPA; the crust balance | 5, 8, 11 |
| LOLA and SELENE elevation (SLDEM2015) [20] | Floor levels, rims, collars, central peaks and floor roughness; the depth of SPA | 5, 6, 8 |
| LROC mare outlines [21] | The basalt removed on both sides of every crater comparison | 5, 6, 7 |
| Kaguya Multiband Imager, FeO and TiO [22] | The iron and titanium rings around the maria; the ground around and inside each crater | 5, 6 |
| Lunar Prospector thorium [23] | The thorium of the contact; the thorium of the maria against their ground | 5, 8 |
| GRAIL basin list [24] | The basins of 500 km and more removed in the polar counts | 7 |
| Lowermost-mantle tomography: vote maps, SMEAN, SMEAN2 [25, 26, 27] | The base of the pear over the Pacific province | 3, 9 |
| Marine gravity of the Pacific floor [28] | The stripes, their bends, the tip and the ridges | 9 |
| Published Chang’e-6 and Apollo analyses | The chemistry, ages, metal and magnetism of SPA; the siderophile budget | 5, 6, 8 |
| Orbits, shapes and densities of Phobos and Deimos | The launch speeds, the inclinations, the depth of the hollows, the centre of mass of Phobos | 10 |
The table is read by its shading. The navy rows are the crater catalogues and the gravity field, on which most of the green rows rest; the red-tinted rows are the maps of the surface — the basalt outline and the chemistry — used to remove the maria from both sides of each comparison and to trace the material thrown from them; the plain rows are the Earth and Mars. The studies themselves, in brief:
The Moon’s surface, by zone. The exposure-zone tests T1, T2 and T5 (Paper 11); the polar crowding by size, the crater diameters, the young craters and the two poles (Paper 7); the crater deficit, depth, rings and porosity of South Pole–Aitken (Paper 8, Studies 1–5).
The maria as openings. The maria on the domes, the jump of the crust, the buried domes, the sinking centres, the one-level floors, the clean floors and their order of freezing, the iron and titanium rings, the thorium of the contact, the collar of the far maria (Paper 5, Studies 1–16).
The craters as landings. Count and shape by longitude, the source test, the melted and raised floors, the mass under the melted craters, the inside of the crater, the foreign mass and the last scatterer (Paper 6, Studies 1–15).
The Earth. The position of the base of the pear against five tomographic models and two averaged models (Paper 3, §E.4); the geometry of the stripes, the tip and the ridges on the marine gravity field (Paper 9).
Scripts, belt means and inputs are deposited with the reproduction package (Code availability).
Requirements and the key observations
what must hold if the model is right, and what do its key observations show? The answer: each step is stated as a requirement with its test, and the two key observations of the model have been read against the data.
Part D showed what has been measured. This Part turns to what the model must still deliver, and to its two key observations. The requirements are those of Paper 11, which states each with its test; here each stands in one line, with its status, so that the reader can see the whole list at once and go to Paper 11 for the argument.
E.1The requirements
The conditions of the process. The process is admissible under standard physics only if the following hold. Each is a condition the papers compute and state with its test. The table carries the conditions of the first edition of this paper; the rows that later papers sharpened are given in their present form.
| Condition | Value | Paper | What tests it |
|---|---|---|---|
| A fast, expanded parent, its core still gathering | 5.5 h (window 4.90–5.54 h); expansion at least 98 km; at the start of the transfer | 2 | The spin of the early Earth before the Moon formed, within the window |
| A light deep melt | Below about 3,864 kg/m³ along the ascent | 3 | A volatile route that keeps the deep melt light at lower-mantle pressures |
| A broad, massive, viscous connection | A passage of about 1,000 km radius at least (0.46 lunar masses); contact 6,000 km, 3,000 km at release; a layer that flows rather than fractures | 3 | A connection that flows rather than fractures, carrying the body beyond corotation |
| Release beyond corotation | Margin of about 210 km: , km (Paper 3, §C.5a) | 2, 3 | The release state, beyond corotation |
| A rigid, round body at release | GPa, axis ratio ; 16,400 km lies inside the fluid Roche limit for 2,600 kg/m³ (19,971 km) and beyond the rigid one (10,314 km) | 2, 4, 7 | A body rigid at release |
| A stiff shell | Surface viscosity Pa s during the ascent | 3, 6, 7 | A crust that held its craters through the rise; a far-side crust thicker than the near side |
| A release latitude | 22.5°, the latitude of the centre of the contact and the upper bound of the release latitude and of (25° kept as a sensitivity case) | 4 | A source region placed at a latitude that gives about 5° today |
Two rows have changed since the first edition, and both changes made the condition sharper, not looser. The connection was first bounded by a radius above 854 km; the joint test of Paper 3 (§A.13) now places the threshold at a passage of about 1,000 km, already half a Moon in mass, which is why the connection is the broad base of the dome. The survival row first asked for an interior viscosity of order – Pa s for the time spent inside the fluid Roche limit; it now asks for a body rigid and round at release, because the flattening and the rounding happened while the Moon was attached (Paper 7) and what left the line was a body with a rigid shell (Paper 2, §B.7). The release latitude, first about 25°, is now the 22.5° of the contact centre.
The eighteen requirements. Paper 11 gathers what a Moon built in this way must show into eighteen requirements: the seven classical properties of the Moon (R1–R7), the exposure zones (R8), the seven that follow from the pear (R9–R15) and the three added by the papers that closed after it (R16–R18). Each line below names the requirement, its key number and its state. The colour follows the scheme of Part D.
| Requirement, in one line | Key number | Status | |
|---|---|---|---|
| R1 | The Moon is of terrestrial material, in several isotope systems at once | Oxygen: ppm Earth–Moon | supported |
| R2 | Little metal: a small core of terrestrial iron; most of the core material that entered the pear went back down it to the Earth | Core 1–2% of the mass (seismic about 1.4%) | supported |
| R3 | A thicker crust on the side away from the contact | Far side thicker by about 8–10 km; shell against crust kg | supported |
| R4 | One face toward the Earth, kept from the attached stage | Present synchronism | supported |
| R5 | A defined order of closure: the far side closed and kept before the fed side quieted | Comparable units on both sides | supported |
| R6 | Volatiles in the amount and state the feed needs | 615–1,410 ppm water in melt inclusions | supported |
| R7 | The centre of mass displaced toward the Earth, by the same crust | 1.24–3.11 km computed, about 2 km observed | supported |
| R8 | Three exposure zones about the near-side centre | T5 , T2 1.34 passed; T1 ordering holds, contrast 9.65–10.6 km (its size left to calibration); T3, T4 not run | partly passed |
| R9 | A pear that is part of the Earth, held by the Earth’s gravity, inside the line | Base about 9,000 km, contact 3,000 km | awaiting |
| R10 | The pear is gathered back whole into the Earth; nothing stays in orbit | Nine to twelve lunar masses, from a base of 9,000–11,000 km (Paper 3) | awaiting |
| R11 | The base of the pear above the Pacific province | 5 of 5 models slow under Kiritimati; composition and shape to come | position passed |
| R12 | The thorium of the contact, brought from the Earth’s depths | 95% of the thorium above 3 ppm in the contact (Paper 5) | awaiting |
| R13 | The core as a gauge of how deep the feed reached | 1–2% of the mass | awaiting |
| R14 | Little or no foreign material in the Moon or in the Pacific plumes | Multi-system isotope balance | awaiting |
| R15 | Polar crowding rising with crater size | 1.09 1.53 (Paper 7) | passed |
| R16 | The 34 maria are the openings; craters landing on active floors melted | 0.8 against 18.3 and 207 (Paper 6) | passed |
| R17 | Two exits, Imbrium and Serenitatis, and a dome south of both | 17–21° flattened, 24–29° today (Paper 8) | passed |
| R18 | On Mars, both moons fired from one equatorial conduit | Pavonis 1.48°N; both moons within 2° of the equator; MMX samples | awaiting |
The table is read from top to bottom as the history of the model’s testing. The first seven rows each have observational support and each lack one calculation that would turn a match into a test — a multi-system isotope balance, a transport model of the metal, a joint density model for crust and centre of mass. R8 is the one requirement of the first edition that has been run as a statistical test with its thresholds fixed in advance, and it is the first key observation of the model (E.2). Of the ten requirements added later, three have already passed on measurements of Papers 6, 7 and 8, and the rest stand with the test that will decide them. The rows are not added up: R3 and R7 are two views of one distribution of crust, and the maria a third; counting them as three successes would weigh one parcel on three scales (Paper 11, §B.9).
E.2The two key observations
The first key observation: the exposure zones. If the Moon rounded on the tip of the pear — a ball squashed on the tip, its contact narrowing from 6,000 km to 3,000 km before detachment — the surface of the Moon carries the exposure sequence of that peeling as three concentric zones about the centre of the near side. The contact, at the centre, was exposed last, at release; the base annulus, at the limb, was exposed as the contact shrank during the rounding, the way a suction cup peeled from glass lets go first at its edge; the surface of the dome, on the far side, was exposed first. The share rule of Paper 3 places the boundaries: a contact cap of about 31° about the contact centre — the tip of the pear, at about 22–24°N; the zones are computed about 24.1°N 335.2°E, the centre of the contact as the author outlined it, 34.0° from the sub-Earth point, a belt to 70°, the far side beyond; the tests of September 2026 used the earlier boundaries, 41° and 90° about the sub-Earth point (Paper 11, §B.8). Three things must therefore order themselves by angular distance from the near-side centre, and by no other axis: the crustal thickness, since the far side is built of many layers of compacted sial that migrated up the pear to its tip, and of material that returned to it again and again; the oldest crater population, carried up on the shell and densest where it was exposed longest; and the character of the basins — which ejected and which only conducted. No assembled Moon predicts a concentric ordering about the near-side centre.
The tests are stated as numbers fixed before the count (Paper 11, §B.8): the crust thickens monotonically from the contact disc through the limb belt to the far side; the oldest crater population of the far side is denser than the limb belt’s by at least 1.1; the ringed mascon basins are concentrated in the limb belt (at least 40% of them at 41–105°); and no control axis orders the data as well as the sub-Earth axis. Together they read the peeling of the body from the tip of the pear at stage 4, the rounding — the geometry on which the whole construction rests.
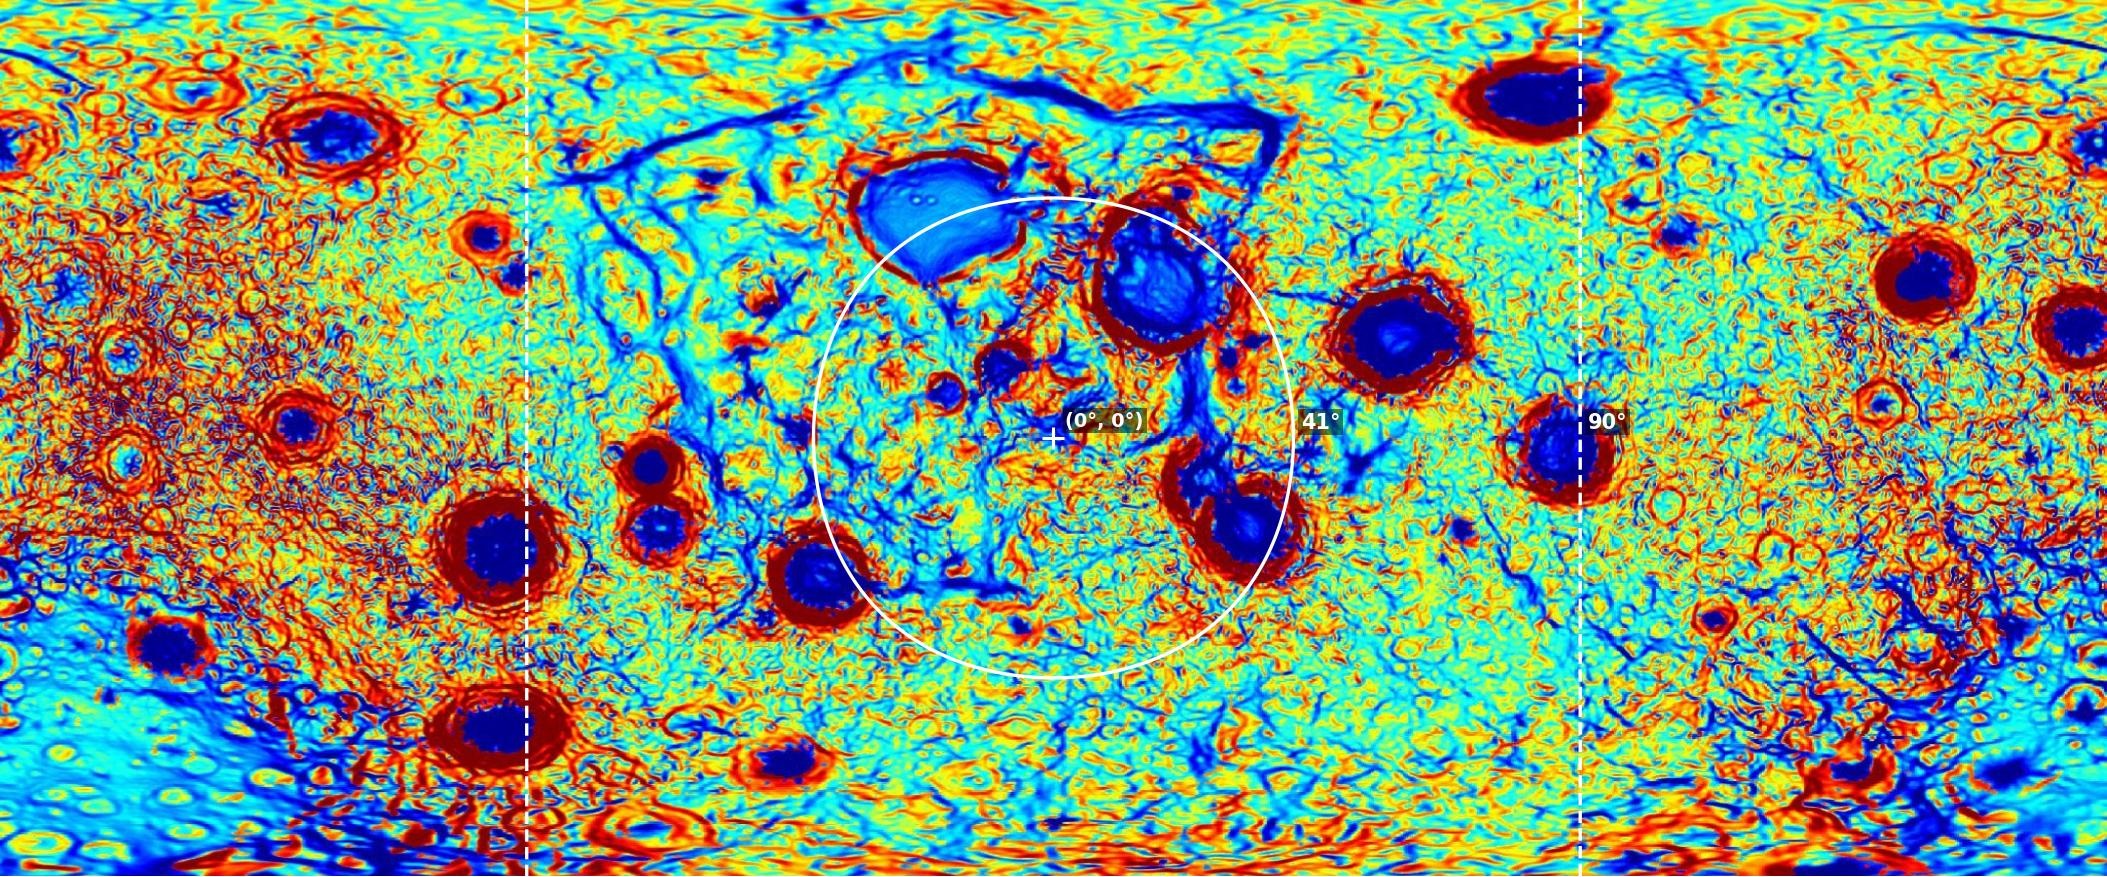
The figure is read from the centre outward. Inside the solid circle lie the strong mascons without rings — Imbrium, Serenitatis, Procellarum; between the circles lie the ringed basins — Orientale, Crisium, Humorum, Nectaris, Smythii, Humboldtianum, Moscoviense; beyond the dashed circle lie basins on thick, high crust with neither. That is the sequence the dome predicts. The map alone, however, is a reading, not a test; the test is the belt statistics.
The result. Run on the four GRAIL crustal-thickness models and the Robbins crater catalogue in September 2026 (Paper 11, §B.8), the ordering is present. The crust thickens from the contact disc to the limb belt to the far side in every model, ordered over twelve belts of 15° about the predicted axis ( in every model; on Model 1 monotonic over ten consecutive belts) and about no control axis (the poles and , the east limb ). The oldest craters order themselves as predicted: far/limb 1.34, far/disc 2.21, limb/disc 1.65, each above its pass line. The thickness contrast, far side minus contact disc, is 9.65, 10.0, 10.3 and 10.6 km in Models 1–4, and the ordering holds in all four; the size of the contrast is a number to be calibrated. Recomputed on the current geometry (contact cap 0–31°, belt 31–70°, far part 70–180°), the ordering holds in both quantities: craters km, maria and SPA removed, 53, 187 and 220 per km² (far/belt 1.17, far/cap 4.15, belt/cap 3.55); crust of Model 1, maria kept, 26.3, 30.3 and 36.2 km, far minus cap 9.9 km. The ordering test is therefore passed on the craters and on the axis; on the thickness the ordering is present in every model, and the size of the contrast, about 10 km, is left to calibration. T3 and T4, the basin classes, have not been run.
The second key observation: the material of the craters. In the model nearly all the Moon’s craters, some 99%, are of returned terrestrial material (Paper 6); foreign material, if it is found at all, will be in small amounts, and fine space dust is not counted. The craters record the material that left the Earth and came back, not a bombardment from outside. The number that measures it is the foreign mass. The result: read as impacts, the visible craters require – kg of foreign material, 2–6% of the upper 5 km of the crust, where the crust holds 0.9–2% at most and the ruthenium of the crater melts is terrestrial (Paper 6, Study 8).
E.3The status of the model
The LEF model is a process model. It proposes a sequence, computes each step, and states the test of each step. It does not present a simulation of the ascent: the three-dimensional stability of the connected body, the energy that drives the upwelling, the deep equation of state of the melt and the time at which the contact fails are the calculations it requires and has not yet performed (Paper 3, §D.4). The model claims that the Moon formed this way. In support it shows where the classical objection to fission went wrong: it computed the release at the Earth’s surface, where it would need enormous speeds that would break the Earth apart. With the pear, the pear raises itself to the corotation region and releases the material at its tip — in our case the Moon; the pear grows until the material at its tip detaches, and then the sorting draws the pear back in. The classical objection computed at the Earth’s surface; the model computes at the tip of the pear. It further shows that the route is open at the corotation radius, with an angular-momentum budget of 1.007 times today’s; that a hemisphere of the right size has the right density and the right surface without adjustment; that the same process on Mars gives what Mars has; that the Moon’s surface carries the ordering the process leaves, on the axis it predicts; and that the maria, the craters, the poles and South Pole–Aitken each pass the tests their papers set for them, 58 green rows and no red one.
It does not claim proof. Most requirements are now targets for calibration rather than open questions — the numbers are fixed, the tests are written, and the data exist or are coming. The series is a milestone in that sense: each requirement stands with its test, row by row, and Section E.2 gives the two key observations with their results; the requirements and their tests are set out in full in Paper 11.
The series
twelve papers carry one model. How are they divided, what does each answer, and what is left? The approach: one table of the papers with the question and the number of each; then the open work, stated as calculations to be made and as topics the model opens for others.
F.1 The twelve papers
The papers are written to be read in order but to stand alone; each carries the environment table, its own predictions and its own tests. The table gives each paper its question and the number that carries its answer. The shading follows the division of the series: navy for the papers that state the model and build and release the body (1–4), red for the papers that read the Moon’s surface (5–8), plain for the papers that test the model outside the Moon and gather its requirements (9–11), cream for the research topics.
| No. | Title | The question it answers | Its central number |
|---|---|---|---|
| 1 | The Model | What is the whole process, from the hot Earth to today’s Moon? | Release at 16,399 km, 3.873 Ga |
| 2 | LEF Mechanism in Principle | Can the Moon leave the Earth at orbital speed without being thrown, and does the angular momentum close? | 16,399 km at a 5.77-h day; budget 1.007, against 2.74 for the classical route |
| 3 | LEF Mechanism in Practice | How was the body built — fed from within, risen from without — and how did it let go? | 150 GPa at the source; 1,300 kg/m³ on the tip |
| 4 | The Orbit | Where does the inclination come from, and does the Moon recede from the start? | today |
| 5 | The Maria | What is a mare? | 33 of 34 on a feed dome; 44 of 73 domes buried |
| 6 | The Craters | What made the craters, and what do they record? | About 99% from returning material; 249–252 against 139–175 per km² |
| 7 | The Poles | Why are the poles crowded with craters? | , rising 1.09 1.53 with size |
| 8 | South Pole–Aitken | What is the great basin of the far side? | Central deficit 0.51; the model fits 16 of 17 anomalies |
| 9 | The Stripes | Where did the pear go, and where did the Moon sit? | Stripes 9,360 km against a pear of 9,680–9,800; tip 3,360 km |
| 10 | Mars | Can a fast young planet fire its own moons? | Gas push 2.4–2.9 km/s; a ring completes the orbit; Phobos caught by the line near 19,000 km |
| 11 | The Requirements | What must a Moon built this way look like, and does it? | 18 requirements; T5 , T2 1.34 |
| 12 | Research topics | What should be measured and computed next? | The open work of F.2–F.3 |
Read down the third column, the questions follow the process itself: how the Moon could leave (2), how it was built (3), how it went (4), what it carries on its surface (5–8), what the Earth kept (9), whether the same happened elsewhere (10), and what the whole must satisfy (11).
F.2What remains open — future work
Two subjects lie outside the series and are left, deliberately, for future work.
The system of axes. The axes of the Earth and the Moon, from release to today, are not solved in this series. Four planes are involved — the Earth’s equator, the Moon’s orbit, the Moon’s equator and the ecliptic; the axes move in two different ways and at very different rates; the memory of a frozen bulge is unknown; and the parts feed back on one another. The series therefore gives every position in today’s frame and says so where a past orientation matters: the 22.5° of release, the equator of the stripes inclined at least 10° to today’s, the southward direction of the dome of South Pole–Aitken. A change of the Earth’s axis after the separation may make SPA appear out of line with the burner; the solution of the axes may change parts of the model, and it is listed here first for that reason.
The magnetism of the Moon. Where the Moon’s ancient magnetism came from is not treated in the series. Its pattern over South Pole–Aitken — erased at the centre, strong on the trailing side, the swirls of Ingenii — is read as a record of heat and of iron from the Earth’s interior; the source of the field itself is future work.
The open computations. Within the series, each paper names the calculations it requires and has not made. They are gathered in the table, each with what it would close. None changes a number of the papers; each turns a requirement into a result.
| Computation | Named in | What it would close |
|---|---|---|
| A numerical simulation of the ascent | 3 | A body of the lunar mass, foamed to 1,300 kg/m³, fed under pressure through a 6,000-km base on a spinning, expanded parent: the first three-dimensional test of the mechanism. The initial state is fully specified in the series |
| The equation of state of volatile-rich melt at 50–150 GPa | 3, 10 | Whether the feed passes below 3,864 kg/m³ (shock and diamond-anvil experiments on hydrous and carbonated melts) |
| Energy balance and the time of failure of the contact | 3 | The work of the lift and the moment the viscous layer lets go |
| The stratified Maclaurin problem | 2 | A Clairaut–Darwin–Radau parent with descending iron: the corotation radius within 15,382–17,569 km (from to ), and Paper 4’s starting orbit |
| The thermal-orbital integration | 4 | No constant fits both today’s recession and the age; with the Laplace and Cassini transitions resolved, becomes a prediction of 5.145° |
| The trapped pressure at detachment | 7 | Its share in the Moon’s initial speed, and whether the release velocity of Paper 4 needs a correction |
| The Hf–W reservoir history | 11 | One chronology for signatures, metal transfer and angular momentum through the 600-Myr window |
| Metal transport and a joint density model | 11 | R2 and R13 (the core fraction); R3 and R7 together (thickness and centre of mass) |
| The figure with strength and the two-layer relaxation | 7 | The polar crowding from a stiff shell over a softer body; the strain in the shell |
| The tide on a body held by its base | 7 | The six-axis order as a number; the far-side crown; the largest craters (1.84) |
| The engine of the openings | 5, 7 | The critical flux and the sealing time of each mare; the yield of craters from the openings about 90°E |
| The heat axis, its energy and its redox budget | 8 | Whether the burner’s heat compacts the column, closes the pores and erases the craters of SPA; the dynamic tests recomputed at 5.77 h |
| The gas push in the conduit, and the ring | 10 | The critical step of the Martian account: a soft plug pushed 200–300 km by trapped gas; the ring that completes the orbits |
F.3Research topics the model opens
A process model earns its place by the work it makes possible. The topics below follow directly from the sequence of the model; each is a measurement or a study that would advance a step, and each is stated with the result it expects. They are gathered in Paper 12, Research topics — a companion paper that stands outside the papers of the model itself: it adds no step to the process, but collects, from all the papers and from the working notes of the series, 118 topics that the model opens for other researchers, each with its question, the model’s prediction, the data and the method.
The belt statistics, completed (R8). The basin classes T3 and T4, and T2 on an age-selected crater population: the axis, belts and thresholds are fixed (Paper 11, §B.8); GRAIL, LOLA and the crater catalogues suffice.
The samples of MMX. Phobos material returns in 2031. Martian isotopes with no impactor component, closed vesicles of a cooled foam, and a centre of mass displaced toward Mars, toward the blunt end, are the results the Mars paper predicts (Paper 10, Part III; mission schedule [29]). That pits never cross grooves can be tested now, on existing images.
The far-side crust as the Earth’s sial. If the far-side crust is built of many layers of compacted terrestrial sial that migrated to the tip of the pear, and of material that returned to it again and again, its bulk composition should be sialic in the sense of the early Earth’s surface, it should grow denser and richer in iron with depth (central peaks against depth of origin, Paper 3), and it may reach deeper than the crustal models now assume. Chang’e-6 material and future far-side sampling test the first; central peaks of different depth of origin test the second.
The metal of the ancient norites. Isotopes of Cr, Ti, Mo, Ru and Os in the iron–nickel metal of the two dated Chang’e-6 norites, and Ru and Os isotopes in the melts of each basin of the maria: the model expects this metal to be terrestrial. Foreign material, if it is found at all, should be in tiny amounts — space dust, one or two meteorites landed over four billion years (E.2; Papers 5, 8).
The Pacific lower mantle. The position of the base over the Pacific province has passed; its composition, its shape against the African province, and the isotopes of the plumes rising from it remain. We propose — with reservation, since the nature of the deep provinces is still open (the Pacific one may be core-related material that did not finish sorting) — that the Pacific province is largely the returned pear, part of the sorted material that went back into the Earth; the model expects it denser and richer in iron than the African (Paper 3, Part E).
The stripes. The nine studies of Paper 9, Part G: the equator refitted on full traces, the chance test of the base on it, the one-sided order of the stripes, the steps in depth and age, the trailing side, continuity beneath the ridges, the spatula ridges against plume tracks, the mirror imprint at the scale 1.37, and seismic profiles across the fold beneath the dated layers.
The young craters of the poles. A dated sample of some 150 young craters in the polar caps decides Test D.3 of Paper 7; the model expects it to show no excess, as the young craters formed on the round body.
The maria at higher resolution. The thorium map at 26 km over the feed domes; the youngest basalt of each mare against the contact centre, which should grow younger toward it if the contact maria sealed last (Paper 5).
The other bodies. The process, run on Venus (one turn in 243 days) and Mercury (59 days), lifts nothing; run on a fast-spinning super-Earth it lifts more. A parameter study in spin, mass and volatile content would turn the family argument of Paper 10 into a prediction for the moons of other planets.
None of these is exotic; each is a calculation or a measurement within reach of an existing group, and each would either strengthen a step of the process or remove it.
Code availability
Paper 1 computes nothing new: every number in it is taken from Papers 2–11, and each is reproduced by the scripts of the LEF reproduction package (Python 3, numpy, scipy), which print the values of each section from the inputs stated in the text, together with the counts, belt means and catalogue selections behind the traffic light of Part D. The package is attached to this preprint as supplementary material (LEF_code_and_data.zip). An earlier version of the series and of the package is deposited at doi:10.5281/zenodo.22743615.
References
[1] Ribas, I., Guinan, E. F., Güdel, M., & Audard, M. (2005). Evolution of the solar activity over time and effects on planetary atmospheres. I. High-energy irradiances (1–1700 Å). The Astrophysical Journal, 622, 680–694.
[2] Young, E. D., Kohl, I. E., Warren, P. H., Rubie, D. C., Jacobson, S. A., & Morbidelli, A. (2016). Oxygen isotopic evidence for vigorous mixing during the Moon-forming giant impact. Science, 351, 493–496.
[3] Lock, S. J., Stewart, S. T., Petaev, M. I., Leinhardt, Z. M., Mace, M. T., Jacobsen, S. B., & Ćuk, M. (2018). The origin of the Moon within a terrestrial synestia. Journal of Geophysical Research: Planets, 123, 910–951.
[4] Ćuk, M., & Stewart, S. T. (2012). Making the Moon from a fast-spinning Earth: a giant impact followed by resonant despinning. Science, 338, 1047–1052.
[5] Pahlevan, K., & Morbidelli, A. (2015). Collisionless encounters and the origin of the lunar inclination. Nature, 527, 492–494.
[6] Jutzi, M., & Asphaug, E. (2011). Forming the lunar farside highlands by accretion of a companion moon. Nature, 476, 69–72.
[7] Hartmann, W. K., & Davis, D. R. (1975). Satellite-sized planetesimals and lunar origin. Icarus, 24, 504–515.
[8] Zhang, J., Dauphas, N., Davis, A. M., Leya, I., & Fedkin, A. (2012). The proto-Earth as a significant source of lunar material. Nature Geoscience, 5, 251–255.
[9] Weber, R. C., Lin, P.-Y., Garnero, E. J., Williams, Q., & Lognonné, P. (2011). Seismic detection of the lunar core. Science, 331, 309–312.
[10] Wieczorek, M. A., et al. (2013). The crust of the Moon as seen by GRAIL. Science, 339, 671–675.
[11] Hauri, E. H., Weinreich, T., Saal, A. E., Rutherford, M. C., & Van Orman, J. A. (2011). High pre-eruptive water contents preserved in lunar melt inclusions. Science, 333, 213–215.
[12] Darwin, G. H. (1879). On the precession of a viscous spheroid, and on the remote history of the Earth. Philosophical Transactions of the Royal Society, 170, 447–538. See also Wise, D. U. (1963). An origin of the Moon by rotational fission during formation of the Earth’s core. Journal of Geophysical Research, 68, 1547–1554.
[13] Farhat, M., Auclair-Desrotour, P., Boué, G., & Laskar, J. (2022). The resonant tidal evolution of the Earth–Moon distance. Astronomy & Astrophysics, 665, L1.
[14] Robbins, S. J. (2019). A new global database of lunar impact craters 1–2 km: 1. Crater locations and sizes, comparisons with published databases, and global analysis. Journal of Geophysical Research: Planets, 124, 871–892. doi:10.1029/2018JE005592.
[15] Wang, Y., Wu, B., Xue, H., Li, X., & Ma, J. (2021). An improved global catalog of lunar impact craters (1 km) with 3D morphometric information and updates on global crater analysis. Journal of Geophysical Research: Planets, 126, e2020JE006728. doi:10.1029/2020JE006728.
[16] Losiak, A., et al.; revised by T. Öhman (2015). Lunar Impact Crater Database, v08Sep2015. Lunar and Planetary Institute.
[17] Mazrouei, S., Ghent, R. R., Bottke, W. F., Parker, A. H., & Gernon, T. M. (2019). Earth and Moon impact flux increased at the end of the Paleozoic. Science, 363, 253–257.
[18] Lemoine, F. G., Goossens, S., Sabaka, T. J., et al. (2014). GRGM900C: a degree 900 lunar gravity model from GRAIL primary and extended mission data. Geophysical Research Letters, 41, 3382–3389. doi:10.1002/2014GL060027.
[19] Goossens, S., Fernández Mora, Á., Heijkoop, E., & Sabaka, T. J. (2021). Patched local lunar gravity solutions using GRAIL data. Earth and Space Science, 8, e2021EA001695. doi:10.1029/2021EA001695.
[20] Barker, M. K., Mazarico, E., Neumann, G. A., Zuber, M. T., Haruyama, J., & Smith, D. E. (2016). A new lunar digital elevation model from the Lunar Orbiter Laser Altimeter and SELENE Terrain Camera. Icarus, 273, 346–355. doi:10.1016/j.icarus.2015.07.039.
[21] Nelson, D. M., Koeber, S. D., Daud, K., Robinson, M. S., Watters, T. R., Banks, M. E., & Williams, N. R. (2014). Mapping lunar maria extents and lobate scarps using LROC image products. 45th Lunar and Planetary Science Conference, abstract 2861.
[22] Otake, H., Ohtake, M., & Hirata, N. (2012). Lunar iron and titanium abundance algorithms based on SELENE (Kaguya) Multiband Imager data. 43rd Lunar and Planetary Science Conference, abstract 1905.
[23] Lawrence, D. J., Elphic, R. C., Feldman, W. C., Prettyman, T. H., Gasnault, O., & Maurice, S. (2003). Small-area thorium features on the lunar surface. Journal of Geophysical Research: Planets, 108(E9), 5102. doi:10.1029/2003JE002050.
[24] Neumann, G. A., Zuber, M. T., Wieczorek, M. A., et al. (2015). Lunar impact basins revealed by Gravity Recovery and Interior Laboratory measurements. Science Advances, 1, e1500852. doi:10.1126/sciadv.1500852.
[25] Cottaar, S., & Lekic, V. (2016). Morphology of seismically slow lower-mantle structures. Geophysical Journal International, 207, 1122–1136. doi:10.1093/gji/ggw324.
[26] Becker, T. W., & Boschi, L. (2002). A comparison of tomographic and geodynamic mantle models. Geochemistry, Geophysics, Geosystems, 3, 1003. doi:10.1029/2001GC000168. (SMEAN.)
[27] Jackson, M. G., Konter, J. G., & Becker, T. W. (2017). Primordial helium entrained by the hottest mantle plumes. Nature, 542, 340–343. doi:10.1038/nature21023. (SMEAN2.)
[28] Sandwell, D. T., Müller, R. D., Smith, W. H. F., Garcia, E., & Francis, R. (2014). New global marine gravity model from CryoSat-2 and Jason-1 reveals buried tectonic structure. Science, 346, 65–67.
[29] JAXA. Martian Moons eXploration — Mission Overview and Mission Schedule. https://www.mmx.jaxa.jp/en/. Checked 11 September 2026.
The series: Duran, Z. Papers 2–12 of this series (2026): 2 LEF Mechanism in Principle; 3 LEF Mechanism in Practice; 4 The Orbit; 5 The Maria; 6 The Craters; 7 The Poles; 8 South Pole–Aitken; 9 The Stripes; 10 Mars; 11 The Requirements; 12 Research topics. Author’s manuscripts, posted in sequence as preprints on Preprints.org, with earlier versions at doi:10.5281/zenodo.22743615; they are the source of the model’s calculations and are not external validation of it.
Author: Zohar Duran, Independent Researcher, Ramla, Israel. ORCID 0009-0005-3194-9387. No public or commercial funding was received. A United States provisional patent application (No. 64/116,844, filed 22 July 2026) exists for an engineering apparatus related to the model.
Use of AI tools: The author used AI assistants (Claude, Anthropic; ChatGPT, OpenAI; Google’s AI search assistant) to write and run the computation scripts, to analyse the catalogues and maps, to prepare figures and tables, to discuss the scenarios, and for language editing and translation. The model and its conclusions are the author’s. The author checked the content and takes full responsibility for it.